Changes in cerebral oxygen saturation and cerebral blood flow velocity under mild +Gz hypergravity
日本大学大学院医学研究科博士課程 生理系宇宙航空環境医学専攻
小西 透 修了年
2021
年 指導教員 岩﨑 賢一RESEARCH ARTICLE
Changes in cerebral oxygen saturation and cerebral blood flow velocity under mild ⫹Gz hypergravity
Toru Konishi,1,2Takuya Kurazumi,1Tomokazu Kato,1Chiharu Takko,1Yojiro Ogawa,1and Ken-ichi Iwasaki1
1Department of Social Medicine, Division of Hygiene, Nihon University School of Medicine, Tokyo, Japan; and2Aeromedical Laboratory, Japan Air Self-Defense Force, Ministry of Defense, Saitama, Japan
Submitted 22 February 2019; accepted in final form 28 May 2019
Konishi T, Kurazumi T, Kato T, Takko C, Ogawa Y, Iwasaki K. Changes in cerebral oxygen saturation and cerebral blood flow velocity under mild⫹Gz hypergravity.J Appl Physiol127: 190 –197, 2019. First published June 6, 2019; doi:10.1152/japplphysiol.
00119.2019.—We previously reported that cerebral blood flow (CBF) was reduced by even mild ⫹Gz hypergravity. Regional cerebral oxygen saturation as measured by near-infrared spectroscopy (C- rSO2) has been widely used to detect cerebral ischemia in clinical practice. For example, decreases in C-rSO2 reflect reduced CBF or arterial oxygen saturation. Thus it was hypothesized that C-rSO2
would decrease in association with reduced CBF during mild hyper- gravity. To test this hypothesis, we measured CBF velocity by transcranial Doppler ultrasonography and C-rSO2during mild⫹Gz hypergravity while participants were in a sitting position. Among 17 male participants, 15 completed 21 min of exposure to ⫹1.5 Gz generated by short-arm centrifuge. C-rSO2and mean CBF velocity in the middle cerebral artery (MCBFVMCA) during centrifugation were averaged every 5 min and compared with pre-hypergravity (⫹1.0 Gz).
C-rSO2 did not change significantly throughout centrifugation, al- though MCBFVMCAgradually decreased from the beginning (⫺1.2%
at 0 –5 min), and significantly decreased at 5–10 min (⫺4.8%), 10 –15 min (⫺6.7%), and 15–20 min (⫺7.4%). Contrary to our hypothesis, decreases in C-rSO2 were not detected, despite reductions in CBF velocity during hypergravity. Since some assumptions, such as unal- tered arteriovenous volume ratio, hemoglobin concentration, extracra- nial blood flow, and brain activity, need to be satisfied to monitor cerebral ischemia by C-rSO2, the present results suggest that these necessary assumptions for near-infrared spectroscopy are not always applicable, and that cerebral oxygenation may not precisely reflect decreases in CBF under mild⫹Gz hypergravity.
NEW & NOTEWORTHYTo our knowledge, this is the first study to evaluate simultaneously cerebral oxygenation monitored by near- infrared spectroscopy and cerebral blood flow (CBF) monitored by transcranial Doppler under ⫹1.5 Gz hypergravity. Contrary to our hypothesis, there was no significant correlation between CBF velocity and regional cerebral oxygen saturation (C-rSO2). However, an in- complete case nearly involving syncope suggests the possibility that C-rSO2can detect a remarkable decrease in CBF with development of presyncope during⫹Gz hypergravity.
artificial hypergravity; human centrifuge; near-infrared spectroscopy;
transcranial Doppler ultrasonography
INTRODUCTION
Humans are exposed to hypergravity in various situations, such as during launchings/landings of spacecraft and while performing aerial maneuvers in high-performance aircraft, rid- ing roller coasters, and participating in motorsports. The phys- iological impacts of hypergravity depend on various charac- teristics, such as direction, magnitude, onset rate, and/or sus- tained time (33). On the other hand, it has been proposed that intermittent exposure to mild⫹Gz (head-to-foot) hypergravity in a human centrifuge could help prevent or mitigate space- flight-induced physiological deconditioning (7, 10). Under- standing the physiological changes experienced by humans during exposure to mild⫹Gz hypergravity is therefore impor- tant for understanding various situations, as well as for the future implementation of human centrifuges (10). We previ- ously reported that cerebral blood flow (CBF) as measured by transcranial Doppler ultrasonography (TCD) was significantly reduced under even mild⫹Gz hypergravity, and did not lead to any changes in arterial blood pressure (ABP) at heart level (15, 20, 24).
Cerebral oxygenation as measured by near-infrared spectros- copy (NIRS) has been clinically used to monitor cerebral ischemia (3, 14, 19). For example, decreases in cerebral oxy- genation indexes are thought to reflect reduced CBF, hemo- globin concentration, or arterial oxygen saturation (SaO2).
Thus it was hypothesized that cerebral oxygenation would decrease in association with reduced CBF under mild ⫹Gz hypergravity. However, to our knowledge, no study has been conducted to evaluate simultaneously changes in CBF and cerebral oxygenation under ⫹Gz hypergravity. Therefore, to test this hypothesis, we evaluated changes in regional cerebral oxygen saturation as measured by NIRS (C-rSO2) during 21 min of⫹1.5 Gz centrifugation and compared the results with those in CBF velocity as measured by TCD.
METHODS
Participants.The entire study protocol was approved by the Insti- tutional Review Board of Nihon University School of Medicine (No.
29 –2-0; 4 July 2017) and registered in the University Hospital Medical Information Network (UMIN) clinical trial registry (ID:
UMIN000028466). The study procedures adhered to the tenets of the Declaration of Helsinki. In total, 17 healthy male volunteers who had no prior experience with a human centrifuge participated in the study (age 24⫾1 yr; height 172.6⫾6.6 cm; weight 69.2⫾7.7 kg;
mean⫾SD). All participants provided written informed consent and were screened based on their medical history and a physical exami- Address for reprint requests and other correspondence: K. Iwasaki, Dept. of
Social Medicine, Div. of Hygiene, Nihon Univ. School of Medicine, 30-1, Oyaguchi-Kamicho, Itabashi-ku, Tokyo 173-8610, Japan (e-mail: iwasaki.
First published June 6, 2019; doi:10.1152/japplphysiol.00119.2019.
Licensed under Creative Commons Attribution CC-BY 4.0:©the American Physiological Society. ISSN 8750-7587. http://www.jappl.org 190
nation, including an electrocardiogram and ABP measurement. In addition, in all participants it was confirmed that CBF velocity signals in the middle cerebral artery (MCA) could be obtained by TCD. All participants fasted for ⱖ2 h before the experiments, and refrained from engaging in heavy exercise or consuming caffeinated or alco- holic beverages for at least 12 h before the experiments.
Equipment. The short-arm human centrifuge (Daiichi Medical, Tokyo) at Nihon University was used in the present study. The experimental room where the centrifuge is located was environmen- tally controlled at an ambient temperature of 23~25°C. A gimbaled cabin was attached to the end of a rotating arm with a radius of 1.7 m.
The participants were seated facing outside the cabin and instructed to minimize their head movement. The top of the cabin reclined toward the center during centrifugation. The resultant force, which was a combination of the Earth’s gravitational force and the centrifugal force, was directed along the participant’s longitudinal (head-to-foot) axis. To limit the visual stimuli and prevent nausea during centrifu- gation, the cabin door was closed so that the participant could not see outside.
A three-lead electrocardiogram and SaO2by pulse oximetry (SpO2) were monitored (Life Scope PT, BSM-1763; Nihon Kohden, Tokyo).
Regional oxygen saturation (rSO2) was measured using two probes on an NIRS module (INVOS SPS; Covidien, Mansfield, MA), and the data were sent to a Life Scope TR monitor (BSM-6301, Nihon Kohden). One probe was placed on the right side of the forehead to measure C-rSO2and the other was placed on the left upper arm at heart level to measure peripheral rSO2 (P-rSO2). Partial pressure of expiratory carbon dioxide (CO2) was monitored by an infrared CO2
sensor (OLG-2800; Nihon Kohden). Continuous ABP in the left middle finger was measured, and brachial ABP at heart level was obtained by subtracting the hydrostatic pressure between the finger and the heart using a height sensor (Finometer MIDI; Finapres Medical Systems, Amsterdam, The Netherlands). Continuous CBF velocity in the MCA was measured by TCD with a 2-MHz probe placed over the right temporal window (EZ-Dop; Compumedics Germany, Singen, Germany). The probe was fixed at a constant angle with a probe holder that was individually customized to fit the facial bones and ear structures of each participant just before data measure- ment.
Commercial software (Notocord-hem 4.3.0.74; Notocord, Paris, France) was used to record waveforms of the electrocardiogram, ABP, CBF velocity, and expiratory CO2with a 1-kHz sampling rate. The SpO2, C-rSO2, and P-rSO2data were recorded using the Life Scope BSM-1763 with a 0.3-Hz sampling rate. Dedicated software (BSM PC-Viewer; Nihon Kohden) was used to extract these data.
Protocol.Pre-hypergravity (⫹1.0 Gz) data were collected from the participants before centrifugation for 6 min afterⱖ15 min of quiet rest in an upright sitting position in the cabin of centrifuge. The partici- pants were then exposed to mild hypergravity (⫹1.5 Gz) generated by the centrifuge. The centrifugation was kept at 24.3 rpm for 21 min to generate⫹1.5 Gz at heart level. The onset and offset rates were⫹0.5 G/min and – 0.1 G/min, respectively. Mild hypergravity (⫹1.5 Gz) data were collected for 21 min of⫹1.5 Gz centrifugation. Waveforms of the electrocardiogram, ABP, CBF velocity, and expiratory CO2
were continuously monitored by the doctors during centrifugation. In addition, a charge-coupled device camera was installed in the cabin to monitor the conditions of both the on-board participant and the inside of the cabin. Moreover, the on-board participant and the doctor who was in charge of operating the centrifuge could have a conversation via an intercom. However, participants who completed the scheduled protocol did not have conversations during centrifugation. If any signs and/or symptoms of suspected presyncope, such as nausea, sweating, gray-out, bradycardia, or hypotension, were observed, the centrifuga- tion was terminated. In the present study, 15 participants completed the scheduled centrifuge protocol, but 2 could not because of the development of strong nausea accompanied by abnormal vital signs.
Data analysis.Mean CBF velocity in the MCA (MCBFVMCA) and mean ABP at heart level (MAPheart) were obtained from each contin- uous waveform of CBF velocity and ABP on a beat-by-beat basis. The distance between the heart and the position where the TCD probe was placed was measured to calculate the hydrostatic pressure between heart and MCA level. Hydrostatic pressure was estimated as the measured distance (in cm) multiplied by 0.78 mmHg at⫹1.0 Gz or 1.17 mmHg at⫹1.5 Gz, assuming that the specific gravity of mercury at 37°C (density 13,500 kg/m3) referenced to 37°C water (density 993 kg/m3) is 13.6, and the specific gravity of whole blood at 37°C referenced to 37°C water is 1.06 (35). Mean ABP at the MCA level (MAPMCA) was then estimated by subtracting hydrostatic pressure from MAPheart. Heart rate (HR) was calculated on a beat-by-beat basis from the R-R interval obtained from the electrocardiogram continuous waveform. End-tidal CO2(ETCO2) was obtained from the expiratory CO2continuous waveform. The SpO2, C-rSO2, and P-rSO2data were extracted with a 1-Hz sampling rate.
To evaluate the time course of changes in the measured variables, the initial 5 min of 6-min pre-hypergravity (⫹1.0 Gz) data were used as a pre-hypergravity data segment. Mild hypergravity (⫹1.5 Gz) data during the 21-min centrifugation period were divided into the follow- ing four data segments by 5-min intervals from the point at which centrifugation reached 24.3 rpm (⫹1.5 Gz at heart level): 0 –5 min, 5–10 min, 10 –15 min, and 15–20 min. A total of five data segments (a pre-hypergravity data segment and 4 hypergravity data segments) were used for the analysis. Five-minute averages for MCBFVMCA, C-rSO2, P-rSO2, MAPheart, MAPMCA, HR, SpO2, and ETCO2were obtained by averaging data during each 5-min data segment.
Statistical analysis.All statistical analyses were performed using R (The R Foundation for Statistical Computing, Vienna, Austria). Data are shown as means⫾SD. Values of P ⬍ 0.05 were considered statistically significant. Normality was evaluated by the Kolmogorov- Smirnov test. For the variables with a normal distribution, one-way repeated-measures analysis of variance (ANOVA) was performed with data segment (pre-hypergravity, 0 –5 min, 5–10 min, 10 –15 min, and 15–20 min) as a factor, followed by Holm’s post hoc test (paired t-test with the P value adjusted by Holm’s method) for multiple comparisons. If the sphericity assumption was violated by Mauchly’s test in the ANOVA, the Greenhouse-Geisser correction was used to adjust the degrees of freedom. Therefore, for the variables for which sphericity were violated, the degrees of freedom (df) was not an integral number. For the variables that were not normally distributed, Friedman tests were performed with data segment as a factor, fol- lowed by Holm’s post hoc test (Wilcoxon signed-rank test with theP value adjusted by Holm’s method) for multiple comparisons. These statistical analyses were performed using EZR (Saitama Medical Center, Jichi Medical University, Saitama, Japan; https://cran.r- project.org/web/packages/RcmdrPlugin.EZR/), which is a graphi- cal user interface for R (16). To evaluate the relationship between C-rSO2and MCBFVMCA, the repeated-measures correlation anal- ysis first introduced by Bland and Altman (5) was performed using the rmcorr R package developed by Bakdash and Marusich (https://
cran.r-project.org/web/packages/rmcorr/) (4).
RESULTS
For the group averages, data from 15 participants who completed 21 min of exposure (age 24⫾1 yr; height 172.5⫾6.8 cm; weight 69.7⫾7.7 kg; mean⫾SD) were used. Table 1 shows the 5-min averages of measured vari- ables in each of the five data segments: one pre-hypergravity and four data segments during⫹1.5 Gz centrifugation (0 –5 min, 5–10 min, 10 –15 min, and 15–20 min). A significant main effect of data segment was found in MCBFVMCA
[F(1.83,25.73)⫽15.18, P ⬍ 0.001 (ANOVA)]. MCBFVMCA
tended to decrease from the beginning of centrifugation, but 191
CHANGES IN rSO2AND CBFV UNDER MILD⫹Gz
J Appl Physiol•doi:10.1152/japplphysiol.00119.2019•www.jappl.org Downloaded from journals.physiology.org/journal/jappl (119.240.041.088) on May 1, 2020.
MCBFVMCAat 0 –5 min did not reach statistical significance compared with pre-hypergravity (⫺1.2%). Then, MCBFVMCA
significantly decreased at 5–10 min (– 4.8%), 10 –15 min (⫺6.7%), and 15–20 min (⫺7.4%). However, no significant difference was found between 10 –15 min and 15–20 min. Figure 1 shows the changes in MCBFVMCA for all individual partici- pants who completed the scheduled centrifugation. C-rSO2
[F(1.82,25.49)⫽1.98,P⫽0.160 (ANOVA)] showed almost no change (⫺1.0% at 15–20 min). P-rSO2 [F(2.27,31.89)⫽0.50, P ⫽ 0.632 (ANOVA)] did not change significantly throughout centrifugation. Figure 2 shows the repeated-measures correlation between C-rSO2 and MCBFVMCA. The correlation coefficient (rrm) value was 0.208 (df⫽59, 95% confidence interval [– 0.05,0.44],P⫽0.106).
MAPheart significantly increased throughout centrifugation compared with pre-hypergravity [2⫽24.765, df⫽4, P ⬍ 0.001 (Friedman)]. On the other hand, MAPMCAduring cen- trifugation was lower than that during pre-hypergravity (–9.2% at 0 –5 min, – 8.6% at 5–10 min, –7.8% at 10 –15 min, and –5.7% at 15–20 min), and statistical significance was found at 0 –5 min and 5–10 min [2⫽18.268, df⫽4, P ⫽ 0.001 (Friedman)]. HR significantly increased throughout centrifugation compared with pre-hypergravity [F(2.20,30.87)⫽26.777, P ⬍ 0.001 (ANOVA)]. SpO2slightly but significantly increased compared with pre-hypergravity at 0 –5 min, and returned to pre-hypergrav- ity levels after 5–10 min [F(2.58,36.25)⫽10.04, P ⬍ 0.001 (ANOVA)]. ETCO2significantly decreased compared with pre- hypergravity throughout centrifugation [F(4,56)⫽77.48,P⬍ 0.001 (ANOVA)].
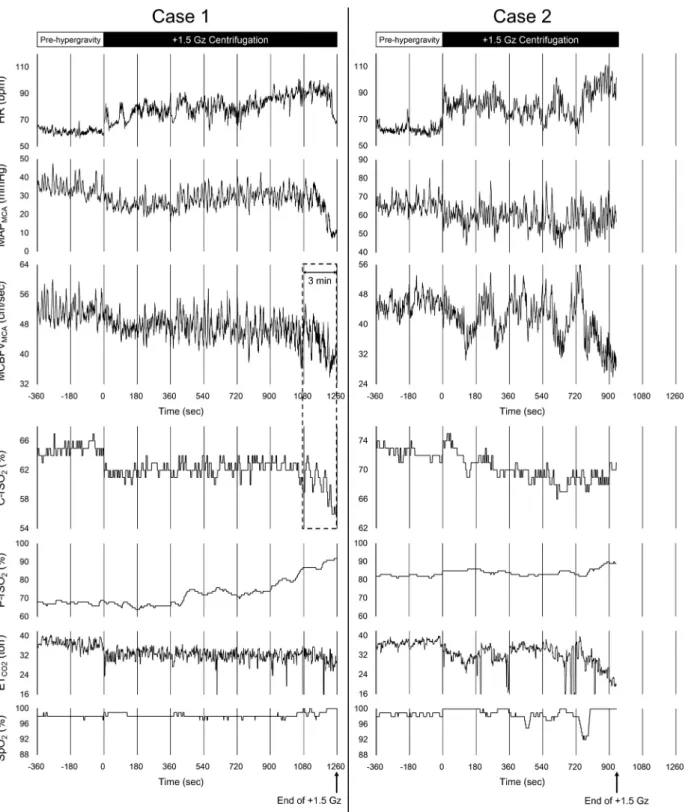
Two participants could not complete 21 min of exposure because of strong nausea accompanied by abnormal vital signs.
In one case, MAPMCArapidly decreased without decreases in HR (Fig. 3,case 1). Both MCBFVMCAand C-rSO2decreased simultaneously after ~18 min of exposure to ⫹1.5 Gz hyper- gravity. These decreases (percent change from pre-hypergrav-
ity data) during the last 3 min of⫹1.5 Gz hypergravity were –16.2% and –7.5%, respectively (dotted box in Fig. 3), while those during the last 1 min were –24.3% and –11.2%, respec- tively. HR remained increased, but showed a sudden drop just before the deceleration (termination of⫹1.5 Gz exposure). In the other case, although both HR and MAPMCA tended to increase, both MCBFVMCAand ETCO2rapidly decreased after
~12 min of exposure to⫹1.5 Gz hypergravity (Fig. 3,case 2).
No obvious change in C-rSO2was observed during this period.
These cases were carefully monitored, and both recovered a short time after stopping the centrifuge. Neither of the partic- ipants had any past medical history or any significantly differ- ent background characteristics compared with the other partic- ipants.
DISCUSSION
The aim of the present study was to test our hypothesis that C-rSO2would decrease in association with a reduction in CBF during mild ⫹Gz centrifugation by evaluating simultaneously changes in CBF and cerebral oxygenation. The results showed that MCBFVMCA gradually decreased from the beginning of the⫹1.5 Gz centrifugation and reached statistical significance after a 5–10 min data segment. On the other hand, no signifi- cant change in C-rSO2was detected throughout centrifugation.
No significant correlation was found between MCBFVMCAand C-rSO2. Contrary to our hypothesis, the results of the present study suggest that the changes in C-rSO2 did not precisely reflect the reduction in CBF under mild⫹Gz hypergravity in the participants who completed the exposure without any symptoms.
Monitoring of cerebral oxygenation as measured by NIRS has been widely used to detect cerebral ischemia, especially during cardiovascular surgery (3, 14, 19). Several assumptions, such as unaltered arteriovenous volume ratio, hemoglobin Table 1. Five-minute averages of measured variables before and during⫹1.5 Gz centrifugation
⫹1.0 Gz Pre-hypergravity
⫹1.5 Gz
Pvalue
0–5 min 5–10 min 10–15 min 15–20 min
MCBFVMCA, cm/s 51.5⫾12.5 50.3⫾10.7 48.5⫾10.4*†† 47.5⫾9.9**††‡‡ 47.2⫾10.0**††‡‡ ⬍0.001 (A)
C-rSO2, % 75.9⫾6.0 75.3⫾5.8 74.8⫾5.2 74.8⫾5.3 75.0⫾5.2 0.160
(A)
P-rSO2, % 79.5⫾4.6 79.6⫾4.8 79.0⫾4.9 79.6⫾5.2 79.6⫾5.3 0.632
(A) MAPheart, mmHg 79.9⫾13.9 86.3⫾11.4** 86.4⫾10.8* 86.8⫾10.4** 88.0⫾10.8*** ⬍0.001
(F)
MAPMCA, mmHg 56.1⫾14.3 50.6⫾12.1** 50.8⫾11.7* 51.1⫾11.3 52.3⫾11.6 0.001
(F)
HR, beats/min 65.0⫾9.0 71.8⫾8.6*** 72.1⫾9.6*** 72.6⫾9.4*** 73.4⫾10.0*** ⬍0.001
(A)
SpO2, % 98.0⫾1.0 98.7⫾0.8* 98.1⫾0.9††† 98.0⫾0.9†† 98.0⫾0.9†† ⬍0.001
(A)
ETCO2, Torr 39.0⫾2.5 35.4⫾2.9*** 34.8⫾2.8*** 34.8⫾2.9*** 34.4⫾2.7***† ⬍0.001
(A) Values are means⫾SD. Pre-hypergravity: average of pre-hypergravity 5-min sections (⫹1.0 Gz); 0 –5 min, 5–10 min, 10 –15 min, and 15–20 min: 5-min averages of the 0 –5-min, 5–10-min, 10 –15-min, and 15–20-min data segments during⫹1.5 Gz centrifugation. MCBFVMCA: mean cerebral blood flow velocity in the middle cerebral artery; C-rSO2: regional cerebral oxygen saturation; P-rSO2: regional oxygen saturation at heart level (upper arm); MAPheart: mean arterial pressure at heart level; MAPMCA: mean arterial pressure at the middle cerebral artery level; HR: heart rate; SpO2: peripheral arterial oxygen saturation; ETCO2: partial pressure of end-tidal carbon dioxide.Pvalues are expressed as one-way repeated-measures analysis of variance with data segment as a factor (A), or Friedman tests with data segment as a factor (F). *P⬍0.05, **P⬍0.01, ***P⬍0.001 (Pvalue of Holm’s post hoc test compared with the pre-hypergravity data segment); †P⬍0.05, ††P⬍0.01, †††P⬍0.001 (Pvalue of Holm’s post hoc test compared with the 0 –5-min data segment); ‡‡P⬍0.01 (Pvalue of Holm’s post hoc test compared with the 5–10-min data segment).
concentration, extracranial blood flow, and brain activity (6, 19, 28, 34, 38), need to be satisfied to monitor cerebral ischemia by cerebral oxygenation. Prior to the present exper- iment, we had assumed that the arteriovenous volume ratio at brain level would not change considerably during centrifuga- tion. The internal jugular vein, as the main venous outflow from the brain, might collapse in the upright sitting position in most study participants (13); therefore, an increase in the gravitational force by ⫹1.5 Gz hypergravity might change venous blood volume minimally in the brain. Also, we had assumed that hemoglobin concentration would not change during centrifugation. We had assumed that the impact of extracranial blood flow would be negligible because the NIRS- based oximetry used in the present study has multidistance light detectors and can subtract light absorption in superficial tissue from that in deeper tissue (32). Furthermore, it had been considered that brain activity would not change markedly in participants without presyncope under mild⫹Gz hypergravity.
Thus we had believed that the necessary assumptions to mon- itor cerebral ischemia by cerebral oxygenation would be sat- isfied under mild ⫹Gz hypergravity, and thus had hypothe- sized that C-rSO2would decrease mainly in association with a reduction of CBF under mild⫹Gz hypergravity.
However, contrary to our hypothesis, no significant changes in C-rSO2 were detected throughout centrifugation, although MCBFVMCAdecreased significantly. There are several possi-
ble mechanisms for explaining the present results of unchanged C-rSO2 despite the reduced CBF. First, the arteriovenous volume ratio at brain level might change during centrifugation;
this may be induced by decreases in cerebral venous blood volume due to the gravitational force during centrifugation. In some participants, an additional 0.5 gravitational force might drain venous blood through the noncollapsed internal jugular vein or the secondary veins of the vertebral, epidural, and deep cervical veins in the sitting position (2, 9) during hypergravity.
In addition, the cerebral autoregulation system should dilate arterioles as resistance vessels to maintain CBF, mitigating the reduced arterial pressure in the MCA during some periods of hypergravity, as will be mentioned later. It is possible that the dilation of arterioles leads to a relative increase in the percent- age of arterial blood volume despite decreases in CBF. The changes in the arteriovenous ratio should reduce the accuracy of C-rSO2monitoring because the NIRS-based oximetry used in the present study measures oxygen saturation using a fixed arteriovenous volume ratio of 75% venous and 25% arterial (34). Second, hemoglobin concentration might increase be- cause of plasma volume extravasation by the gravitational force (22) under hypergravity. Third, the NIRS-based oximetry used in the present study has been reported to be affected by extracranial contamination (17), so extracranial blood flow might change and affect the C-rSO2value during centrifuga- tion. Finally, brain activity might increase under even mild
⫹Gz hypergravity, inducing increases in regional blood flow by vascular dilation to compensate for the increased oxygen demand (37). In fact, Smith et al. (31) reported that in partic- ipants who showed symptoms of presyncope, prefrontal cortex activity was increased by psychological stress during centrif-
Fig. 1. Time course of changes in mean cerebral blood flow velocity in the middle cerebral artery before and during ⫹1.5 Gz centrifugation for all participants who completed the study protocol. Pre-hypergravity: average of pre-hypergravity 5-min sections (⫹1.0 Gz); 0 –5 min, 5–10 min, 10 –15 min, and 15–20 min: 5-min averages of the 0 –5-min, 5–10-min, 10 –15-min, and 15–20-min data segments during⫹1.5 Gz centrifugation. Lines with markers represent the changes in mean cerebral blood flow velocity in the middle cerebral artery during each data segment for each participant (n⫽15). White bars with error bars represent the average values and SDs of the 15 partici- pants.
Fig. 2. Repeated-measures correlation between regional cerebral oxygen sat- uration (C-rSO2) and mean cerebral blood flow velocity in the middle cerebral artery (MCBFVMCA). Each marker represents the measured values of each participant, and the total of 75 data points (5 data segments⫻15 participants who completed the task) are shown. Solid lines represent the regression line of each participant. The value of the repeated measures correlation coefficient (rrm) is shown with thePvalue.
193
CHANGES IN rSO2AND CBFV UNDER MILD⫹Gz
J Appl Physiol•doi:10.1152/japplphysiol.00119.2019•www.jappl.org Downloaded from journals.physiology.org/journal/jappl (119.240.041.088) on May 1, 2020.
ugation (maximum of⫹1.4 Gz). Thus the assumptions needed to use cerebral oxygenation as measured by NIRS for detecting cerebral ischemia cannot be always satisfied during mild⫹Gz hypergravity. In fact, some studies have evaluated the changes
in CBF by TCD and NIRS simultaneously. For example, good correlations between CBF velocity by TCD and NIRS-derived variables during cardiovascular surgery have been reported (14, 19); however, the response to head-up tilt has been
Fig. 3. Time courses of changes in measured variables for 2 participants whose centrifugation was terminated. Left-side charts show time courses of changes in measured variables forcase 1, and right-side charts show those forcase 2. From the top, each column shows the time courses of changes in heart rate (HR), mean arterial pressure at the middle cerebral artery level (MAPMCA), mean cerebral blood flow in the middle cerebral artery (MCBFVMCA), regional cerebral oxygen saturation (C-rSO2), regional peripheral (upper arm at heart level) oxygen saturation (P-rSO2), partial pressure of end-tidal carbon dioxide (ETCO2), and peripheral arterial oxygen saturation (SpO2). Values for HR, MAPMCA, and MCBFVMCAwere plotted on a beat-by-beat basis. Values for C-rSO2, ETCO2, P-rSO2, and SpO2were plotted with a 1-Hz sampling rate. The dotted box shows the last 3 min of⫹1.5 Gz hypergravity forcase 1. Incase 1, the elapsed time of⫹1.5 Gz centrifugation reached nearly 21 min, but was not fully completed.
controversial. Krakow et al. (21) reported the good followabil- ity of oxyhemoglobin and C-rSO2to MCBFVMCA, but Canova et al. (8) reported finding no correlation between tissue hemo- globin index and MCBFVMCA. Thus the relationship between TCD and NIRS has not always been constant in head-up tilt studies (8, 21), which have used different durations, head-up tilt angles, and participant populations. It is therefore important to consider the details of the study protocol and conditions that minimize the violation of necessary assumptions of NIRS.
Although intermittent and repeated exposure to artificial hypergravity via a human centrifuge has been proposed as a countermeasure against spaceflight-induced physiological de- conditioning (7, 10), in the present study, MCBFVMCA was significantly decreased under even mild ⫹Gz hypergravity, which was consistent with our previous reports (15, 20, 24).
Hence, the decreases in CBF were thought to be one of the adverse effects during even mild centrifugation, suggesting that careful monitoring of CBF is needed during the exposure.
However, several challenges remain for using TCD during centrifugation in a practical rather than an experimental setting, such as the difficulty in the fixation of the TCD probe at a constant angle without some specific methods, or the possibil- ity of an inadequate temporal acoustic window in some indi- viduals (23, 25). We had believed that alternative means would be needed to monitor CBF during centrifugation, and we had expected that the monitoring of cerebral oxygenation as mea- sured by NIRS would be easily utilizable and applicable to everyone. To our knowledge, there have been no reports evaluating the changes in CBF under ⫹Gz hypergravity by both NIRS and TCD simultaneously, but several studies have detected a reduction in CBF by NIRS under a “high” ⫹Gz hypergravity environment in participants who showed symp- toms of almost loss of consciousness (A-LOC) (27, 30). Ryoo et al. (27) reported an average⫺5.3% decrease in C-rSO2by NIRS during A-LOC. In general, decreases in MCBFVMCAare much larger during A-LOC. For example, Kawai et al. (18) reported an average⫺48% decrease in MCBFVMCAby TCD during A-LOC. In the present study, one of the two incom- plete cases was considered likely to be presyncope (Fig. 3, case 1). This case showed rapid and large decreases in both MCBFVMCA(⫺16.2%) and C-rSO2(⫺7.5%) during the last 3 min of⫹1.5 Gz hypergravity. Especially, the decreases in MCBFVMCA and C-rSO2reached to ⫺24.3% and ⫺11.2%
in the last 1 min. The followability of C-rSO2 to the decreases in MCBFVMCA was good during this period.
Therefore, the present and previous results together suggest that reduced CBF during centrifugation can be detected by cerebral oxygenation only if the extent of decreases in CBF is large enough to develop presyncope and preponderate the impact of violating the necessary assumptions for NIRS.
In addition, remarkable increases in P-rSO2, for which the probe was placed on the left upper arm at heart level, were observed in the two incomplete cases (Fig. 3). It was presumed that these increases in P-rSO2were due to sympathetic hyper- activity, which led to the dilation of cutaneous vessels induced by nitric oxide (NO) accompanying the release of acetylcholine in the sweat glands (39). On the other hand, no significant changes in P-rSO2or C-rSO2were detected in the complete cases. Therefore, P-rSO2can be used as the index when paying attention to the development of abnormal symptoms during mild⫹Gz centrifugation.
Although both of the incomplete cases showed rapid de- creases in MCBFVMCAduring the last few minutes before the termination of the study protocol, the mechanisms inducing the decreases in CBF seemed to differ. In one case (Fig. 3, case 1), which was similar to an orthostatic hypotension patient, MAPMCAremarkably decreased during the last few minutes of centrifugation; in association, MCBFVMCA also decreased. Furthermore, HR suddenly dropped just before the termination of exposure to ⫹1.5 Gz, suggesting that the va- sovagal reflex was induced. It was thought that this participant almost fell into syncope and the decreases in MCBFVMCA
indicated obvious cerebral hypoperfusion. Thus exposure to even mild⫹Gz hypergravity occasionally involves presyncope with cerebral hypoperfusion. In the other case (Fig. 3,case 2), both MCBFVMCAand ETCO2decreased remarkably during the last few minutes of ⫹1.5 Gz centrifugation, suggesting that hyperventilation was induced. It was considered that the nau- sea and hyperventilation in this participant were induced by vestibular and/or other stimuli; however, we cannot clearly state that these decreases in MCBFVMCAwith hyperventilated hypocapnia have similar physiological meaning or significance to the obvious cerebral hypoperfusion with hypotension, such as presyncope. No simultaneous change in C-rSO2 was ob- served during this period in this participant; thus the relation- ship between C-rSO2and CBF velocity under hyperventilated hypocapnia remains unclear.
In contrast to previous studies (15, 20, 24), we selected laymen who had no experience in a centrifuge as participants in the present study to detect physiological changes under mild hypergravity more clearly. As expected, many more data seg- ments and indexes showed statistically significant differences in post hoc tests in the present study compared with previous studies. Although the standard deviation of MCBFVMCA
was relatively large, the individual trends of changes in MCBFVMCAfor each participant were similar (Fig. 1). The decreasing rates of MCBFVMCAfor the 0 –5-min, 5–10-min, and 10 –15-min data segments were smaller than those of MAPMCA. On the other hand, MAPMCA tended to be re- stored in the latter half of ⫹1.5 Gz centrifugation, but MCBFVMCA was still decreasing, resulting in the greater decreasing rate of MCBFVMCA (⫺7.4%) compared with MAPMCA (⫺5.7%) for the 15–20-min data segment. This result suggested that cerebral autoregulation functioned during the early stages of mild⫹Gz hypergravity, but declined in the last stages of a 21-min centrifugation session in the laymen.
However, it was thought that these small decreases in CBF did not lead to any symptoms, including cognitive deficits, in the present study. Moreover, in the present study, two of the participants could not accomplish the scheduled centrifugation protocol. Therefore, the physiological impacts of hypergravity for laymen seemed to be stronger than those for experienced participants, suggesting that the duration of centrifugation and more careful monitoring should be considered for individuals who do not have much experience with centrifuges, even if the magnitude of hypergravity is small.
There were some limitations in the present study. The possibility of changes in MCA diameter is a common limita- tion for studies using TCD. The changes in CBF were esti- mated by the changes in CBF velocity in the MCA based on the assumption that the MCA diameter does not change (1, 29).
Recent studies have shown both dilation and constriction of the 195
CHANGES IN rSO2AND CBFV UNDER MILD⫹Gz
J Appl Physiol•doi:10.1152/japplphysiol.00119.2019•www.jappl.org Downloaded from journals.physiology.org/journal/jappl (119.240.041.088) on May 1, 2020.
MCA by high-resolution MRI during higher levels of hyper- capnia and hypocapnia, respectively (11, 12, 36). Therefore, the possibility of the constriction of the MCA due to significant decreases in ETCO2during centrifugation in the present study could not be ruled out. However, the constriction of the MCA would cause the recorded CBF velocity to underestimate the actual CBF decrease. Thus it was thought that the possibility of changes in MCA diameter would not affect the present results of significant decreases in CBF, at least from the viewpoint of arterial blood gas; however, whether hypergravity would affect the MCA diameter remains unclear. In fact, the possibility that the MCA diameter would dilate under mild⫹Gz hypergravity also cannot be ruled out. If this dilation occurred, it could lead to normal or even elevated volume flow despite decreases in CBF velocity. In addition, if an increase in local blood volume just under the NIRS electrode occurred, it could also lead to the present result that C-rSO2did not change despite decreases in CBF velocity. Moreover, since the relationship between CBF velocity and C-rSO2 under hyperventilated hypocapnia re- mains unclear, further study to evaluate this relationship using controlled breathing would be necessary. Another study eval- uating the sensibility of C-rSO2against changes in true hemo- globin saturation using mild hypoxic gas inhalation would also be useful. Furthermore, the participants in the present study had no experience with centrifuges before the experiment, and were much younger (24⫾1 yr) than the astronauts recently participating in long-duration spaceflight (48.6⫾4.7 yr) (26).
Therefore, the findings in the present study might not be applicable to recent astronauts and future space travelers.
In conclusion, to test our hypothesis that C-rSO2 would decrease in association with a reduction in CBF, we evaluated simultaneously C-rSO2and MCBFVMCAduring⫹1.5 Gz cen- trifugation. Contrary to our hypothesis, C-rSO2did not change throughout the centrifugation, whereas MCBFVMCAdecreased significantly. In addition, no significant correlation was found between MCBFVMCAand C-rSO2. The present results suggest that the necessary assumptions to monitor cerebral ischemia by cerebral oxygenation may not always be applicable, and cere- bral oxygenation as measured by NIRS may not reflect de- creases in CBF precisely under mild⫹Gz hypergravity. Thus measuring changes in CBF by NIRS may not be appropriate for the research setting. On the other hand, if the extent of decreases in CBF preponderate the impact of the violated necessary assumptions for NIRS, cerebral oxygenation might be able to detect decreases in CBF before the development of presyncope under even mild⫹Gz hypergravity, and therefore, might be useful for monitoring decreased CBF in clinical practice, such as in the field of aerospace medicine.
GRANTS
This study was supported by MEXT KAKENHI Grant Number JP15H05939, which is a part of “Living in Space [Grant-in-Aid for Scientific Research on Innovative Areas (2015–2019)]”.
DISCLOSURES
No conflicts of interest, financial or otherwise, are declared by the authors.
AUTHOR CONTRIBUTIONS
T. Konishi, Y.O., and K.I. conceived and designed research; T. Konishi, T.
Kurazumi, T. Kato, C.T., Y.O., and K.I. performed experiments; T. Konishi and K.I. analyzed data; T. Konishi, T. Kurazumi, T. Kato, C.T., Y.O., and K.I.
interpreted results of experiments; T. Konishi and K.I. prepared figures; T.
Konishi and K.I. drafted manuscript; T. Konishi, T. Kurazumi, T. Kato, C.T., Y.O., and K.I. edited and revised manuscript; T. Konishi, T. Kurazumi, T.
Kato, C.T., Y.O., and K.I. approved final version of manuscript.
REFERENCES
1. Aaslid R, Markwalder TM, Nornes H.Noninvasive transcranial Dopp- ler ultrasound recording of flow velocity in basal cerebral arteries. J Neurosurg57: 769 –774, 1982. doi:10.3171/jns.1982.57.6.0769.
2. Alperin N, Lee SH, Sivaramakrishnan A, Hushek SG.Quantifying the effect of posture on intracranial physiology in humans by MRI flow studies. J Magn Reson Imaging 22: 591–596, 2005. doi:10.1002/jmri.
20427.
3. Al-Rawi PG, Kirkpatrick PJ. Tissue oxygen index: thresholds for cerebral ischemia using near-infrared spectroscopy. Stroke 37: 2720 – 2725, 2006. doi:10.1161/01.STR.0000244807.99073.ae.
4. Bakdash JZ, Marusich LR.Repeated measures correlation.Front Psy- chol8: 456, 2017. [Erratum inFront Psychol 10: 1201, 2019.] doi:10.
3389/fpsyg.2017.00456.
5. Bland JM, Altman DG.Calculating correlation coefficients with repeated observations: Part 1–Correlation within subjects.BMJ310: 446, 1995.
doi:10.1136/bmj.310.6977.446.
6. Brown R, Wright G, Royston D. A comparison of two systems for assessing cerebral venous oxyhaemoglobin saturation during cardiopul- monary bypass in humans.Anaesthesia48: 697–700, 1993. doi:10.1111/
j.1365-2044.1993.tb07184.x.
7. Burton RR.A human-use centrifuge for space stations: proposed ground- based studies.Aviat Space Environ Med59: 579 –582, 1988.
8. Canova D, Roatta S, Bosone D, Micieli G. Inconsistent detection of changes in cerebral blood volume by near infrared spectroscopy in standard clinical tests. J Appl Physiol (1985)110: 1646 –1655, 2011.
doi:10.1152/japplphysiol.00003.2011.
9. Ciuti G, Righi D, Forzoni L, Fabbri A, Pignone AM. Differences between internal jugular vein and vertebral vein flow examined in real time with the use of multigate ultrasound color Doppler. AJNR Am J Neuroradiol34: 2000 –2004, 2013. doi:10.3174/ajnr.A3557.
10. Clément GR, Bukley AP, Paloski WH.Artificial gravity as a counter- measure for mitigating physiological deconditioning during long-duration space missions.Front Syst Neurosci9: 92, 2015. doi:10.3389/fnsys.2015.
00092.
11. Coverdale NS, Gati JS, Opalevych O, Perrotta A, Shoemaker JK.
Cerebral blood flow velocity underestimates cerebral blood flow during modest hypercapnia and hypocapnia.J Appl Physiol (1985)117: 1090 – 1096, 2014. doi:10.1152/japplphysiol.00285.2014.
12. Coverdale NS, Lalande S, Perrotta A, Shoemaker JK.Heterogeneous patterns of vasoreactivity in the middle cerebral and internal carotid arteries. Am J Physiol Heart Circ Physiol 308: H1030 –H1038, 2015.
doi:10.1152/ajpheart.00761.2014.
13. Dawson EA, Secher NH, Dalsgaard MK, Ogoh S, Yoshiga CC, González-Alonso J, Steensberg A, Raven PB. Standing up to the challenge of standing: a siphon does not support cerebral blood flow in humans.Am J Physiol Regul Integr Comp Physiol287: R911–R914, 2004.
doi:10.1152/ajpregu.00196.2004.
14. Grubhofer G, Plöchl W, Skolka M, Czerny M, Ehrlich M, Lassnigg A.
Comparing Doppler ultrasonography and cerebral oximetry as indicators for shunting in carotid endarterectomy. Anesth Analg 91: 1339 –1344, 2000. doi:10.1097/00000539-200012000-00006.
15. Iwasaki K, Ogawa Y, Aoki K, Yanagida R.Cerebral circulation during mild⫹Gz hypergravity by short-arm human centrifuge.J Appl Physiol (1985)112: 266 –271, 2012. doi:10.1152/japplphysiol.01232.2011.
16. Kanda Y.Investigation of the freely available easy-to-use software ‘EZR’
for medical statistics. Bone Marrow Transplant 48: 452–458, 2013.
doi:10.1038/bmt.2012.244.
17. Kato S, Yoshitani K, Kubota Y, Inatomi Y, Ohnishi Y. Effect of posture and extracranial contamination on results of cerebral oximetry by near-infrared spectroscopy. J Anesth 31: 103–110, 2017. doi:10.1007/
s00540-016-2275-1.
18. Kawai Y, Puma SC, Hargens AR, Murthy G, Warkander D, Lund- gren CE.Cerebral blood flow velocity and cranial fluid volume decrease during⫹Gz acceleration.J Gravit Physiol4: 31–34, 1997.
19. Kirkpatrick PJ, Lam J, Al-Rawi P, Smielewski P, Czosnyka M.
Defining thresholds for critical ischemia by using near-infrared spectros- copy in the adult brain.J Neurosurg89: 389 –394, 1998. doi:10.3171/jns.
1998.89.3.0389.
20. Konishi T, Kurazumi T, Kato T, Takko C, Ogawa Y, Iwasaki KI.
Time-dependent changes in cerebral blood flow and arterial pressure during mild⫹Gz hypergravity.Aerosp Med Hum Perform89: 787–791, 2018. doi:10.3357/AMHP.5106.2018.
21. Krakow K, Ries S, Daffertshofer M, Hennerici M. Simultaneous assessment of brain tissue oxygenation and cerebral perfusion during orthostatic stress.Eur Neurol43: 39 –46, 2000. doi:10.1159/000008127.
22. László Z, Rössler A, Hinghofer-Szalkay HG.Cardiovascular and hor- monal changes with different angles of head-up tilt in men.Physiol Res 50: 71–82, 2001.
23. Marinoni M, Ginanneschi A, Forleo P, Amaducci L.Technical limits in transcranial Doppler recording: inadequate acoustic windows.Ultrasound Med Biol23: 1275–1277, 1997. doi:10.1016/S0301-5629(97)00077-X.
24. Ogawa Y, Yanagida R, Ueda K, Aoki K, Iwasaki K.The relationship between widespread changes in gravity and cerebral blood flow.Environ Health Prev Med21: 186 –192, 2016. doi:10.1007/s12199-016-0513-7.
25. Postert T, Federlein J, Przuntek H, Büttner T.Insufficient and absent acoustic temporal bone window: potential and limitations of transcranial contrast-enhanced color-coded sonography and contrast-enhanced power- based sonography.Ultrasound Med Biol23: 857–862, 1997. doi:10.1016/
S0301-5629(97)00047-1.
26. Roberts DR, Albrecht MH, Collins HR, Asemani D, Chatterjee AR, Spampinato MV, Zhu X, Chimowitz MI, Antonucci MU.Effects of Spaceflight on astronaut brain structure as indicated on MRI.N Engl J Med377: 1746 –1753, 2017. doi:10.1056/NEJMoa1705129.
27. Ryoo HC, Sun HH, Shender BS, Hrebien L.Consciousness monitoring using near-infrared spectroscopy (NIRS) during high⫹Gz exposures.Med Eng Phys26: 745–753, 2004. doi:10.1016/j.medengphy.2004.07.003.
28. Samra SK, Stanley JC, Zelenock GB, Dorje P. An assessment of contributions made by extracranial tissues during cerebral oximetry. J Neurosurg Anesthesiol11: 1–5, 1999. doi:10.1097/00008506-199901000- 00001.
29. Serrador JM, Picot PA, Rutt BK, Shoemaker JK, Bondar RL.MRI measures of middle cerebral artery diameter in conscious humans during
simulated orthostasis.Stroke31: 1672–1678, 2000. doi:10.1161/01.STR.
31.7.1672.
30. Shender BS, Forster EM, Hrebien L, Ryoo HC, Cammarota JP Jr.
Acceleration-induced near-loss of consciousness: the “A-LOC” syndrome.
Aviat Space Environ Med74: 1021–1028, 2003.
31. Smith C, Goswami N, Robinson R, von der Wiesche M, Schneider S.
The relationship between brain cortical activity and brain oxygenation in the prefrontal cortex during hypergravity exposure.J Appl Physiol (1985) 114: 905–910, 2013. doi:10.1152/japplphysiol.01426.2012.
32. Steppan J, Hogue CW Jr.Cerebral and tissue oximetry.Best Pract Res Clin Anaesthesiol28: 429 –439, 2014. doi:10.1016/j.bpa.2014.09.002.
33. Stoll AM.Human tolerance to positive G as determined by the physio- logical end points.J Aviat Med27: 356 –367, 1956.
34. Thavasothy M, Broadhead M, Elwell C, Peters M, Smith M. A comparison of cerebral oxygenation as measured by the NIRO 300 and the INVOS 5100 Near-Infrared Spectrophotometers. Anaesthesia57: 999 – 1006, 2002. doi:10.1046/j.1365-2044.2002.02826.x.
35. Trudnowski RJ, Rico RC.Specific gravity of blood and plasma at 4 and 37 °C.Clin Chem20: 615–616, 1974.
36. Verbree J, Bronzwaer A-SGT, Ghariq E, Versluis MJ, Daemen MJAP, van Buchem MA, Dahan A, van Lieshout JJ, van Osch MJP.
Assessment of middle cerebral artery diameter during hypocapnia and hypercapnia in humans using ultra-high-field MRI.J Appl Physiol (1985) 117: 1084 –1089, 2014. doi:10.1152/japplphysiol.00651.2014.
37. Villringer A, Planck J, Hock C, Schleinkofer L, Dirnagl U. Near infrared spectroscopy (NIRS): a new tool to study hemodynamic changes during activation of brain function in human adults.Neurosci Lett154:
101–104, 1993. doi:10.1016/0304-3940(93)90181-J.
38. Watzman HM, Kurth CD, Montenegro LM, Rome J, Steven JM, Nicolson SC.Arterial and venous contributions to near-infrared cerebral oximetry. Anesthesiology 93: 947–953, 2000. doi:10.1097/00000542- 200010000-00012.
39. Wong BJ, Hollowed CG. Current concepts of active vasodilation in human skin.Temperature (Austin)4: 41–59, 2016. doi:10.1080/23328940.
2016.1200203.
197
CHANGES IN rSO2AND CBFV UNDER MILD⫹Gz
J Appl Physiol•doi:10.1152/japplphysiol.00119.2019•www.jappl.org Downloaded from journals.physiology.org/journal/jappl (119.240.041.088) on May 1, 2020.