37
平成29~30 年度厚生労働行政推進調査事業費補助金(循環器疾患・糖尿病等生活習慣病対策総合研究事業) 報告書
2013 年以降に出版された BMI(Body Mass Index)と
総死亡率の関連に関する観察研究のレビュー
研究協力者 齋藤あき
1、苑暁藝
2研究代表者 佐々木敏
21
医薬基盤・健康・栄養研究所 栄養疫学・食育研究部、
2東京大学大学院医学系研究科社会 予防疫学分野
【研究要旨】
日本人の食事摂取基準(2015 年版)において、エネルギーの指標として体格:BMI(Body Mass Index:体重(kg)/身長(m)2)が採用され、目標とする BMI の範囲が設定された。ここで目 標とする BMI は、観察研究で確認された総死亡率の低い範囲とされ、日本人の BMI の分布と 合わせて検討が行われた。本レビューにおいては、2020 年版の策定に向けて、2015 年版の策 定以降の主な観察研究の概要をまとめることとした。特に、体重減少に影響することが明らかに なっている因子の除外(例:ベースライン時の疾患、喫煙者)や、早期死亡者を除外した研究に 焦点を当てた。抽出した文献は 12 報である。東アジア人を対象に BMI と総死亡率の関連を検 討したプール解析からは、最も低い総死亡率を示す BMI は、35~49 歳では 18.5~25、50~69 歳では 20~25、70~89 歳では 20~27.5 であることが確認された。その他の研究結果について も、概ね同様の結果であったが、年齢や交絡因子によって結果にばらつきが確認された。今 後、より詳しい結果の精査を行う必要があるが、本レビューは食事摂取基準 2020 年版の策定に 資するものと考えられる。
A. 背景と目的
日本人の食事摂取基準(2015 年版)におい て、エネルギーの指標として BMI が採用され た。ここでは、目標とする BMI を、「観察研究 で確認された総死亡率の低い範囲」と定義し、
日本人の BMI の分布と合わせて検討が行わ れた結果、年代別(18~49 歳、50~69 歳、70 歳以上)に目標とする BMI の範囲が示され た。2020 年版の策定にあたっては、2015 年版 策定後の同様の観察研究結果について、再 度レビューが必要と考えられる。
他方、日本人の食事摂取基準 2015 年版で も明記された通り、この種の観察研究では、ベ ースライン調査時に潜在的な疾患や健康障害 が存在していたために既に体重減少を来して いる対象者の存在を否定できず、いわゆる「因
果の逆転」の可能性が否定できない(真の関 連よりもやや高めの BMI において総死亡率が 最も低くなっている場合があり得る)。これらの 事象が研究結果に与える影響については、国 内外での研究によって様々検討されており、
特に食事摂取基準 2015 年版策定以降の研 究報告が顕著に増加している。そこで、本レビ ューでは、因果の逆転を考慮した検討を重点 的にレビューすることにした。すなわち、体重 減少に影響することが明らかになっている因子 の除外(例:ベースライン時の疾患、喫煙者)
や、早期死亡者を除外した研究に焦点を当て ることとする。
本レビューでは、日本人の食事摂取基準
2020 年版の策定に向けて、2013 年以降に発
表された、ある時点の BMI と総死亡率の関連
38
についての観察研究についてレビューを行
い、そのうち主な研究の概要をまとめることとし た。
B. 方法
健康な集団を対象として、ある時点(ベース ライン時点)の BMI とその後の総死亡率の関 連を縦断的に検討した研究報告をまとめること にした。本レビューでは、2013 年以降に報告 された研究を対象とし、データベースには Pubmed を使用し、2017 年 10 月 5 日に検索 を行った。文献検索に用いた式は Supplement Material A に示す。文献の収集にあたって、
以下の研究は除外した:① BMI と総死亡率の 関連を扱っていない、② 観察研究またはシス テマティックレビュー・メタアナリシスではない、
③ 対象者が病気を有する集団(例:乳癌患者 など)または施設入所者のみ、④ BMI カテゴ リーに対するハザード比を算出していない、⑤ 日本語もしくは英語でない。また、BMI と総死 亡率の関連は直線型でないことが十分に明ら かになっていることから、BMI の明白なカテゴリ ーがない研究および直線関連のみを想定した 解析のみを実施している研究は除外した。
レビューテーマに合致した研究のうち、食事摂 取基準の対象となる日本人集団の特徴を考 え、高めの BMI(およそ BMI20 以上)の集団 のみを扱っている研究および BMI が 25 未満 の対象者を分割していない研究は除外するこ とにした。
さらに、研究の質(因果の逆転の可能性をでき るだけ除外)を考慮するため、以下の基準(1,2) のすべてを満たす解析を行っている研究につ いて取り上げることにした。
① 5 年以上追跡していること
② 追跡開始直後のイベント(死亡、ドロップア ウト)を除外していること
③ ベースライン時に疾患を有している研究参 加者を除外または統計的に調整していること
④ 喫煙状況で層別化していること
以上の条件に当てはまる研究(Sensitivity Analysis に含む場合も含む)について、内容を 表にまとめた。ただし、20 歳未満を対象とした 研究については、③と④の考慮をしていない 研究もまとめることとした。
C. 結果ならびに考察
レビューの概要を Figure 1 に示す。2013 年 以降に報告された研究のうち、健康な集団を 対象として、ある時点の BMI をその後の総死 亡率の関連を縦断的に検討した研究報告とし て、83 報が収集された。そのうち、BMI20 未満 の対象者が含まれていない、もしくは BMI25 未満の対象者が分割されていない研究が 19 報あった。上記の基準に当てはまる文献は 12 報だった。抽出された文献のうち、システマテ ィックレビューが 2 報、個別研究が 10 報(う ち、20 歳未満を対象とした研究が 2 報)であっ た。その概要を Table 1、Table2 に示す。
Aune らは BMI と総死亡率の関連に関する コホート研究のシステマティックレビュー・メタア ナリシスを実施し、BMI と総死亡率の U 字型 の関連が、喫煙歴の有無、疾病の有無(ベー スライン時の健康)、追跡期間の長さ、追跡直 後の死亡の除外によってどのように変化する かを示している(3)。この研究のうち、喫煙歴が ない人、喫煙歴がない健康な人、非喫煙者の うち喫煙歴がある人、現在喫煙者における BMI と総死亡率の関連を検討した結果を示す
(Figure 2)。最も低い総死亡率を示す BMI は、喫煙歴のない人では 23-24、喫煙歴がな い健康な人では 22-23、長期間(約 10 年以 上)の追跡に限定すると 20-22 の範囲だった。
因果の逆転を引き起こしている可能性として指
摘されてきたこれらの因子を考慮しないと、や
や高めの BMI で総死亡率が低く示されている
ことが示唆された。ただし、この研究は多くの
研究報告の結果を集約しているという利点が
ある一方で、ベースライン時の年齢の範囲が
大きく、食事摂取基準にそのまま反映すること
39
は難しいと考えられる。
The Global BMI Mortality Collaboration は、システマティックレビューにより検索された 世界 239 のコホート(日本の 30 コホートを含 む)に協力を依頼し、それらのコホート研究の 20 歳から 90 歳の研究参加者のプール解析を 実施している(4)。この研究においても、喫煙歴 のある人、疾患の既往のある人、初期段階で 追跡が終了した人を除くことで、最も低い総死 亡率を示す BMI が低めにシフトしたことが示さ れており、喫煙歴のある人、疾患の既往のある 人、初期段階(追跡開始 5 年間)で追跡が終 了した人を除いた検討結果が示されている。
Figure3 に示す通り、ベースライン時点の年齢 によって BMI と総死亡率の関連は少し異なる ようである。さらに、東アジア地域のコホート(61 コホート、追跡期間の中央値 13.9 年)のみに 限定した図が Figure 4 である。最も低い総死 亡率を示す BMI は、35~49 歳では 18.5~
25、50~69 歳では 20~25、70~89 歳では 20
~27.5 となっている。なお、男女別の解析も同 様に行われており、男性は女性に比較して高 BMI 及び低 BMI が示す総死亡率のハザード 比が高いことが示されているが、総死亡率が 最も低い BMI の範囲は概ね男女とも同じ範囲 であった。この研究の限界点として、5 年未満 の追跡研究は除外しているとはいえ、サブグ ループ解析を行った際の追跡期間の代表値 が記されていないことが挙げられる。
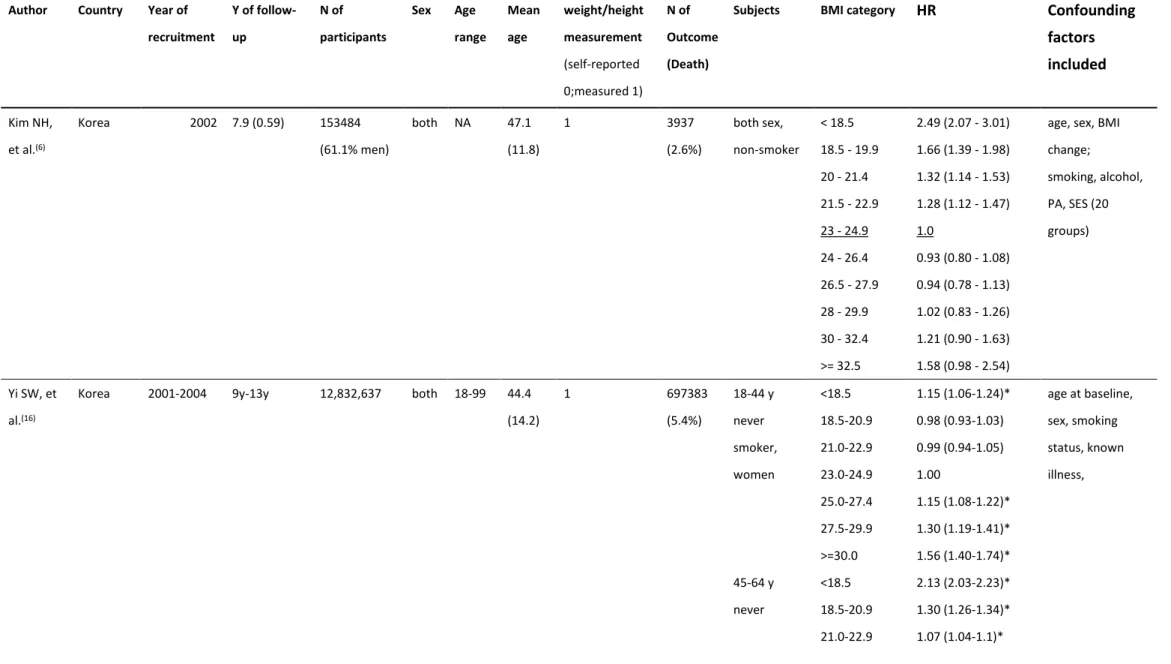
個別のコホート研究について、概要を Table 2 に示す。ここでは健康かつ非喫煙者(never smoker/non-smokers)の結果を示している。抽 出された中に日本からの研究報告はなかっ た。アジア地域では、韓国から 2 報、米国から 3 報、イスラエルから 2 報、オーストラリアとオ ーストリアからそれぞれ1報であった。全体的 に、前述のプール解析(5) で示された総死亡 率が低くなる範囲と大きな相違はないが、韓国 の研究のうち 1 報(6)では BMI が低ければ低く なるほど、死亡率のハザードが高くなり、逆に、
高い BMI は死亡率と有意な関連を示さなかっ た。この研究では、年齢階級での層別化解析 を行っていなかった。その他、解析に用いた交 絡因子の違いが確認された。
レビューの結果、除外した文献情報は Supplement Material B および C に示す。BMI と総死亡率の関連を検討するに当たって、特 に高齢者に関して、BMI だけでなく、虚弱(フ レイルティ)の有無を考慮した研究が複数(7–
10)行われていることを確認した。
D. 結論
本レビューは、2013 年以降に発表された BMI(Body Mass Index)と総死亡率の関連に 関する観察研究について、主要な研究報告を まとめることを目的に文献検索、収集を行い、
概ね主要な結果は網羅できた。
今回、因果の逆転に焦点を当てるため、基 準を設けたレビューを実施した。本レビューで 設定した基準を満たすには、より多くの研究参 加者が求められることから、特に一定の年齢集 団に焦点を当てた研究にとっては基準が厳し すぎるなどの理由で、食事摂取基準の策定に 当たって必要な研究を見落としている可能性 は否定できない。特に 80 歳以上の高齢者な どは、長期間の追跡が難しいことが考えられ、
高齢者を対象とした研究の多くについて、今 回設けた基準で除外することになった。レビュ ーでまとめた文献の中には、特に年齢階級で の層別化解析を行っていない等、因果の逆転 には考慮しても食事摂取基準の策定に活用し にくい内容も複数認められた。また、除外する 疾患は研究によってばらつきが認められ、その 他診断を受けていない疾患の存在など、取り 除ききれない交絡因子はどうしても存在するた め、そのような限界点を考慮した上で、今後、
今回のレビューをもとに丁寧な検討が求めら れると考えられる。
今回新たに、18 歳未満を対象とした研究報
40
告が 2 報認められた(11,12)。しかし、いずれも
イスラエルのほぼ同じ集団を対象とした研究で あることから、他の集団での検討結果も考慮す ることが望ましいと考えられる。
低い総死亡率に関連する BMI の範囲、特 に下限値は、年齢が上がるにつれて高まること が示唆された。ただし、BMI と総死亡率の関連 性が明らかに変化する年齢については不明で ある。また、特に高齢者を対象とした研究結果 を見ると、BMI の高値は死亡率の上昇には関 連しないと報告する研究も多い。しかし、肥満 に当たる BMI 高値(例えば 25 以上)を保つこ とがより健康であるかについては、より精査が 必要である。例えば、高齢者について、BMI の 範囲死亡をアウトカムとしない場合の研究によ ると、85 歳まで生存していた女性を対象に BMI と疾病の有無を検討した結果、BMI が 18.5~25 の人よりも、それ以上の人では、有 意に疾患を有するか、身体活動に制限が生じ る割合が高まっていることが示唆されている (13)。
また、BMI 高値が総死亡率低値に関連する ということについては BMI が低めの人が、BMI を上昇させることで死亡率が低下することを示 してはいない。Dahl らの報告によると、70~95 歳の高齢者を対象に体重変化と総死亡率の 関連を検討した結果、70~80 歳の対象者で は 18 年の観察期間中に±5%の BMI 変動 が、総死亡率を有意に高めたたことが示されて いる(14)。80 歳以上の対象者では有意な関連 がなかった。また、オーストリアの研究では、70 歳以上の人については、最も死亡率が低くな る BMI は男女で異なるかもしれないことを示 唆している(Figure 4)(15)。ただし、この研究に おける 75~84 歳の BMI の平均値は男女とも 25.6 と日本人集団よりも高めであると考えら れ、同様の結果が日本人でも見られるかはわ からない。以上より、今後、体重の変動が総死 亡率(健康)に関連するかについて、レビュー を行う必要があると考えられる。また、本レビュ
ーでは日本のコホート研究は対象とならなかっ たが、特に、日本の人口構造を考慮すると、我 が国の高齢者を対象とした研究に関しては別 の基準を設けて文献検索を行う必要があるか もしれない。
本レビューでは、BMI と総死亡率の関連に ついて、主要な内容を報告した。食事摂取基 準 2020 年版の策定に資するものと考えられ る。
E. 参考文献
1) Willett WC, Dietz WH & Colditz GA (1999) Guidelines for Healthy Weight. N Engl J Med 341, 427–434.
2) Flegal KM, Graubard BI & Yi S-W (2017) Comparative effects of the restriction method in two large observational studies of body mass index and mortality among adults. Eur J Clin Invest 47, 415–421.
3) Aune D, Sen A, Prasad M, et al. (2016) BMI and all cause mortality: Systematic review and non-linear dose-response meta-analysis of 230 cohort studies with 3.74 million deaths among 30.3 million participants. BMJ 353, 1083–
1096.
4) The Global BMI Mortality Collaboration (2016) Body-mass index and all-cause mortality: individual-participant-data meta- analysis of 239 prospective studies in four continents. Lancet 388, 776–786.
5) The Global BMI mortality Collaboration (2016) Body-mass index and all-cause mortality: individual-participant-data mata- analysis of 239 prospective studies in four continents. Lancet 388, 776–786.
6) Kim NH, Lee J, Kim TJ, et al. (2015) Body mass index and mortality in the general population and in subjects with chronic disease in Korea: A nationwide cohort study (2002- 2010). PLoS One 10, 1–16.
41 7) Boutin E, Natella PA, Schott AM, et al.
(2017) Interrelations between body mass index, frailty, and clinical adverse events in older community-dwelling women: The EPIDOS cohort study. Clin Nutr, 1–7.
8) Hamer M & Donovan GO (2017) Sarcopenic obesity , weight loss , and mortality : the English Longitudinal Study of Ageing. Am J Clin Nutr 106, 125–9.
9) Lee Y, Kim J, Han ES, et al. (2014) Frailty and body mass index as predictors of 3-year mortality in older adults living in the community. Gerontology 60, 475–482.
10) Nakazawa A, Nakamura K, Kitamura K, et al. (2013) Association between body mass index and mortality among institutionalized elderly adults in Japan. Environ Health Prev Med 18, 502–506.
11) Twig G, Afek A, Shamiss A, et al. (2014) Adolescence BMI and trends in adulthood mortality: A study of 2.16 million adolescents. J Clin Endocrinol Metab 99, 2095–2103.
12) Twig G, Yaniv G, Levine H, et al. (2016) Body-Mass Index in 2.3 Million Adolescents and Cardiovascular Death in Adulthood. N Engl J Med 374, 2430–2440.
13) Rillamas-Sun E, LaCroix AZ, Waring ME, et al. (2014) Obesity and late-age survival without major disease or disability in older women. JAMA Intern Med 174, 98–106.
14) Dahl AK, Fauth EB, Ernsth-Bravell M, et al. (2013) Body mass index, change in body mass index, and survival in old and very old persons. J Am Geriatr Soc 61, 512–8. NIH Public Access.
15) Peter RS, Mayer B, Concin H, et al. (2015) The effect of age on the shape of the BMI- mortality relation and BMI associated with minimum all-cause mortality in a large Austrian cohort. Int J Obes (Lond) 39, 530–4. Nature
Publishing Group.
16) Yi S-W, Ohrr H, Shin S-A, et al. (2015) Sex-age-specific association of body mass index with all-cause mortality among 12.8 million Korean adults: a prospective cohort study. Int J Epidemiol 44, 1696–1705.
17) Yu E, Ley SH, Manson JE, et al. (2017) Weight History and All-Cause and Cause- Specific Mortality in Three Prospective Cohort Studies. Ann Intern Med 166, 613.
18) Veronese N, Li Y, Manson JE, et al. (2016) Combined associations of body weight and lifestyle factors with all cause and cause specific mortality in men and women:
prospective cohort study. Bmj, i5855.
19) Joshy G, Korda RJ, Bauman A, et al.
(2014) Investigation of methodological factors potentially underlying the apparently
paradoxical findings on body mass index and all-cause mortality. PLoS One 9.
20) Chen Z, Klimentidis YC, Bea JW, et al.
(2017) Body Mass Index, Waist Circumference, and Mortality in a Large Multiethnic
Postmenopausal Cohort-Results from the Women’s Health Initiative. J Am Geriatr Soc, 1907–1915.
F. 健康危険情報 なし
G. 研究発表 1. 論文発表 なし 2. 学会発表 なし
H. 知的所有権の出願・登録状況 1. 特許取得
なし
2. 実用新案登録 なし
3. その他 なし
42 Figure 1 Process of the current review.
43 Figure 2 Non-linear dose-response analysis of BMI and all cause mortality among never smokers, healthy never smokers, all participants, current, former, and ever smokers (derived from: Aune D, Sen A, Prasad M, Norat T, Janszky I, Tonstad S, et al. BMI and all cause mortality: Systematic review and non-linear dose-response meta-analysis of 230 cohort studies with 3.74 million deaths among 30.3 million participants. BMJ. 2016;353:1083–96.)
44 Figure 3 Association of body-mass index with all-cause mortality, by baseline age group (derived from: The Global BMI Mortality Collaboration. Body-mass index and all-cause mortality:
individual-participant-data meta-analysis of 239 prospective studies in four continents. Lancet.
2016;388(10046):776–86.) The HR per 5 kg/m² higher body-mass index (BMI) and its 95% CI are calculated only for BMI more than 25·0 kg/m². Analyses restricted to never-smokers without pre- existing chronic disease, and excluding the first 5 years of follow-up, and include data from all geographical regions. The reference category is shown with the arrow and is 22·5–<25·0 kg/m². CIs are from floating variance estimates (reflecting independent variability within each category, including the reference category). Areas of squares are proportional to the information content.
45 Figure 4 Association of body-mass index with all-cause mortality in East Asia cohorts, by baseline age group (derived and edited from: The Global BMI Mortality Collaboration. Body-mass index and all-cause mortality:
individual-participant-data meta-analysis of 239 prospective studies in four continents. Lancet.
2016;388(10046):776–86.) BMI groups: 15 to <18.5, 18.5 to <20, 20 to <22.5, 22.5 to <25, 25 to <27.5, 27.5 to
<30, 30 to <35, 35 to <40, and 40 to <60 kg/m2. Reference category (arrow) is 22.5 to <25 kg/m2. Group- specific CIs are from floating variance estimates (reflecting independent variability within each category, including the reference group). Areas of squares are proportional to the information content in each.
46 Figure 5 BMI associated with minimum mortality and 95% confidence bands (dashed lines) for women (left) and men (right) (derived from Peter RS, Mayer B, Concin H, Nagel G. The effect of age on the shape of the BMI- mortality relation and BMI associated with minimum all-cause mortality in a large Austrian cohort. Int J Obes (Lond) [Internet]. 2015;39(3):530–4.)
47
Table 1
抽出されたシステマティックレビューの概要
Author Publication year
Data
inclusion Overview
Aune D, et al(3) 2016
up to 23 September
2015
A meta-analysis was performed.
Cohort studies of the association between BMI and risk of all- cause mortality published in English language including where:
(1) Adjusted relative risk estimates (hazard ratios or risk ratios) for three or more BMI categories had to be available, either with the 95% confidence intervals or with the information to calculate them
(2) the dose-response analysis, a quantitative measure of the exposure (BMI), also had to be available
(3) studies from populations living in the community were included, while studies that included only patients (for example, those with diabetes, stroke, heart disease, and cancer), nursing home
Studies that reported only a continuous linear risk estimate were excluded as there is evidence that the association between BMI and mortality is non-linear.
Global BMI Mortality Collaboration(4)
2016
January, 1970, to January, 2015
Data from large prospective studies (≥100 000 participants at baseline) or large multicohort consortia (total ≥100 000 participants at baseline). With agreement of over 500 investigators from over 300 institutions in 32 countries, combining individual-participant data from contributing studies was established.
Prospective cohort studies or consortia thereof were eligible if they:
(1) had information about weight, height, age, and sex (2) did not select participants on the basis of having any previous chronic disease
(3) recorded overall or cause-specific deaths
(4) had accrued 5 years or more of median follow-up.
48
Table 2
抽出されたコホート研究の概要
Author Country Year of recruitment
Y of follow- up
N of participants
Sex Age range
Mean age
weight/height measurement (self-reported 0;measured 1)
N of Outcome (Death)
Subjects BMI category HR Confounding
factors included
Kim NH, et al.(6)
Korea 2002 7.9 (0.59) 153484
(61.1% men)
both NA 47.1 (11.8)
1 3937
(2.6%)
both sex, non-smoker
< 18.5 18.5 - 19.9 20 - 21.4 21.5 - 22.9 23 - 24.9 24 - 26.4 26.5 - 27.9 28 - 29.9 30 - 32.4
>= 32.5
2.49 (2.07 - 3.01) 1.66 (1.39 - 1.98) 1.32 (1.14 - 1.53) 1.28 (1.12 - 1.47) 1.0
0.93 (0.80 - 1.08) 0.94 (0.78 - 1.13) 1.02 (0.83 - 1.26) 1.21 (0.90 - 1.63) 1.58 (0.98 - 2.54)
age, sex, BMI change;
smoking, alcohol, PA, SES (20 groups)
Yi SW, et al.(16)
Korea 2001-2004 9y-13y 12,832,637 both 18-99 44.4 (14.2)
1 697383
(5.4%)
18-44 y never smoker, women
<18.5 18.5-20.9 21.0-22.9 23.0-24.9 25.0-27.4 27.5-29.9
>=30.0
1.15 (1.06-1.24)*
0.98 (0.93-1.03) 0.99 (0.94-1.05) 1.00
1.15 (1.08-1.22)*
1.30 (1.19-1.41)*
1.56 (1.40-1.74)*
age at baseline, sex, smoking status, known illness,
45-64 y never
<18.5 18.5-20.9 21.0-22.9
2.13 (2.03-2.23)*
1.30 (1.26-1.34)*
1.07 (1.04-1.1)*
49 smoker,
women
23.0-24.9 25.0-27.4 27.5-29.9
>=30.0
1.00
1.00 (0.98-1.03) 1.10 (1.07-1.13) 1.32 (1.27-1.37) 65-99 y
never smoker, women
<18.5 18.5-20.9 21.0-22.9 23.0-24.9 25.0-27.4 27.5-29.9
>=30.0
1.70 (1.66-1.74)*
1.28 (1.26-1.31)*
1.10 (1.08-1.12)*
1.00
0.96 (0.94-0.98)*
1.00 (0.97-1.02) 1.07 (1.04-1.11)*
18-44 y never smoker, men
<17.5 17.5-18.9 19.0-20.4 20.5-21.9 22.0-23.4 23.5-24.96 25.0-26.4 26.5-27.9 28.0-29.4 29.5-30.9 31.0-50.0
2.86 (2.45-3.33)*
1.61 (1.46-1.79)*
1.34 (1.25-1.45)*
1.16 (1.09-1.24)*
1.07 (1.01-1.14)*
0.99 (0.93-1.05) 1.00
1.08 (1.00-1.16)*
1.24 (1.14-1.35)*
1.28 (1.13-1.45)*
1.68 (1.48-1.90)*
45-64 y never smoker, men
<17.5 17.5-18.9 19.0-20.4
3.82 (3.59-4.07)*
2.20 (2.10-2.31)*
1.73 (1.67-1.79)*
50 20.5-21.9
22.0-23.4 23.5-24.96 25.0-26.4 26.5-27.9 28.0-29.4 29.5-30.9 31.0-50.0
1.40-1.36-1.44)*
1.18 (1.15-1.21)*
1.05 (1.02-1.07)*
1.00
1.01 (0.98-1.05) 1.11 (1.07-1.15)*
1.16 (1.09-1.23)*
1.43 (1.33-1.53)*
65-99 y never smoker, men
<17.5 17.5-18.9 19.0-20.4 20.5-21.9 22.0-23.4 23.5-24.96 25.0-26.4 26.5-27.9 28.0-29.4 29.5-30.9 31.0-50.0
2.69 (2.60-2.78)*
1.89 (1.83-1.94)*
1.54 (1.50-1.58)*
1.34 (1.31-1.37)*
1.18 (1.15-1.20)*
1.06 (1.04-1.09)*
1.00
0.96 (0.93-0.99)*
1.01 (0.97-1.05) 1.00 (0.94-1.07) 1.10 (1.01-1.19)*
Yu E, et al.(17)
US NHS I: 1992
(1976) NHS II: 2005 (1989) HPFS: 2002 (1986)
m: 8.9 y (mean) w: 12.9 y (mean)
NHS I:
121700 NHS II:
116686 HPFS: 51529
both NHS I:
30-55 NHS II:
25-42 HPFS:
40-75
NHS I:
58 NHS II:
50 HPFS:
68
0 (but validated)
7817 men &
24754 women
never smoker
<18.5 18.5-19.9 20.0-22.4 22.5-24.9 25.0-27.4 27.5-29.9
1.93 (1.70-2.19)*
1.34 (1.22-1.48)*
1.09 (1.03-1.15)*
1.00
0.98 (0.93-1.04) 1.17 (1.10-1.25)*
race, Fm Hx CVD
& cancer, date on age, smoking (never, ever, catg
#), alcohol, menopausal Hx
51 (BMI >=30.0
not to include)
for women, HRT, parity,
contraceptive use, diet (by FFQ) Veronese
N, et al.(18)
US 1986
(HPFS);
1976 (NHS)
32 y 113,866
(74,582 women)
both w: 30 - 55 m: 40 - 75
NHS:
45.9 (7.2) HPFS:
52.9 (9.5)
0 30013
(19.6%)
never smoker
< 18.5 18.5 - 22.4 22.5 - 24.9 25.0 - 27.4 27.5 - 29.9 30.0 - 34.9 35.0 - 39.9
>= 40
1.53 (1.29 - 1.82) 0.99 (0.93 - 1.06) 1.0
1.01 (0.95 - 1.07) 1.09 (1.02 - 1.17) 1.27 (1.19 - 1.37) 1.78 (1.60 - 1.98) 2.26 (1.94 - 2.64)
age, ethnicity, multivitamin, aspirin use, DM, MI, cancer;
menopausal status, HRT;
healthy living factors Joshy G,
et al.(19)
Australia 2006-2008 5-7 y 115724 men
& 41754 women
Both 45+ 63 (11) 0 11127 Healthy men <18.5
18.5-20 20-22.5 22.5-25 25-27.5 27.5-30 30-35 35-50
1.85 (1.04– 3.27) 1.84 (1.20– 2.81) 1.49 (1.18– 1.88) 1
0.99 (0.80– 1.23) 1.08 (0.84– 1.38) 1.45 (1.12– 1.88) 2.61 (1.81– 3.78)
age as underlying time variable, region of residence, household income,
education ,alcohol intake, health insurance Healthy
women
<18.5 18.5-20 20-22.5 22.5-25
1.93 (1.35– 2.76) 1.74 (1.29– 2.35) 1.45 (1.16– 1.82) 1
52 25-27.5
27.5-30 30-35 35-50
1.01 (0.80– 1.28) 1.06 (0.81– 1.38) 1.21 (0.93– 1.57) 1.66 (1.18– 2.33) Peter RS,
et al.(15)
Austria 1985 18.6 y
(median)
53314men &
76590women
both 19+ 45.4 (men 44.1, women 46.4)
1 5855 men &
8860 women
Lowest mortality:
w: 20 y 23.3 54 y 24.9 69 y 26.2 m: 20 y 23.7 59 y 25.4 80 y 22.7 Chen Z, et
al.(20)
US 1993-1998 11.4 y (3.2) 161808 W 50-79 1 18320 50-59 <18.5
18.5-24.9 25.0-29.9 30.0-34.9 35.0-39.9
>=40
1.47 (0.98–2.19) 1.00
1.02 (0.91–1.14) 1.08 (0.95–1.23) 1.61 (1.39–1.87) 1.82 (1.55–2.15)
age, annual income, alcohol intake, physical activity, smoking status, diabetes mellitus, study arm
60-69 y <18.5 18.5-24.9 25.0-29.9 30.0-34.9 35.0-39.9
>=40
1.86 (1.51–2.29) 1.00
0.97 (0.92–1.04) 1.07 (0.99–1.15) 1.24 (1.13–1.35) 1.52 (1.36–1.69)
53 70-79 y <18.5
18.5-24.9 25.0-29.9 30.0-34.9 35.0-39.9
>=40
1.57 (1.31–1.88) 1.00
0.90 (0.85–0.95) 0.98 (0.92–1.06) 1.11 (1.00–1.23) 1.08 (0.92–1.26)
Twig G, et al.(12)
Israel 1967-2010 -2011 2298130 both 16-19 17.3
(0.4)
1 32127
(9.1%)
All-cause Body size percentile by CDC
<5th 5-24th 25-49th 50-74th 75-84th 85-94th
>=95th
1.05 (1.00-1.11)*
1.00
0.99 (0.96-1.02) 1.06 (1.03-1.10)*
1.20 (1.15-1.26)*
1.30 (1.24-1.36)*
1.68 (1.58-1.78)*
age, birth year, sex, SES, country of origin,
education, height;
All-cause <17.5 17.5-19.9 20.0-22.4 22.5-24.9 25.0-27.4 27.5-30.0 30.0-35.0
>=35.0
1.03 (0.97-1.09) 1.00
0.99 (0.97-1.02) 1.11 (1.08-1.15)*
1.25 (1.20-1.31)*
1.44 (1.35-1.53)*
1.74 (1.62-1.88)*
1.96 (1.65-2.32)*
54 Twig G, et
al.(11)
Israel NA M: 20.5 y
(10.1) W: 19.2 y (9.7)
1276535 men
& 882792 women
both 16-20 y
m:
17.36 (0.44) w:
17.35 (0.4)
1 Men Body size
percentile by CDC
<3rd 3rd-5th 5-10th 10-25th 25-50th 50-75th 75-85th 85-90th 90-97th
>=97th
1.072 (0.99–1.16) 1.155 (1.042–1.28) 1.002 (0.929–1.082) 1.022 (0.969–1.077) 1
1.054 (1.005–1.106) 1.195 (1.118–1.278) 1.187 (1.08–1.304) 1.416 (1.31–1.531) 1.899 (1.704–2.115)
birth year, age, education, SES, birth country, country of origin
Women <3rd 3rd-5th 5-10th 10-25th 25-50th 50-75th 75-85th 85-90th 90-97th
>=97th CDC
1.151 (0.921–1.452) 1.117 (0.829–1.505) 1.108 (0.914–1.342) 0.956 (0.842–1.085) 1
1.088 (0.984–1.203) 1.123 (0.982–1.283) 1.325 (1.113–1.579) 1.56 (1.331–1.829) 2.157 (1.549–3.005)
55
56 Supplement material A
検索式①
(patient[au] OR subject*[tiab] OR participants*[tiab] OR men[tiab] OR women[tiab] OR male[tiab]
OR female[tiab] OR girls[tiab] OR boys[tiab] OR boy[tiab] OR girl[tiab] OR teenager*[tiab] OR adolescent*[tiab] OR child[tiab] OR children[tiab] OR people[tiab] OR population[tiab] OR human*[tiab] OR individual*[tiab] OR humans[mesh])
AND
(healthy[tiab] OR normal[tiab] OR control[tiab] OR community-dwelling[tiab] OR "community dwelling"[tiab] OR free-living[tiab] OR "free living"[tiab])
NOT
(animals, laboratory[mesh] OR "intensive care"[tiab] OR "critically ill"[tiab] OR "critically illed"[tiab] OR patient[tiab] OR "end-stage"[tiab] OR "end stage"[tiab] OR patients[tiab] OR transplant*[tiab])
AND
(body mass index[mesh] OR underweight[tiab] OR overweight[tiab] OR obese[tiab] OR obesity[tiab] OR "body weight"[tiab] OR "body mass index"[tiab] OR "body-mass index"[tiab]) AND(mortality[mesh] OR death*[tiab] OR mortal*[tiab] OR fatal*[tiab])
AND (hazard[tiab] OR risk[tiab] OR rate[tiab] OR ratio[tiab]) AND
(Cohort studies[mesh] OR longitudinal[tiab] OR prospective[tiab] OR cross-sectional studies[mesh]
OR "cross-sectional"[tiab] OR "cross sectional"[tiab] OR "systematic review"[tiab] OR "systematic reviews"[tiab] OR "meta-analysis"[tiab] OR "follow-up"[tiab] OR "follow up"[tiab])
AND
("2013/01/01"[pdat]:"2017/10/05"[pdat]) AND
(English[lang] OR Japanese[lang])
検索式②
((body mass index[mesh] OR BMI) AND mortality AND mortality)
NOT ("critically ill" OR "chronically ill" OR "intensive care" OR transplant* OR disable* OR animal, laboratory[mesh] OR "end-stage" OR "end stage" OR surgery OR surgical OR hospitali*) AND "2013/01/01"[pdat]:"2017/10/05"[pdat]
AND humans[mesh]
AND (english[lang] OR Japanese[lang])
AND (cohort studies[mesh] OR "systematic review" OR meta-analysis OR "pooled analysis" OR
"pooled cohort" OR perspective study OR "pooled perspective")
検索式③
(body mass index[mesh] OR BMI) AND mortality AND Japan AND
"2013/01/01"[pdat]:"2017/10/05"[pdat]
57 Supplement Material B
テーマに合致した論文のうち、対象者の
BMIまたは
BMIの群分け を理由に除外した論文の一覧
Ref. No Author Country Reason of exclusion
1 Hamer M, et al. UK high BMI population
2 Bowman K, et al. UK high BMI population
3 Hamer M, et al. UK inapplicable BMI category
4 Cheng FW, et al. US inapplicable BMI category
5 Dhana K, et al. Netherlands inapplicable BMI category 6 Dhana K, et al. Netherlands inapplicable BMI category
7 Singh PN, et al. US high BMI population
8 Greenberg JA. US high BMI population
9 Dahl AK, et al. Sweden inapplicable BMI category
10 Greenberg JA. US high BMI population
11 Padwal R, et al. Canada inapplicable BMI category 12 Mirbolouk M, et al. China high BMI population
13 Liu Y, et al. Finland high BMI population
14 Mehta NK, et al. UK inapplicable BMI category
15 Long G, et al. Spain inapplicable BMI category
16 Ponce-Garcia I, et al. UK inapplicable BMI category
17 Ganna A, et al. Iran inapplicable BMI category
18 Stenholm S, et al. Finland inapplicable BMI category
1) Hamer M, Johnson W, Bell JA. (2017) Improving risk estimates for metabolically healthy obesity and mortality using a refined healthy reference group. Eur J Endocrinol 177(2):169-174.
2) Bowman K, Atkins JL, Delgado J, et al. (2017) Central adiposity and the overweight risk paradox in aging: follow-up of 130,473 UK Biobank participants. Am J Clin Nutr. 106(1):130-135.
3) Hamer M, O'Donovan G. Sarcopenic obesity, weight loss, and mortality: the English Longitudinal Study of Ageing. Am J Clin Nutr. 2017 Jul;106(1):125-129. doi: 10.3945/ajcn.117.152488. Epub 2017 May 24.
4) Cheng FW, Gao X, Mitchell DC, et al. (2016) Metabolic Health Status and the Obesity Paradox in Older Adults. J Nutr Gerontol Geriatr. 35(3):161-76.
5) Dhana K, Nano J, Ligthart S, et al. (2016) Obesity and Life Expectancy with and without Diabetes in Adults Aged 55 Years and Older in the Netherlands: A Prospective Cohort Study. PLoS Med. 13(7):e1002086.
6) Dhana K, Berghout MA, Peeters A, et al. (2016) Obesity in older adults and life expectancy with and without cardiovascular disease. Int J Obes (Lond) 40(10):1535-1540.
7) Singh PN, Clark RW, Herring P, et al. (2014) Obesity and life expectancy among long-lived Black adults. J Gerontol A Biol Sci Med Sci. 69(1):63-72.
58 8) Greenberg JA. (2013) The obesity paradox in the US population. Am J Clin Nutr. 97(6):1195-200.
9) Dahl AK, Fauth EB, Ernsth-Bravell M, et al. (2013) Body mass index, change in body mass index, and survival in old and very old persons. J Am Geriatr Soc. 61(4):512-8.
10) Greenberg JA. (2013) Obesity and early mortality in the United States. Obesity (Silver Spring).
21(2):405-12.
11) Padwal R, Leslie WD, Lix LM, et al. (2016) Relationship Among Body Fat Percentage, Body Mass Index, and All-Cause Mortality: A Cohort Study. Ann Intern Med. 164(8):532-41.
12) Mirbolouk M, Asgari S, Sheikholeslami F, et al. (2014) The ideal cardiovascular health metrics associated inversely with mortality from all causes and from cardiovascular diseases among adults in a Northern Chinese industrial city. PLoS One. 9(2):e89161.
13) Liu Y, Chi HJ, Cui LF, et al. (2011) Secular declines in the association between obesity and mortality in the United States. Popul Dev Rev. 37(3):435-51.
14) Mehta NK, Chang VW. (2015) Mortality benefits of population-wide adherence to national physical activity guidelines: a prospective cohort study. Eur J Epidemiol. 30(1):71-9.
15) Long G, Watkinson C, Brage S, et al. (2015) Prognostic value of obesity on both overall mortality and cardiovascular disease in the general population. PLoS One. 10(5):e0127369.
16) Ponce-Garcia I, Simarro-Rueda M, Carbayo-Herencia JA, et al. (2015) Group of Vascular Diseases from Albacete. 5 year mortality predictors in 498,103 UK Biobank participants: a prospective population-based study. Lancet 386:533-40.
17) Ganna A, Ingelsson E. (2015) Different obesity phenotypes, and incident cardiovascular disease and mortality events in elderly Iranians: Tehran lipid and glucose study. Geriatr Gerontol Int.
15(4):449-56.
18) Stenholm S, Mehta NK, Elo IT, et al. (2014) Obesity and muscle strength as long-term determinants of all-cause mortality--a 33-year follow-up of the Mini-Finland Health Examination Survey. Int J Obes (Lond). 38(8):1126-32.
59 Supplement Material C
60 Supplement Material C (continued)
61 References:
1) Boutin E, Natella PA, Schott AM, et al. (2017) Interrelations between body mass index, frailty, and clinical adverse events in older community-dwelling women: The EPIDOS cohort study. Clin Nutr. pii: S0261-5614(17)30264-9.
2) Ng TP, Jin A, Chow KY, et al. (2017) Age-dependent relationships between body mass index and mortality: Singapore longitudinal ageing study. PLoS One. 12(7):e0180818.
3) Klatsky AL, Zhang J, Udaltsova N, et al. (2017) Body Mass Index and Mortality in a Very Large Cohort: Is It Really Healthier to Be Overweight? Perm J. 21: 16-142.
4) Kee CC, Sumarni MG, Lim KH, et al. (2017) Association of BMI with risk of CVD mortality and all-cause mortality. Public Health Nutr. 20(7):1226-1234.
5) O'Doherty MG, Jørgensen T, Borglykke A, et al. (2017) Repeated measures of body mass index and C-reactive protein in relation to all-cause mortality and cardiovascular disease: results from the consortium on health and ageing network of cohorts in Europe and the United States (CHANCES).
Eur J Epidemiol. 29(12):887-97.
6) Lee JY, Kim HC, Kim C, et al. (2016) Underweight and mortality. Public Health Nutr.
19(10):1751-6.
7) Cao B. (2015) Estimating the Effects of Obesity and Weight Change on Mortality Using a Dynamic Causal Model. PLoS One. 10(6):e0129946.
8) Hirko KA, Kantor ED, Cohen SS, et al. (2015) Body mass index in young adulthood, obesity trajectory, and premature mortality. Am J Epidemiol. 182(5):441-50.
9) Hong S, Yi SW, Sull JW, et al. (2015) Body mass index and mortality among Korean elderly in rural communities: Kangwha Cohort Study. PLoS One. 10(2):e0117731.
10) Yiengprugsawan V, Banwell C, Zhao J, et al. (2014) Relationship between body mass index reference and all-cause mortality: evidence from a large cohort of Thai adults. J Obes. 2014:708606.
11) Chung WS, Ho FM, Cheng NC, et al. (2014) BMI and all-cause mortality among middle-aged and older adults in Taiwan: a population-based cohort study. Public Health Nutr. 18(10):1839-46.
12) Zaslavsky O, Rillamas-Sun E, LaCroix AZ, et al. (2016) Association Between Anthropometric Measures and Long-Term Survival in Frail Older Women: Observations from the Women's Health Initiative Study. J Am Geriatr Soc. 64(2):277-84.
13) Rolland Y, Gallini A, Cristini C, et al. (2014) Body-composition predictors of mortality in women aged ≥ 75 y: data from a large population-based cohort study with a 17-y follow-up. Am J Clin Nutr. 100(5):1352-60.
14) Patel AV, Hildebrand JS, Gapstur SM. (2014) Body mass index and all-cause mortality in a large prospective cohort of white and black U.S. Adults. PLoS One. 9(10):e109153.
15) Suemoto CK, Lebrao ML, Duarte YA, et al. (2015) Effects of body mass index, abdominal obesity, and type 2 diabetes on mortality in community-dwelling elderly in Sao Paulo, Brazil:
analysis of prospective data from the SABE study. J Gerontol A Biol Sci Med Sci. 70(4):503-10.
16) Lee Y, Kim J, Han ES, et al. (2014) Frailty and body mass index as predictors of 3-year mortality in older adults living in the community. Gerontology. 60(6):475-82.
17) Flegal KM, Kit BK, Graubard BI. (2014) Body mass index categories in observational studies of
62 weight and risk of death. Am J Epidemiol. 180(3):288-96.
18) Shah RV, Abbasi SA, Yamal JM, et al. (2014) Impaired fasting glucose and body mass index as determinants of mortality in ALLHAT: is the obesity paradox real? J Clin Hypertens. 16(6):451-8.
19) Roh L, Braun J, Chiolero A, et al. (2014). Mortality risk associated with underweight: a census- linked cohort of 31,578 individuals with up to 32 years of follow-up. BMC Public Health. 14:371.
20) Stokes A. (2014) Using maximum weight to redefine body mass index categories in studies of the mortality risks of obesity. Popul Health Metr. 12(1):6.
21) Buys DR, Roth DL, Ritchie CS, et al. (2014) Nutritional risk and body mass index predict hospitalization, nursing home admissions, and mortality in community-dwelling older adults: results from the UAB Study of Aging with 8.5 years of follow-up. J Gerontol A Biol Sci Med Sci.
69(9):1146-53.
22) Borrell LN, Samuel L. (2014) Body mass index categories and mortality risk in US adults: the effect of overweight and obesity on advancing death. Am J Public Health. 104(3):512-9.
23) Lajous M, Bijon A, Fagherazzi G, et al. (2014) Body mass index, diabetes, and mortality in French women: explaining away a "paradox". Epidemiology. 25(1):10-4.
24) Zheng H, Tumin D, Qian Z. (2013) Obesity and mortality risk: new findings from body mass index trajectories. Am J Epidemiol. 178(11):1591-9.
25) Jackson CL, Yeh HC, Szklo M, et al. (2014) Body-Mass Index and All-Cause Mortality in US Adults With and Without Diabetes. J Gen Intern Med. 29(1):25-33.
26) Flegal KM, Kit BK, Orpana H, et al. (2013) Association of all-cause mortality with overweight and obesity using standard body mass index categories: a systematic review and meta-analysis.
JAMA. 309(1):71-82.
27) Murayama H, Liang J, Bennett JM, et al. (2015) Trajectories of Body Mass Index and Their Associations With Mortality Among Older Japanese: Do They Differ From Those of Western Populations? Am J Epidemiol. 182(7):597-605.
28) Nakazawa A, Nakamura K, Kitamura K, et al. (2013) Association between body mass index and mortality among institutionalized elderly adults in Japan. Environ Health Prev Med. 18(6):502-6.
29) Sun H, Ren X, Chen Z, et al. (2016) Association between body mass index and mortality in a prospective cohort of Chinese adults. Medicine. 95(32):e4327.
30) Nakade M, Takagi D, Suzuki K, et al. (2015) Influence of socioeconomic status on the
association between body mass index and cause-specific mortality among older Japanese adults: The AGES Cohort Study. Prev Med. 77:112-8.
31) Takata Y, Ansai T, Soh I, et al. (2013) Body mass index and disease-specific mortality in an 80- year-old population at the 12-year follow-up. Arch Gerontol Geriatr. 57(1):46-53.
32) Howell CR, Fontaine K, Ejima K, et al. (2017) Maximum Lifetime Body Mass Index and Mortality in Mexican American Adults: the National Health and Nutrition Examination Survey III (1988-1994) and NHANES 1999-2010. Prev Chronic Dis.14:E67.
33) Afzal S, Tybjærg-Hansen A, Jensen GB, et al. (2016) Change in Body Mass Index Associated With Lowest Mortality in Denmark, 1976-2013. JAMA. 315(18):1989-96.
34) Burman M, Säätelä S, Carlsson M, et al. (2015) Body mass index, Mini Nutritional Assessment,
63 and their association with five-year mortality in very old people. J Nutr Health Aging. 19(4):461-7.
35) Xiao Q, Hsing AW, Park Y, et al. (2014) Body mass index and mortality among blacks and whites adults in the Prostate, Lung, Colorectal, and Ovarian (PLCO) cancer screening trial. Obesity 22(1):260-8.
36) Ghaem Maralani H, Tai BC, Wong TY, et al. (2014) The prognostic role of body mass index on mortality amongst the middle-aged and elderly: a competing risk analysis. Diabetes Res Clin Pract.
103(1):42-50.
37) Chen LY, Peng LN, Liu LK, et al. (2013) Body mass index, health status, and mortality of older Taiwanese men: overweight good, underweight bad, obesity neutral. J Am Geriatr Soc. 61(12):2233- 4.
38) Hotchkiss JW, Davies CA, Leyland AH. (2013) Adiposity has differing associations with incident coronary heart disease and mortality in the Scottish population: cross-sectional surveys with follow-up. Int J Obes. 37(5):732-9.
39) Choi KM, Cho HJ, Choi HY, et al. (2013) Higher mortality in metabolically obese normal- weight people than in metabolically healthy obese subjects in elderly Koreans. Clin Endocrinol 79(3):364-70.
40) Schmidt M, Johannesdottir SA, Lemeshow S, et al. (2013) Obesity in young men, and individual and combined risks of type 2 diabetes, cardiovascular morbidity and death before 55 years of age: a Danish 33-year follow-up study. BMJ Open. 3(4). pii: e002698.
41) Yano Y, Kario K, Ishikawa S, et al. (2013) Associations between diabetes, leanness, and the risk of death in the Japanese general population: the Jichi Medical School Cohort Study. Diabetes Care.
36(5):1186-92.
42) Masters RK, Powers DA, Link BG. (2013) Obesity and US mortality risk over the adult life course. Am J Epidemiol. 177(5):431-42.
43) Hinnouho GM, Czernichow S, Dugravot A, et al. (2013) Metabolically healthy obesity and risk of mortality: does the definition of metabolic health matter? Diabetes Care 36:2294-300.
44) McTigue KM, Chang YF, Eaton C, et al. (2014) Severe obesity, heart disease, and death among white, African American, and Hispanic postmenopausal women. Obesity 22(3):801-10.
45) Clark DO, Gao S, Lane KA, et al. (2014) Obesity and 10-year mortality in very old African Americans and Yoruba-Nigerians: exploring the obesity paradox. J Gerontol A Biol Sci Med Sci.
69(9):1162-9.
46) Wu CY, Chou YC, Huang N,et al. (2014) Association of body mass index with all-cause and cardiovascular disease mortality in the elderly. PLoS One. 9(7):e102589.
47) Kokkinos P, Faselis C, Myers J, et al. (2014) Cardiorespiratory fitness and the paradoxical BMI- mortality risk association in male veterans. Mayo Clin Proc. 89(6):754-62.
48) Kumar A, Karmarkar AM, Tan A, et al. (2015) The effect of obesity on incidence of disability and mortality in Mexicans aged 50 years and older. Salud Publica Mex. 57 Suppl 1:S31-8.
49) Qizilbash N, Gregson J, Johnson ME, et al. (2015) BMI and risk of dementia in two million people over two decades: a retrospective cohort study. Lancet Diabetes Endocrinol. 3(6):431-436.
64 50) Lu JL, Molnar MZ, Naseer A, et al. (2015) Association of age and BMI with kidney function and mortality: a cohort study. Lancet Diabetes Endocrinol. 3(9):704-14.
51) Dankner R, Shanik M, Roth J, et al. (2015) Sex and ethnic-origin specific BMI cut points improve prediction of 40-year mortality: the Israel GOH study. Diabetes Metab Res Rev. 31(5):530- 6.
52) Graf CE, Karsegard VL, Spoerri A, et al. (2015) Body composition and all-cause mortality in subjects older than 65 y. Am J Clin Nutr 101:760-7