ラット心筋梗塞後不全心でのタンパク質品質管理機構の変化に及ぼす
ヒストン脱アセチル化酵素 6 阻害の効果に関する研究
Studies on the effect of histone deacetylase 6 inhibition on changes in the protein quality control system in the failing heart following myocardial infarction in rats
2019 年
ii 2‐2 結果 ... 28 2‐2‐1 左冠状動脈結紮後の左心室 HDAC6 含量および脱アセチル化酵素活性の 変化 ... 28 2‐2‐2 左冠状動脈結紮後の左心室 HSP90 および HSF1 含量の変化 ... 29 2‐2‐3 左冠状動脈結紮後の左心室 HSP90 のアセチル化レベルの変化 ... 30 2‐2‐4 左冠状動脈結紮後の左心室 HSF1 の細胞内局在の変化 ... 31 2‐3 考察 ... 32 小括 ... 34 第 三 章 心 筋 梗 塞 後 不 全 心 で の HSP 発 現 低 下 へ の HDAC 阻 害 薬 suberoylanilide hydroxamic acid 投与の効果 ... 35 3‐1 実験材料・方法 ... 36 3‐1‐1 実験動物 ... 36 3‐1‐2 ラット心筋梗塞モデルの作製 ... 36 3‐1‐3 被験薬の投与計画および実験群 ... 36 3‐1‐4 心エコー法による心機能の測定 ... 36 3‐1‐5 心臓および肺の組織重量の測定 ... 36 3‐1‐6 Western immunoblotting 用試料溶液の調製 ... 36 3‐1‐7 Western immunoblotting ... 37 3‐1‐8 免疫沈降法 ... 37 3‐1‐9 免疫染色 ... 37 3‐1‐10 統計方法 ... 37 3‐2 結果 ... 38 3‐2‐1 左冠状動脈結紮後の左心室 HDAC6 含量および脱アセチル化酵素活性の 変化に及ぼす suberoylanilide hydroxamic acid 投与の効果 ... 38
3‐ 2‐2 左 冠 状 動脈 結 紮 後の 左 心 室 HSP90 およ び HSF1 含 量 の 変 化に 及 ぼ す suberoylanilide hydroxamic acid 投与の効果 ... 39
3‐2‐3 左冠状動脈結紮後の左心室 HSP90 のアセチル化レベルの変化に及ぼす suberoylanilide hydroxamic acid 投与の効果 ... 40
3 ‐ 2 ‐ 4 左 冠 状 動 脈 結 紮 後 の 左 心 室 HSF1 の 細 胞 内 局 在 の 変 化 に 及 ぼ す suberoylanilide hydroxamic acid 投与の効果 ... 41
3‐2‐5 左冠状動脈結紮後の左心室 HSP72,HSPB1 および HSPB5 含量の変化 に及ぼす suberoylanilide hydroxamic acid 投与の効果 ... 42
3‐2‐6 左冠状動脈結紮後の左心室ユビキチン化タンパク質含量の変化に及ぼす suberoylanilide hydroxamic acid 投与の効果 ... 44
iv
略語表
本文中では以下の略語を用いる.
AMC 7-amino-4-methylcoumarin
ANOVA analysis of variance ATP adenosine-5'-triphosphate A wave atrial contraction wave bpm beats per minute BW body weight
CAL coronary artery ligation
CMC-Na sodium carboxymethyl cellulose CO cardiac output
CO index cardiac output index
DAPI 4’,6-diamidino-2-phenylindole dihydrochloride DTT dithiothreitol
E wave early diastolic filling wave
EDTA ethylenediamine-N,N,N’,N’-tetraacetic acid EDV end-diastolic volume
EF ejection fraction
EGTA ethylenglycol-bis(2-aminoethyl ether)-N,N,N’,N’-tetraacetic acid ESV end-systolic volume
ET ejection time
FITC fluorescein isothiocyanate FS fractional shortening
GAPDH glyceraldehyde-3-phosphate dehydrogenase HAT histone acetyltransferase
HDAC histone deacetylase
HEPES 2-[4-(2-hydroxyethyl)-1-piperazinyl] ethanesulfonic acid HR heart rate
HRP horseradish peroxidase
HSF1 heat-shock transcription factor 1 HSP heat-shock protein
HW heart weight
HW/BW heart weight/body weight ICT isovolumic contraction time IP immunoprecipitation
i.p. intraperitoneally
v
KHB Krebs-Henseleit bicarbonate
LC3 microtubule-associated protein 1 light chain 3 LungW lung weight
LungW/BW lung weight/body weight LV left ventricle
LVIDd left ventricular internal diameter at end-diastole LVIDs left ventricular internal diameter at end-systole LVW left ventricular weight
LVW/BW left ventricular weight/body weight PA pulmonary artery
PAAT pulmonary artery flow acceleration time PAD pulmonary artery diameter
PAGE poly-acrylamide gel electrophoresis PBS phosphate-buffered saline
PFA paraformaldehyde
PI3K phosphoinositide 3-kinase PQC protein quality control PSMB5 proteasome 5 subunit PVDF polyvinilydene difluoride RV right ventricle
RVW right ventricular weight
RVW/BW right ventricular weight/body weight SAHA suberoylanilide hydroxamic acid SDS sodium dodecyl sulfate
SEM standard error of the mean Sep septum
SepW septal weight
SepW/BW septal weight/body weight SQSTM1 sequestosome 1
Suc-LLVY-AMC succinyl-L-leucyl-L-leucyl-L-valyl-L-tyrosine 4-methylcoumaryl-7-amide
SV stroke volume SV index stroke volume index
TBST Tris-buffered saline with Tween 20
Tris 2-amino-2-hydroxymethyl-1,3-propanediol viable LV viable left ventricle
1 緒言 慢性心不全は,何らかの原因により心ポンプ機能が損なわれた結果,全身の組織が 要求する血液量を心臓が供給することができなくなった状態と定義され,多様な心血 管疾患の終末的な病態とみなされている. 我が国では,生活習慣の欧米化や急速な高 齢化により,心不全の患者数が増加の一途を辿っており 1),2017 年の厚生労働省の死 因に関する統計では,我が国の心疾患に起因する死亡者数 204,837 人のうち,約 40% の 80,817 人が心不全で死亡している.心不全の基礎疾患には,心筋梗塞などの虚血性 心疾患,拡張型心筋症および高血圧症 などがある.その中で,冠血流の途絶による心 筋の壊死,すなわち心筋梗塞を基礎疾患として発症する心筋梗塞後心不全 2) の患者数 が最多となっている.過去の大規模臨床試験から,アドレナリン 受容体遮断薬 3–5), アンギオテンシン変換酵素阻害薬 6–9) およびアンギオテンシン II 受容体拮抗薬 10–12) などの薬物療法の有用性が示されたものの,現在でも心不全の診断後 1 年以内の死亡 率は約 20% に達する 13–15).そのため,心筋梗塞後心不全に対する新たな治療薬の開 発が期待されている. 心臓は,心筋梗塞などの基礎疾患により心筋細胞の一部が失われると,組織学的形 態変化およびポンプ機能の代償機序を介して,循環動態を維持する 16,17).例えば,心 筋梗塞後に容量負荷や圧負荷が持続すると,心筋梗塞を免れた生存心筋は,肥大化お よび線維化を介して心機能を維持させる 18–21).しかしながら,心臓への力学的および 代謝的な負荷が長期間持続すると,その代償機構の破綻に伴 い心機能は低下し,心不 全に陥る. 生体内で様々な役割を担っているタンパク質が正しく 機能するためには,適切な高 次構造をとっている必要がある.細胞へのストレス曝露は,細胞内に 正常な立体構造 を保つことができなくなった 変性タンパク質を生成させ,その蓄積が細胞毒性を惹起 する 22).アルツハイマー型認知症,ハンチントン病およびパーキンソン病 など神経変 性疾患の多くは,変性タンパク質凝集体の蓄積が原因で発症することが示されている 23).神経細胞と同様に非増殖性の細胞である心筋細胞は,個体の寿命とほぼ同等の期 間,分裂することなく,その機能を保持しなければならない 24).さらに心臓は,継続 的に機械的および神経内分泌的ストレスに曝され続けてい るため 25),心機能を維持す るには,その細胞内のタンパク質の品質を厳格に管理する必要が ある 26).細胞は,異 常なタンパク質の蓄積を回避するために,細胞内に生じた変性タンパク質を修復ある いは除去する分子機構を備えている.この機構は,タンパク質品質管理機構( protein quality control; PQC)と称され,分子シャペロンである熱ショックタンパク質( heat-shock protein; HSP)によるタンパク質修復,ユビキチン -プロテアソーム系によるタンパク質 分解およびオートファジー-リソソーム系によるタンパク質分解の 3 つの経路に大別
される 27,28).多くの神経変性疾患と同様に,これらの経路の異常が心筋梗塞後の心臓
2
タンパク質のアセチル化は,ヒストンおよび多くの非ヒストンタンパク質の機能を 制御する重要な翻訳後修飾のひとつである 29,30).ヒストン脱アセチル化酵素(histone
5
1‐1 実験材料・方法 1‐1‐1 実験動物
本実験では,10 週齢,体重 220-240 g の Wistar 系雄性ラット(Japan SLC, Inc., Hamamatsu,Japan)を用いた.飼料と水を自由に摂取させ,恒温(23 ± 1°C),恒湿(55 ± 5%),定時照明(12 時間明所 7:00-19:00,12 時間暗所 19:00-7:00)の人工環境下で 飼育した.動物の飼育,実験操作は,動物の愛護および管理に関する法律(昭和 48 年 法律第 105 号)および実験動物の飼養および保管等に関する基準(昭和 55 年総理府 告示第 6 号)に従った.本研究は東京薬科大学動物実験委員会にて実験計画の審査お よび承認を受け,実施された. 1‐1‐2 ラット心筋梗塞モデルの作製 ラ ッ ト 心 筋 梗 塞 モ デ ル を Sanbe ら の 方 法 58) に 従 っ て 作 製 し た . ラ ッ ト を
isoflurane(導入 5%,維持 2%,Pfizer Inc.,New York,NY,USA)で麻酔装置(SN-487-0T, Shinano,Tokyo,Japan)を用いて麻酔し,背位に固定した.開胸時の呼吸を確保する ために口腔より気管にカニューレを挿管し,人工呼吸器( SN-480-7,Shinano)を使用 して,2.2-2.4 mL/stroke × 70 rpm の条件で陽圧人工呼吸を行った.胸骨の左縁に沿っ て皮膚を切開し,第四肋骨を切除した.開胸後,心嚢膜を取り除き ,心臓を体外に露 出させ,左冠状動脈の起始部より心尖部に向かって 2 mm の位置を 5 号ポリエステル 縫合糸(TI-CRON™,COVIDIEN,Mansfield,MA,USA)を用いて結紮した(左冠状 動脈結紮: coronary artery ligation; CAL).結紮後,心臓を胸腔内に戻し,筋層および皮 膚 を 縫 合 し た . 術 後 の 感 染 症 予 防 の た め , 縫 合 部 を ポ ビ ド ン ヨ ー ド 液 ( Meiji Seika Pharma Co., Ltd.,Tokyo,Japan)で消毒した.また,偽手術( Sham)群は同様の操作 で開胸し,心臓を露出させるのみで結紮は行わなかった.
1‐1‐3 心エコー法による心機能の測定 1‐1‐3‐1 心エコー診断装置
非侵襲的に心機能を観察するため,心エコー法を用いた.心エコー診断装置には, ARIETTA 70(Hitachi, Ltd.,Tokyo,Japan)を使用した.探触子には 7~13 MHz のリ ニア型(L64,Hitachi, Ltd.)および 8 MHz のセクタ型(S42,Hitachi, Ltd.)を用いた.
CAL ラ ット の心 機 能 測定 は Kawahara ら の 方法 59) に 従っ て 行っ た. Pentobarbital
sodium(30 mg/kg i.p.,Tokyo Chemical Industry Co., Ltd.,Tokyo,Japan)で麻酔し,背 位に固定した.胸部を剃毛し,37°C に加温したエコージェル(SCAN® ULTRASOUND
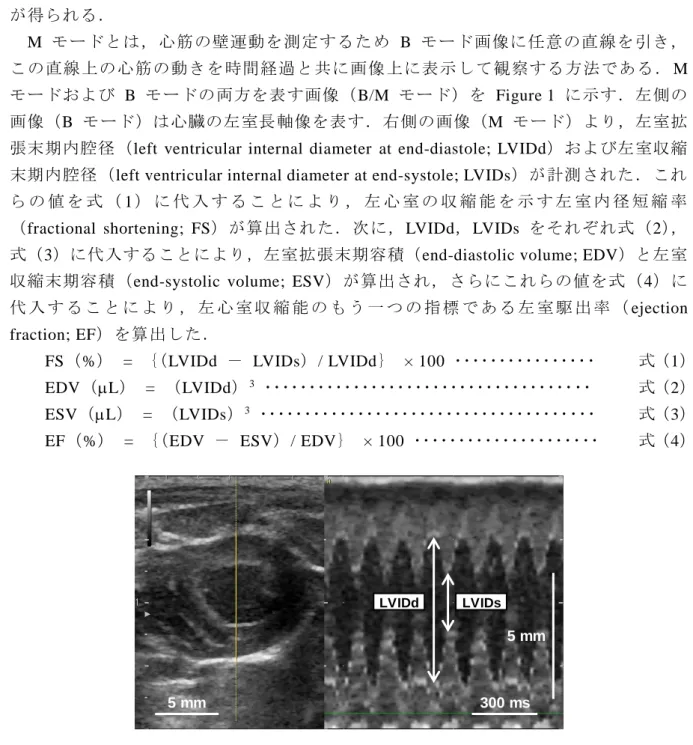
6 1‐1‐3‐2 B および M モードを用いた心機能の測定 B モードは,心臓の断面を表示する方法である.胸骨左縁部に正中線と平行になる ように探触子を置き,その側面の頭側をラットの右肩方向(正中線頭側を 0 度とした とき反時計方向に約 30 度)に回転させることで,胸骨左縁の左室長軸像(縦切りの 断面像)が得られる.次に,乳頭筋が左室長軸像の中心となるように探触子を移動さ せた後,それを 90 度回転させることで,胸骨左縁での左室短軸像(横切りの断面像) が得られる. M モードとは,心筋の壁運動を測定するため B モード画像に任意の直線を引き, この直線上の心筋の動きを時間経過と共に画像上に表示して観察する方法である. M モードおよび B モードの両方を表す画像(B/M モード)を Figure 1 に示す.左側の 画像(B モード)は心臓の左室長軸像を表す.右側の画像(M モード)より,左室拡 張末期内腔径(left ventricular internal diameter at end-diastole; LVIDd)および左室収縮 末期内腔径(left ventricular internal diameter at end-systole; LVIDs)が計測された.これ ら の 値 を 式 ( 1 ) に 代 入 す る こ と に よ り , 左 心 室 の 収 縮 能 を 示 す 左 室 内 径 短 縮 率 (fractional shortening; FS)が算出された.次に,LVIDd,LVIDs をそれぞれ式(2), 式(3)に代入することにより,左室拡張末期容積(end-diastolic volume; EDV)と左室 収縮末期容積(end-systolic volume; ESV)が算出され,さらにこれらの値を式(4)に 代 入 す る こ と に よ り , 左 心 室 収 縮 能 の も う 一 つ の 指 標 で あ る 左 室 駆 出 率 ( ejection fraction; EF)を算出した.
FS(%) = {(LVIDd - LVIDs)/ LVIDd} × 100 ・・・・・・・・・・・・・・・・ 式(1) EDV(L) = (LVIDd)3 ・・・・・・・・・・・・・・・・・・・・・・・・・・・・・・・・・・・・・ 式(2)
ESV(L) = (LVIDs)3 ・・・・・・・・・・・・・・・・・・・・・・・・・・・・・・・・・・・・・・ 式(3)
EF(%) = {(EDV - ESV)/ EDV} × 100 ・・・・・・・・・・・・・・・・・・・・・ 式(4)
Figure 1 Representative B/M-mode echocardiograms of naïve rat. Two dimensional parasternal long-axis view from the naïve rat heart.
Abbreviations: LVIDd, left ventricular internal diameter at end-diastole; LVIDs, left ventricular internal diameter at end-systole.
5 mm
300 ms 5 mm
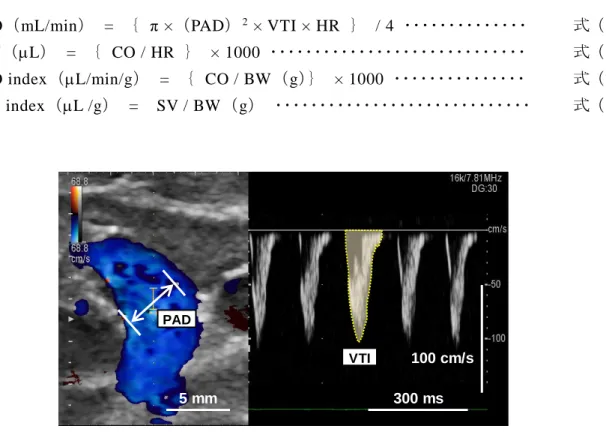
7 1‐1‐3‐3 D モードを用いた心機能の測定 D モードとは, Doppler 効果を利用して,心臓内や血管内の血流をリアルタイムに 表示する方法で,血液の流速あるいは心拍出量が算出される.まず, color Doppler 法 (断層画面内にどのような流速の血流があるかを表示する方法)により血流を表示さ せることで目標部位を決定し,その部位で pulse Doppler 法(目標部位の血流速度を測 定する方法)により血流速波形を表示させた.B モードと D モードの両方を表す画 像(B/D モード)を Figure 2 に示す.左側の画像は color Doppler 法を用いた B モ ード左室長軸像,右側の画像は pulse Doppler 法での血流速波形を表す.血流のモニタ ーは肺動脈流出経路(pulmonary artery; PA)で血流をモニターし,心拍出量を測定した. この B/D モードの画像より肺動脈径(pulmonary artery diameter; PAD),速度時間積分 値(velocity time integral; VTI)および心拍数(heart rate; HR)を測定した.式(5)か らこれらの値を用いて心拍出量(cardiac output; CO)を算出した.式(6)からこれら の値を用いて一回拍出量(stroke volume; SV)を算出した.さらに,CO を体重(body weight; BW)で除することにより心拍出量/体重比(cardiac output index; CO index)を (式(7)),同様に,SV と BW から一回拍出量/体重比(stroke volume index; SV index) を算出した(式(8)).
CO(mL/min) = { π ×(PAD)2 × VTI × HR } / 4 ・・・・・・・・・・・・・・ 式(5)
SV(L) = { CO / HR } × 1000 ・・・・・・・・・・・・・・・・・・・・・・・・・・・・・ 式(6) CO index(L/min/g) = { CO / BW(g)} × 1000 ・・・・・・・・・・・・・・・ 式(7) SV index(L /g) = SV / BW(g) ・・・・・・・・・・・・・・・・・・・・・・・・・・・・・ 式(8)
Figure 2 Representative B/D-mode echocardiograms of naïve rat.
Pulmonary flow velocity was measured with p ulsed wave Doppler on the parasternal long-axis view. Abbreviations: PAD, pulmonary artery diameter; VTI, velocity time integral .
PAD
VTI
300 ms 5 mm
8
1‐1‐3‐4 肺動脈血流加速時間の測定
D モード図法を用いて肺動脈の血流をモニターした.右心室収縮による肺動脈血流 速度の発生から肺動脈血流速度が peak になるまでの時間を測定し,それを肺動脈血 流加速時間(pulmonary artery flow acceleration time; PAAT)とした.
1‐1‐3‐5 総合的心機能指標の測定
総合的心機能指標(Tei index)は収縮能と拡張能を統合させた心機能指標である 60–62).
この値の上昇は,心機能の低下を示す.左心室の Tei index は以下の方法により測定し た.まず心尖部四腔断面像を描出し,僧帽弁の弁尖部で pulse Doppler 法により僧帽弁 流入速波形を得た.心房収縮波(atrial contraction wave; A wave)の終了から次の心拍 の拡張早期血流波(early diastolic filling wave; E wave)の開始までの時間(a 時間)を 計測した.次に心尖部長軸断面像を描出し,大動脈弁の弁輪レベルで pulse Doppler 法 により大動脈駆出血流速波形を得た.この血流の持続時間,すなわち駆出時間(ejection time; ET)( b 時 間 ) を 計 測 し た . Figure 3 に 示 す よ う に a 時 間 は , 等 容 収 縮 時 間 (isovolumic contraction time; ICT),等容弛緩時間(isovolumic relaxation time; IRT)お よび ET の和であるので,a-b は ICT と IRT の和となり,さらに (a-b)/ b = ICT/ET + IRT/ET となる.呼吸性変動による影響を減らすために a 時間・ b 時間とも 連続する 4 拍の平均値を用いてそれぞれを式(9)に代入し,Tei index を算出した. また左室拡張能の指標として E/A 比(E/A ratio)を算出した.
一方,右心室の Tei index は胸骨左縁大動脈弁レベル短軸断面像を描出し,三尖弁の 弁尖部で pulse Doppler 法により三尖弁流入速波形を得て同様に a 時間を測定した. 次に胸骨左縁長軸断面像を描出し,肺動脈弁の弁輪レベルで pulse Doppler 法により肺 動脈血流速波形を得て同様に b 時間を測定し,Tei index を算出した.
Tei index = (ICT + IRT)/ ET = (a-b)/ b ・・・・・・・・・・・・・・・・・・・・ 式(9)
Figure 3 Diagrams for measurement of LV Tei index.
The LV Tei index was assessed from Doppler recordings of LV inflow and outflow. From mitral inflow in the apical four-chamber view, the time interval from cessation to onset of mitral inflow was measured ( a-interval).
a-interval was equal to the sum of ICT, ET and IRT. ET ( b-interval) was measured from the LV outflow velocity
curve recorded in the long-axis view. The LV Tei index was calculated as (a-b)/b, namely (ICT+IRT)/ET. Abbreviations: ET, ejection time; ICT, isovolumic contraction time; IRT, isovolumic relaxation time; LV, left ventricular; E, early diastolic filling wave; A, atrial contraction wave .
9
1‐1‐4 心臓および肺の組織重量の測定
心肥大および肺うっ血の有無を検討するために,心臓および肺を摘出し,氷冷 した 生理食塩水中で血液を洗浄した後,その重量(湿重量)を測定した.CAL ラットから 摘出した心臓は梗塞巣(scar),梗塞周辺部(border),梗塞周辺部の左心室自由壁(viable left ventricle; viable LV),中隔壁(septum; Sep)および右心室自由壁(right ventricle; RV) の 5 部位に,Sham ラットから摘出した心臓は左心室自由壁(left ventricle; LV),Sep, RV の 3 部位に分割し,それぞれの重量を測定した.肺重量は視認できる肺動脈を可 能な限り除去した重量を測定した.
1‐1‐5 Western immunoblotting 用試料溶液の調製
組織重量測定後,CAL ラットでは梗塞周辺部の viable LV を,一方 Sham ラットで は LV を各 7 分間細切した後,組織重量の 5 倍量の homogenization buffer(20 mM 2-[4-(2-hydroxyethyl)-1-piperazinyl] ethanesulfonic acid(HEPES),250 mM sucrose,1 mM dithiothreitol(DTT),1 mM ethylenglycol-bis(2-aminoethyl ether)-N,N,N’,N’-tetraacetic acid ( EGTA ), protease inhibitor cocktail ( cOmplete™ Mini EDTA-free; Roche , Basel , Switzerland),phosphatase inhibitor cocktail(PhosSTOP™; Roche),pH 7.4,4°C)を加え, ポッターホモジナイザー(Digital homogenizer; AS ONE,Osaka,Japan)でホモジナイ ズ(1,000 rpm,20 秒間,5 回)した.組織ホモジネートに最終濃度が 2% となるよ うに 20% sodium dodecyl sulfate(SDS)を加えた後,5 分間 2 回煮沸し,タンパク質 を可溶化した.タンパク質量は Bradford 法 63) を用いて測定した後,タンパク質の最
終濃度が 2 g/L となるように 5×sample buffer(312.5 mM Tris-HCl,10% SDS,25% -mercaptoethanol,50% glycerol,0.15% bromophenolblue,pH 6.8)および homogenization buffer を加え,5 分間 2 回煮沸し western immunoblotting 用の試料溶液とした.
1‐1‐6 Western immunoblotting
10
( Abcam , Cambridge , UK ) を 1,000 倍 , mouse monoclonal anti-mono and polyubiquitinylated conjugates 抗体(FK2,Enzo Life Sciences, Inc.)を 500 倍,rabbit polyclonal anti-Atg1 抗体(Sigma-Aldrich Co.,St. Louis,MO,USA),rabbit polyclonal anti-Atg13 抗体(Sigma-Aldrich Co.),rabbit polyclonal anti-Beclin 1 抗体(Sigma-Aldrich Co.)を 1,000 倍,rabbit polyclonal anti-Atg5 抗体(Sigma-Aldrich Co.)を 2,000 倍, rabbit polyclonal anti-microtubule-associated protein 1 light chain 3 ( LC3 ) 抗 体 ( Sigma-Aldrich Co. ) を 1,000 倍 , rabbit polyclonal anti-phosphorylated SQSTM1 (serine403)抗体(GeneTex, Inc.,Irvine,CA,USA)を 500 倍,mouse monoclonal anti-glyceraldehyde 3-phosphate dehydrogenase(GAPDH)抗体(6C5,Millipore)を 10,000 倍となるように 5% Blocking One 含有 TBST 溶液で希釈して PVDF 膜に添加し,低 温室 4°C で一晩インキュベートした.一次抗体反応後,5% Blocking One 含有 TBST 溶 液 で 5 分 間 , 3 回 洗 浄 し た . 二 次 抗 体 と し て HSP72 , HSPB5 , mono and polyubiquitinylated conjugates お よ び GAPDH を 検 出 す る た め に は horseradish peroxidase (HRP)-conjugated goat anti-mouse IgG(Sigma-Aldrich Co.)を,HSPB1,PSMB5, Atg1,Atg13,Beclin 1,Atg5,LC3 および phosphorylated SQSTM1(serine403)を検 出するためには HRP-conjugated goat anti-rabbit IgG(Sigma-Aldrich Co.)を TBST 溶液 で 3,000 倍となるように希釈して用い,室温で 1 時間インキュベートした.二次抗体 反応後,TBST 溶液で 5 分間,3 回洗浄し,検出には Chemi-Lumi One L(Nacalai Tesque, Inc.)あるいは Chemi-Lumi One Super(Nacalai Tesque, Inc.)を用いて分離したタンパ ク質を発光させ,ルミノ・イメージアナライザー( LAS3000,Fuji Photo Film Co. Ltd., Tokyo,Japan)により検出した.検出された PVDF 膜上のタンパク質は,ImageJ(National Institutes of Health,Bethesda,MD,USA)を用いて半定量化した.
1‐1‐7 26S プロテアソーム活性の測定
CAL ラットでは梗塞周辺部の viable LV を,一方 Sham ラットでは LV を各 7 分間細 切 し た 後 , 組 織 重 量 の 5 倍 量 の assay buffer ( 20 mM Tris-HCl , 1 mM
ethylenediamine-N,N,N’,N’-tetraacetic acid(EDTA),1 mM NaN3,1 mM DTT,2 mM ATP, pH 7.5)を加え,ポッターホモジナイザー(AS ONE)でホモジナイズ(1,000 rpm,20 秒 間,5 回)した.ホモジネートを遠心分離(1,000×g,4°C,10 分間)し,その上清を再び
遠心分離(13,000×g,4°C,20 分間)した.得られた上清のタンパク質量を Bradford 法 63)
11
条件で測定した.なお,Suc-LLVY-AMC を基質とする他の酵素による AMC 遊離の影響 を排除するため,プロテアーゼ阻害剤 epoxomicin(Peptide Institute, Inc.)を 5 M で作用 させたものも同様に測定した.
1‐1‐8 統計方法
13
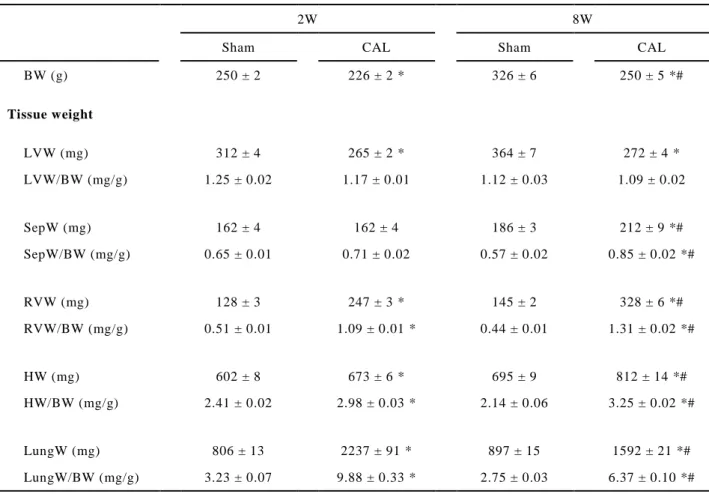
Table 1 Changes in tissue-weight parameters of sham-operated (Sham) and coronary artery-ligated (CAL) rats at the 2nd (2W) and 8th (8W) weeks after the operation.
2W 8W
Sham CAL Sham CAL
BW (g) 250 ± 2 226 ± 2 * 326 ± 6 250 ± 5 *# Tissue weight LVW (mg) 312 ± 4 265 ± 2 * 364 ± 7 272 ± 4 * LVW/BW (mg/g) 1.25 ± 0.02 1.17 ± 0.01 1.12 ± 0.03 1.09 ± 0.02 SepW (mg) 162 ± 4 162 ± 4 186 ± 3 212 ± 9 *# SepW/BW (mg/g) 0.65 ± 0.01 0.71 ± 0.02 0.57 ± 0.02 0.85 ± 0.02 *# RVW (mg) 128 ± 3 247 ± 3 * 145 ± 2 328 ± 6 *# RVW/BW (mg/g) 0.51 ± 0.01 1.09 ± 0.01 * 0.44 ± 0.01 1.31 ± 0.02 *# HW (mg) 602 ± 8 673 ± 6 * 695 ± 9 812 ± 14 *# HW/BW (mg/g) 2.41 ± 0.02 2.98 ± 0.03 * 2.14 ± 0.06 3.25 ± 0.02 *# LungW (mg) 806 ± 13 2237 ± 91 * 897 ± 15 1592 ± 21 *# LungW/BW (mg/g) 3.23 ± 0.07 9.88 ± 0.33 * 2.75 ± 0.03 6.37 ± 0.10 *#
Each value represents the means ± SEM of 6 independent experiments. *P<0.05 vs. the corresponding Sham
groups. #P<0.05 vs. 2W-CAL group.
14
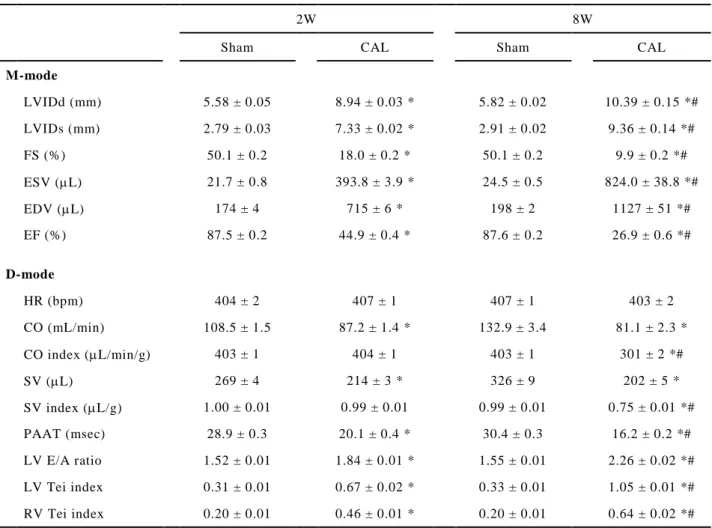
1‐2‐2 左冠状動脈結紮後の心機能指標の変化
術後 2 週および 8 週目の CAL ラットおよび Sham ラットの心エコー法を用いた 心機能指標の測定結果を Table 2 に示す.
15
Table 2 Changes in echocardiographic parameters of sham-operated (Sham) and coronary artery-ligated (CAL) rats at the 2nd (2W) and 8th (8W) weeks after the operation.
2W 8W
Sham CAL Sham CAL
M-mode LVIDd (mm) 5.58 ± 0.05 8.94 ± 0.03 * 5.82 ± 0.02 10.39 ± 0.15 *# LVIDs (mm) 2.79 ± 0.03 7.33 ± 0.02 * 2.91 ± 0.02 9.36 ± 0.14 *# FS (%) 50.1 ± 0.2 18.0 ± 0.2 * 50.1 ± 0.2 9.9 ± 0.2 *# ESV (L) 21.7 ± 0.8 393.8 ± 3.9 * 24.5 ± 0.5 824.0 ± 38.8 *# EDV (L) 174 ± 4 715 ± 6 * 198 ± 2 1127 ± 51 *# EF (%) 87.5 ± 0.2 44.9 ± 0.4 * 87.6 ± 0.2 26.9 ± 0.6 *# D-mode HR (bpm) 404 ± 2 407 ± 1 407 ± 1 403 ± 2 CO (mL/min) 108.5 ± 1.5 87.2 ± 1.4 * 132.9 ± 3.4 81.1 ± 2.3 * CO index (L/min/g) 403 ± 1 404 ± 1 403 ± 1 301 ± 2 *# SV (L) 269 ± 4 214 ± 3 * 326 ± 9 202 ± 5 * SV index (L/g) 1.00 ± 0.01 0.99 ± 0.01 0.99 ± 0.01 0.75 ± 0.01 *# PAAT (msec) 28.9 ± 0.3 20.1 ± 0.4 * 30.4 ± 0.3 16.2 ± 0.2 *# LV E/A ratio 1.52 ± 0.01 1.84 ± 0.01 * 1.55 ± 0.01 2.26 ± 0.02 *# LV Tei index 0.31 ± 0.01 0.67 ± 0.02 * 0.33 ± 0.01 1.05 ± 0.01 *# RV Tei index 0.20 ± 0.01 0.46 ± 0.01 * 0.20 ± 0.01 0.64 ± 0.02 *#
Each value represents the means ± SEM of 6 independent experiments. *P<0.05 vs. the corresponding Sham
groups. #P<0.05 vs. 2W-CAL group.
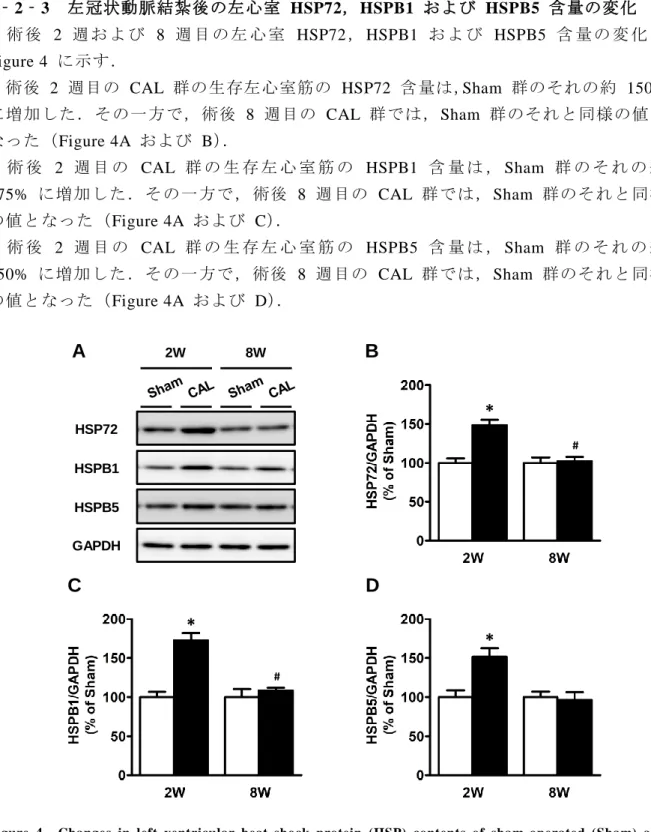
16 1‐2‐3 左冠状動脈結紮後の左心室 HSP72,HSPB1 および HSPB5 含量の変化 術 後 2 週 お よ び 8 週 目 の 左 心 室 HSP72, HSPB1 お よ び HSPB5 含 量 の 変 化 を Figure 4 に示す. 術後 2 週目の CAL 群の生存左心室筋の HSP72 含量は,Sham 群のそれの約 150% に増加した.その一方で,術後 8 週目の CAL 群では,Sham 群のそれと同様の値と なった(Figure 4A および B). 術 後 2 週 目 の CAL 群 の 生 存 左 心 室 筋 の HSPB1 含 量 は , Sham 群 の そ れ の 約 175% に増加した.その一方で, 術後 8 週目の CAL 群では, Sham 群のそれと同様 の値となった(Figure 4A および C). 術 後 2 週 目 の CAL 群 の 生 存 左 心 室 筋 の HSPB5 含 量 は , Sham 群 の そ れ の 約 150% に増加した.その一方で,術後 8 週目の CAL 群では, Sham 群のそれと同様 の値となった(Figure 4A および D).
Figure 4 Changes in left ventricular heat-shock protein (HSP) contents of sham-operated (Sham) and coronary artery-ligated (CAL) rats at the 2nd (2W) and 8th (8W) weeks after the operation.
Representative immunoblots (A) and semi -quantification of HSP72 (B), HSPB1 (C), and HSPB5 (D) in the viable left ventricle of Sham (open columns) and CAL rats (closed columns) at the 2nd and 8th weeks after the operation are shown. Each protein band of HSP72, HSPB1 or HSPB5 was normalized to its respective glyceraldehyde 3-phosphate dehydrogenase (GAPDH) band. Each v alue represents the means ± SEM of 4 -6
independent experiments. *P<0.05 vs. the corresponding Sham groups. #P<0.05 vs. 2W-CAL group.
18
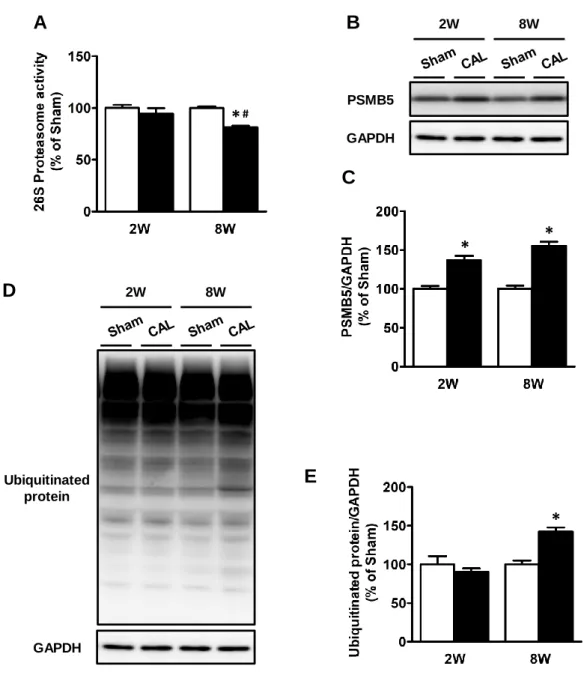
Figure 5 Changes in left ventricular 26S proteasome activity and proteasome 5 subunit (PSMB5) and ubiquitinated protein contents of sham-operated (Sham) and coronary artery-ligated (CAL) rats at the 2nd (2W) and 8th (8W) weeks after the operation.
26S proteasome chymotrypsin-like activity in the viable left ventricular of Sham (open columns) and CAL rats (closed columns) at the 2nd and 8th weeks after the operation are shown (A). Representative immunoblots (B) and semi-quantification of PSMB5 (C) in the viable left ventricle of Sham and CAL rats at the 2nd and 8th weeks after the operation are shown. Representative immunoblots (D) and semi -quantification of ubiquitinated protein (E) in the viable left ventricle of Sham and CAL rats at the 2nd and 8th weeks after the operation are shown. Each protein band of PSMB5 or ubiquitinated protein was normalized to its respective glyceraldehyde 3 -phosphate dehydrogenase (GAPDH) band. Each value represents the means ± SEM of 3 -4 independent experiments.
*P<0.05 vs. the corresponding Sham groups. #P<0.05 vs. 2W-CAL group.
19
1‐2‐5 左冠状動脈結紮後の左心室オートファジー関連タンパク質含量の変化 術 後 2 週 お よ び 8 週 目 の 左 心 室 オ ー ト フ ァ ジ ー 関 連 タ ン パ ク 質 含 量 の 変 化 を Figure 6 に示す.
術後 2 週目の CAL 群の生存左心室筋の Atg1 含量は,Sham 群のそれと同様の値 となった.その一方で,術後 8 週目の CAL 群では,Sham 群のそれの約 60% に減 少した(Figure 6A および B).
術後 2 週目の CAL 群の生存左心室筋の Atg13 含量は,Sham 群のそれの約 135% に増加したものの,術後 8 週目の CAL 群では,Sham 群のそれと同様の値まで減少 した(Figure 6A および C).
術 後 2 週 目 の CAL 群 の 生 存 左 心 室 筋 の Beclin 1 含 量 は , Sham 群 の そ れ の 約 150% に増加したものの,術後 8 週目の CAL 群では, Sham 群のそれと同様の値と なった(Figure 6A および D).
術後 2 週目の CAL 群の生存左心室筋の Atg5 含量は,Sham 群のそれの約 80% となったものの,有意な差はなかった.その一方で,術後 8 週目の CAL 群では,Sham 群のそれの約 60% に減少した(Figure 6A および E).
術後 2 週目の CAL 群の生存左心室筋の LC3-II/LC3-I 比は,Sham 群のそれの約 60% となったものの,有意な差はなかった.その一方で,術後 8 週目の CAL 群では, Sham 群のそれの約 30% に低下した(Figure 6A および F).
20
Figure 6 Changes in left ventricular autophagy-related protein contents of sham-operated (Sham) and coronary artery-ligated (CAL) rats at the 2nd (2W) and 8th (8W) weeks after the operation.
Representative immunoblots (A) and semi -quantification of Atg1 (B), Atg13 (C), Beclin 1 (D), Atg5 (E), microtubule-associated protein 1 light chain 3 (LC3)-II (F), and phosphorylated sequestosome 1 (SQSTM1) (G) in the viable left ventricle of Sham (open columns) and CAL rats (closed columns) at the 2nd and 8th weeks after the operation are shown. Each protein band of Atg1, Atg13, Beclin 1 or Atg5 was normalized to its respective glyceraldehyde 3-phosphate dehydrogenase (GAPDH) band. Each protein band of LC3-II was normalized to its respective LC3-I band. Each protein band of p -SQSTM1 was normalized to its respective SQSTM1 band. Each value represents the means ± SEM of 4 independent experiments. * P<0.05 vs. the corresponding Sham groups.
21
1‐3 考察
22 26S プロテアソーム活性レベル を維持し,ユビキチン化タンパク質の蓄積を回避 する ことで,心機能の代償に寄与している可能性が示された.一方,心筋梗塞後 8 週目の 生存左心室筋では,PSMB5 含量は増加しているものの,26S プロテアソームとして機 能できず,ユビキチン化タンパク質が蓄積すると考えられた. 続いて,プロテアソームで分解し得ないユビキチン化タンパク質の処理に関与する 選択的オートファジーの変化について検討した. オートファゴソームの形成には 18 種類のオートファジー関連タンパク質(Atg)が必須である 51).これらは主に 5 つの 異なった機能をもつグループ,すなわちオートファジーの始動に関与する Atg1 複合 体,隔離膜の形成に関与する Atg9 小胞,必要な因子の隔離膜へのリクルートに関与 するオートファジー特異的ホスファチジルイノシトール 3-キナーゼ(phosphoinositide 3-kinase; PI3K)複合体,隔離膜の伸長に関与する Atg12 結合反応系および隔離膜の閉 塞に関与する LC3 翻訳後修飾系から成る 71).そこで,これらの Atg のうち Atg1 複
24
第二章 心筋梗塞後不全心での HSP 発現低下メカニズムの解明
第一章で,心筋梗塞発症後から慢性心不全に陥る過程で,PQC が破綻していること を示した.前述したように,HDAC6 は 3 つの PQC 経路すべてに関与していること が報告されている 35–39).HDAC6 は細胞質にのみ局在しており,非ストレス条件下で
25 2‐1 実験材料・方法 2‐1‐1 実験動物 1‐1‐1 と同様に実験動物を使用した. 2‐1‐2 ラット心筋梗塞モデルの作製 1‐1‐2 と同様に作製した. 2‐1‐3 Western immunoblotting 用試料溶液の調製 1‐1‐5 と同様に調製した. 2‐1‐4 Western immunoblotting 1‐1‐6 と同様の方法で行った.なお,本実験では一次抗体として rabbit monoclonal anti-HDAC6 抗体(D21B10,Cell Signaling Technology, Inc.,Danvers,MA,USA)を 1,000 倍,mouse monoclonal anti--tubulin 抗体(B-5-1-2,Sigma-Aldrich Co.)を 4,000 倍, mouse monoclonal anti-acetylated -tubulin(lysine40)抗体(6-11B-1,Sigma-Aldrich Co.) を 20,000 倍 , mouse monoclonal anti-HSP90 抗 体 ( 68/Hsp90 , BD Transduction Laboratories,Lexington,KY,USA)を 1,000 倍,rat monoclonal anti-HSF1 抗体(10H8, StressMarq Biosciences Inc. , Victoria , BC , Canada ) を 500 倍 , mouse monoclonal anti-GAPDH 抗体(6C5,Millipore)を 10,000 倍となるように 5% Blocking One 含有 TBST 溶液で希釈して用いた.
2‐1‐5 免疫沈降法
免疫沈降法は Takagi らの方法 79) に準じて行った.2‐1‐3 で得られた組織ホモジ
26
polyclonal anti-acetylated HSP90(Lys294)抗体(Rockland Immunochemicals Inc.,Limerick, PA,USA)を 500 倍となるように Can Get Signal® Solution 1(TOYOBO Co., Ltd.,Osaka,
Japan)で希釈して用いた.二次抗体として TidyBlot Western Blot Detection Reagent: HRP (Bio-Rad Laboratories, Inc.,Hercules,CA,USA)を Can Get Signal® Solution 2(TOYOBO
Co., Ltd.)で 400 倍となるように希釈して用いた.さらに同一 PVDF 膜上の HSP90 を検出するため,ストリッピングバッファー for Western(APRO Science Inc.,Tokushima, Japan)中で 15 分間室温でインキュベートし,PVDF 膜上の一次抗体および二次抗体 を除去した.その後,50% Blocking One(Nacalai Tesque, Inc.)含有 TBST 溶液を用い て室温で 30 分間ブロッキングを行い,1,000 倍となるように 5% Blocking One 含有 TBST 溶液で希釈した mouse monoclonal anti-HSP90 抗体を一次抗体として用いた.1 ‐1‐6 と同様の操作で acetylated HSP90 および HSP90 の半定量を行った.
2‐1‐6 免疫染色
摘出心臓を Langendorff 灌流装置に装着し,定流量灌流(9 mL/min)を行った.灌 流液には,37°C の 25 mM potassium chloride,50 mM sodium fluoride および 30 mM sodium pyrophosphate を含有する Krebs-Henseleit bicarbonate buffer(KHB 緩衝液: 120 mM NaCl,4.8 mM KCl,1.2 mM KH2PO4,1.2 mM MgSO4,1.25 mM CaCl2,25 mM NaHCO3,
11 mM glucose)を用い,組織内の血液を除去した.なお,灌流液は 95% O2 + 5% CO2
混合ガスを予め通気させることで酸素化すると同時に pH を 7.4 に維持した. 次に 4% paraformaldehyde(PFA), 50 mM sodium fluoride お よび 30 mM sodium pyrophosphate を含有する 0.1 M phosphate-buffer(PFA 溶液,pH 7.4,4°C)で灌流固 定(9 mL/min)した.灌流固定後,速やかに灌流心を Langendorff 灌流装置から取り 外し,PFA 溶液(4°C)中に一晩浸漬することによりさらに組織固定を行った(後固定). 固定後,30% sucrose 含有 0.1 M phosphate-buffer に組織を一晩浸漬した後,水溶性包 埋剤である Neg-50™(Thermo Fisher Scientific, Inc.)を用いて,液体窒素で 10 分間か けて凍結し,凍結ブロックを作製した.
27
た.続いて,二重染色するための一次抗体として mouse monoclonal anti--actinin 抗体 (EA-53,Sigma-Aldrich Co.)を 5% Blocking One Histo 含有 PBS で 100 倍に希釈し, 4°C で組織切片と一晩反応させた.反応終了後,5% Blocking One Histo 含有 PBS で洗 浄し,二次抗体として fluorescein isothiocyanate (FITC)-conjugated horse anti-mouse IgG 抗体(Vector Laboratories, Inc.,Burlingame,CA,USA)を PBS で 100 倍に希釈し, 室温で組織切片と 1 時間反応させることにより 2 番目の蛍光色素標識を行った.各 染色には 300 nM 4’,6-diamidino-2-phenylindole dihydrochloride(DAPI; Life Technologies Co.)を用いた.多重染色操作終了後, PBS で洗浄し,組織切片を Dako Fluorescence Mounting Medium(Agilent Technologies, Ltd.,Santa Clara,CA,USA)で封入し,落射 式蛍光顕微鏡(BX-52; Olympus,Tokyo,Japan)にて組織切片の観察を行った. 2‐1‐7 統計方法
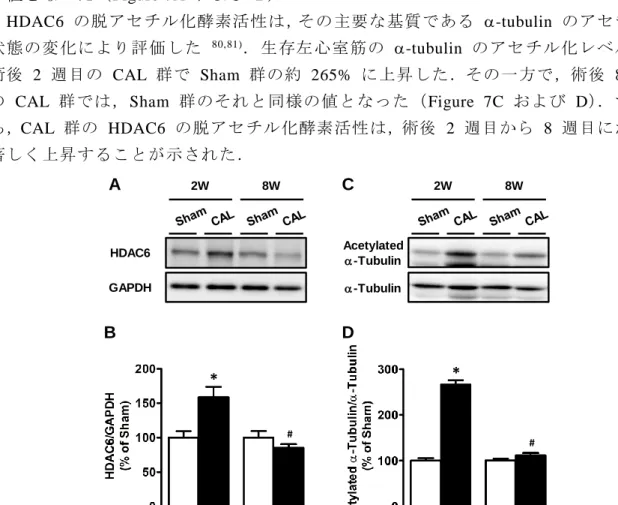
28 2‐2 結果 2‐2‐1 左冠状動脈結紮後の左心室 HDAC6 含量および脱アセチル化酵素活性の変 化 術後 2 週および 8 週目の左心室 HDAC6 含量および脱アセチル化酵素活性の変化 を Figure 7 に示す.
術 後 2 週 目 の CAL 群 の 生 存 左 心 室 筋 の HDAC6 含 量 は , Sham 群 の そ れ の 約 160% に増加した.その一方で,術後 8 週目の CAL 群では, Sham 群のそれと同様 の値となった(Figure 7A および B).
HDAC6 の脱アセチル化酵素活性は,その主要な基質である -tubulin のアセチル化 状態の変化により評価した 80,81).生存左心室筋の -tubulin のアセチル化レベルは,
術後 2 週目の CAL 群で Sham 群の約 265% に上昇した.その一方で,術後 8 週目 の CAL 群では,Sham 群のそれと同様の値となった(Figure 7C および D).すなわ ち,CAL 群の HDAC6 の脱アセチル化酵素活性は,術後 2 週目から 8 週目にかけて 著しく上昇することが示された.
Figure 7 Changes in left ventricular histone deacetylase 6 (HDAC6) content and its activity of sham-operated (Sham) and coronary artery -ligated (CAL) rats at the 2nd (2W) and 8th (8W) weeks after the operation.
Representative immunoblots (A) and semi -quantification of HDAC6 (B) in the viable left ventricle of Sham (open columns) and CAL rats (closed columns) at the 2nd and 8th weeks after the operation are shown. Each protein band of HDAC6 was normalized to its respective glyceraldehyde 3 -phosphate dehydrogenase (GAPDH) band. Representative immunoblots (C) and semi -quantification of acetylated -tubulin (D) in the viable left ventricle of Sham and CAL rats at the 2nd and 8th weeks after the operation are shown. Each protein band of acetylated -tubulin was normalized to its respective -tubulin band. Each value represents the means ± SEM of
4-6 independent experiments. *P<0.05 vs. the corresponding Sham groups. #P<0.05 vs. 2W-CAL group.
29 2‐2‐2 左冠状動脈結紮後の左心室 HSP90 および HSF1 含量の変化 術後 2 週および 8 週目の左心室 HSP90 および HSF1 含量の変化を Figure 8 に 示す. 術後 2 週および 8 週目の CAL 群の生存左心室筋の HSP90 含量は,Sham 群のそ れのそれぞれ約 220% および 235% に増加した(Figure 8A および B). 術 後 2 週 お よ び 8 週 目 の CAL 群 の 生 存 左 心 室 筋 の HSF1 含 量 は , い ず れ も Sham 群のそれの約 140% に増加した(Figure 8A および C).
Figure 8 Changes in left ventricular heat-shock protein 90 (HSP90) and heat-shock transcription factor 1 (HSF1) contents of sham-operated (Sham) and coronary artery-ligated (CAL) rats at the 2nd (2W) and 8th (8W) weeks after the operation.
Representative immunoblots (A) and semi -quantification of HSP90 (B) and HSF1 (C) in the viable left ventricle of Sham (open columns) and CAL rats (closed columns) at the 2nd and 8th weeks after the operation are shown. Each protein band of HSP90 or HSF1 was normalized to its respective glyceraldehyde 3 -phosphate dehydrogenase (GAPDH) band. Each value represents the means ± SEM of 4 independent experiments. * P<0.05
vs. the corresponding Sham groups.
30 2‐2‐3 左冠状動脈結紮後の左心室 HSP90 のアセチル化レベルの変化 術後 2 週および 8 週目の左心室 HSP90 のアセチル化レベルの変化を Figure 9 に 示す. 術後 2 週目の CAL 群の生存左心室筋の HSP90 のアセチル化レベルは,Sham 群 のそれの約 125% に上昇した.その一方で,術後 8 週目の CAL 群では,Sham 群の それの約 50% に低下した(Figure 9A および B).
Figure 9 Changes in left ventricular acetylation level of HSP90 in sham-operated (Sham) and coronary artery-ligated (CAL) rats at the 2nd (2W) and 8th (8W) weeks after the operation.
Representative immunoblots (A) and semi -quantification of the ratio of acetylated HSP90 to immunoprecipitated HSP90 (B) in the viable left ventricle of Sham (open columns) an d CAL rats (closed columns) at the 2nd and 8th weeks after the operation are shown. Each value represents the means ± SEM of 3 independent experiments.
*P<0.05 vs. the corresponding Sham groups. #P<0.05 vs. 2W-CAL group.
31 2‐2‐4 左冠状動脈結紮後の左心室 HSF1 の細胞内局在の変化 術後 2 週および 8 週目の左室心筋組織の HSF1,-actinin および核の三重染色像 を Figure 10 に示す. 術後 2 週および 8 週目の Sham 群では,HSF1 の染色像が -actinin 陽性細胞, すなわち心筋細胞内全体で観察された.術後 2 週目の CAL 群では,図中矢頭で示す ように HSF1 の心筋細胞の核への集積が観察された.しかしながら,術後 8 週目の CAL 群では,HSF1 の心筋細胞核への集積は観察されなかった.
Figure 10 Immunohistochemical analysis of subcellular localization of heat -shock transcription factor 1 (HSF1) in sham-operated (Sham) and coronary artery -ligated (CAL) rats at the 2nd (2W) and 8th (8W) weeks after the operation.
Representative immunofluorescence photomicrographs of subcellular localization of HSF1 in the viable left ventricle of Sham and CAL rats at the 2nd and 8th weeks after the operation are shown. Heart tissue sections were stained with HSF1 antibody, -actinin antibody, and 4’,6-diamidino-2-phenylinodole (DAPI). HSF1 is identified by the red fluorescence; and -actinin-positive cardiomyocytes, by the green fluorescence. Nuclei are identified by the blue fluorescence of DAPI. Arrowheads indicate nuclear localization of HSF 1. The scale bar represents 20 m.
HSF1 -Actinin DAPI Merge
34
小括
36 3‐1 実験材料・方法 3‐1‐1 実験動物 1‐1‐1 と同様に実験動物を使用した. 3‐1‐2 ラット心筋梗塞モデルの作製 1‐1‐2 と同様に作製した. 3‐1‐3 被験薬の投与計画および実験群
HDAC 阻害薬である suberoylanilide hydroxamic acid(SAHA; Cayman Chemical,Ann Arbor,MI,USA)を術後 2 週目から 8 週目までの 6 週間,CAL ラットあるいは Sham ラ ッ ト に 1 日 1 回 経 口 投 与 し た . SAHA は 0.5% Tween 80 を 含 む 1% sodium carboxymethyl cellulose(CMC-Na)溶液中に 6.25 mg/mL の濃度に懸濁して用いた. SAHA の投与量は 50 mg/kg/day とした.なお,SAHA の代わりに 0.5% Tween 80 を 含む 1% CMC-Na 溶液を投与した群を Vehicle 群とした.
Figure 12 Chemical structure of suberoylanilide hydroxamic acid
37
3‐1‐7 Western immunoblotting
38
3‐2 結果
3‐2‐1 左冠状動脈結紮後の左心室 HDAC6 含量および脱アセチル化酵素活性の変 化に及ぼす suberoylanilide hydroxamic acid 投与の効果
左冠状動脈結紮後の左心室 HDAC6 含量および脱アセチル化酵素活性の変化に及ぼ す SAHA 投与の効果を Figure 13 に示す.
術後 8 週目の Sham-SAHA 群および CAL-SAHA 群の生存左心室筋の HDAC6 含 量は,Sham-Vehicle 群および CAL-Vehicle 群のそれのそれぞれ約 140% および 150% に増加した(Figure 13A および B).
術後 8 週目の CAL-SAHA 群の生存左心室筋の -tubulin のアセチル化レベルは, CAL-Vehicle 群のそれの約 280% に上昇し,SAHA の投与により HDAC6 の脱アセチ ル化酵素活性が阻害された.Sham-SAHA 群では,Sham-Vehicle 群のそれの約 130% と なった(Figure 13C および D).
Figure 13 Effects of suberoylanilide hydroxamic acid (SAHA) treatment on changes in left ventricular histone deacetylase 6 (HDAC6) content and its activity of sham-operated (Sham) and coronary artery-ligated (CAL) rats at the 8th week (8W) after the operation.
Representative immunoblots (A) and semi -quantification of HDAC6 (B) in the viable left ventricle of Sham (open columns) and CAL rats (closed columns) with and without SAHA treatment at the 8th week after the operation are shown. Each protein band of HDAC6 was normalized to its respective glyceraldehyde 3 -phosphate dehydrogenase (GAPDH) band. Representative immunoblots (C) and semi -quantification of acetylated -tubulin (D) in the viable left ventricle of Sham and CAL rats with and without SAHA treatment at the 8th week after the operation are shown. Each protein band of acetylated -tubulin was normalized to its respective -tubulin band. Each value represents the means ± SEM of 4 independent experiments. *P<0.05 vs. the corresponding Sham
groups. #P<0.05 vs. CAL-Vehicle group. †P<0.05 vs. Sham-Vehicle group.
39
3 ‐ 2 ‐ 2 左 冠 状 動 脈 結 紮 後 の 左 心 室 HSP90 お よ び HSF1 含 量 の 変 化 に 及 ぼ す suberoylanilide hydroxamic acid 投与の効果
左冠状動脈結紮後の左心室 HSP90 および HSF1 含量の変化に及ぼす SAHA 投与 の効果を Figure 14 に示す. 術後 8 週目の CAL-Vehicle 群およ び CAL-SAHA 群 の生存 左心 室筋の HSP90 含 量は,Sham-Vehicle 群および Sham-SAHA 群のそれのそれぞれ約 235% および 200% に増加した(Figure 14A および B). 術後 8 週目の CAL-Vehicle 群および CAL-SAHA 群の生存左心室筋の HSF1 含量 は ,Sham-Vehicle 群お よ び Sham-SAHA 群 の そ れ の そ れ ぞれ 約 140% お よ び 150% に増加した(Figure 14A および C).
Figure 14 Effects of suberoylanilide hydroxamic acid (SAHA) treatment on changes in left ventricular heat-shock protein 90 (HSP90) and heat-shock transcription factor 1 (HSF1) contents of sham-operated (Sham) and coronary artery-ligated (CAL) rats at the 8th week (8W) after the operation.
Representative immunoblots (A) and semi -quantification of HSP90 (B) and HSF1 (C) in the viable left ventricle of Sham (open columns) and CAL rats (closed columns) with and without SAHA treatment at the 8th week after the operation are shown. Each protein band of HSP90 or HSF1 was normalized to its respective glyceraldehyde 3-phosphate dehydrogenase (GAPDH) band. Each value represents the means ± SEM of 4 independent experiments. *P<0.05 vs. the corresponding Sham groups.
40
3‐ 2‐ 3 左 冠 状 動 脈 結 紮 後 の 左 心 室 HSP90 の ア セ チ ル 化 レ ベ ル の 変 化 に 及 ぼ す suberoylanilide hydroxamic acid 投与の効果
左冠状動 脈結紮 後の 左心室 HSP90 の アセ チル化レベ ルの変 化に 及ぼす SAHA 投 与の効果を Figure 15 に示す.
術後 8 週目の CAL-Vehicle 群の生存左心室筋の HSP90 のアセチル化レベルは, Sham-Vehicle 群のそれの約 50% に低下した.CAL-SAHA 群の HSP90 のアセチル化 レベルは,CAL-Vehicle 群のそれの約 225% となった(Figure 15A および B).
Figure 15 Effects of suberoylanilide hydroxamic acid (SAHA) treatment on changes in left ventricular acetylation level of HSP90 in sham-operated (Sham) and coronary artery-ligated (CAL) rats at the 8th week (8W) after the operation.
Representative immunoblots (A) and semi -quantification of the ratio of acetylated HSP90 to immunoprecipitated HSP90 (B) in the viable left ventricle of Sham (open columns) and CAL rats (closed columns) with and without SAHA treatment at the 8th week after the operation are shown. Each value represen ts the means ± SEM of 3
independent experiments. *P<0.05 vs. the corresponding Sham groups. #P<0.05 vs. CAL-Vehicle group.
41
3 ‐ 2 ‐ 4 左 冠 状 動 脈 結 紮 後 の 左 心 室 HSF1 の 細 胞 内 局 在 の 変 化 に 及 ぼ す suberoylanilide hydroxamic acid 投与の効果
Vehicle あ る い は SAHA の 投 与 を 行 っ た 術 後 8 週 目 の ラ ッ ト の 左 室 心 筋 組 織 の HSF1,-actinin および核の三重染色像を Figure 16 に示す. 術 後 8 週 目 の Sham-Vehicle 群 で は , HSF1 の 染 色 像 が 心 筋 細 胞 の 指 標 と な る -actinin 陽性細胞で観察された.CAL-Vehicle 群でも同様に HSF1 の染色像が心筋細 胞内全体で観察されたものの,心筋細胞核への集積 は観察されなかった.その一方で, CAL-SAHA 群では,図中矢頭で示すように -actinin が陽性となる心筋細胞内の核に HSF1 の集 積が観察 さ れた. Sham-SAHA 群 でも一部の心 筋細胞で 核への HSF1 の集 積が観察された.
Figure 16 Effects of suberoylanilide hydroxamic acid (SAHA) treatment on changes in left ventricular subcellular localization of heat -shock transcription factor 1 (HSF1) in sham-operated (Sham) and coronary artery-ligated (CAL) rats at the 8th week (8W) after the operation.
Representative immunofluorescence photomicrographs of subcellular localization of HSF1 in the viable left ventricle of Sham and CAL rats with and without SAHA treatment at the 8th week after the operation are shown. Heart tissue sections were stained with HSF1 antibody, -actinin antibody, and 4’,6-diamidino-2-phenylinodole (DAPI). HSF1 is identified by the red fluorescence; and -actinin-positive cardiomyocytes, by the green fluorescence. Nuclei are identified by the blue fluorescence of DAPI. Arrowheads indicate nuclear localization of HSF1. The scale bar represents 20 m.
HSF1 -Actinin DAPI Merge
42
3‐2‐5 左冠状動脈結紮後の左心室 HSP72,HSPB1 および HSPB5 含量の変化に及 ぼす suberoylanilide hydroxamic acid 投与の効果
43
Figure 17 Effects of suberoylanilide hydroxamic acid (SAHA) treatment on changes in left ventricular heat-shock protein (HSP) contents of sham-operated (Sham) and coronary artery -ligated (CAL) rats at the 8th week (8W) after the operation.
Representative immunoblots (A) and semi-quantification of HSP72 (B), HSPB1 (C), and HSPB5 (D) in the viable left ventricle of Sham (open columns) and CAL rats (closed columns) with and without SAHA treatment at the 8th week after the operation are shown. Each protein band of HSP72, HSPB1 or H SPB5 was normalized to its respective glyceraldehyde 3-phosphate dehydrogenase (GAPDH) band. Each value represents the means ± SEM
of 4 independent experiments. *P<0.05 vs. the corresponding Sham groups. #P<0.05 vs. CAL-Vehicle group.
44
3‐ 2‐ 6 左 冠 状 動 脈 結 紮 後 の 左 心 室 ユ ビ キ チ ン 化 タ ン パ ク 質 含 量 の 変 化 に 及 ぼ す suberoylanilide hydroxamic acid 投与の効果
左冠状動脈結紮後の左心室ユビキチン化タンパク質含量の変化に及ぼす SAHA 投 与の効果を Figure 18 に示す. 術後 8 週目の CAL-Vehicle 群の生存左心室筋のユビキチン化タンパク質含量は, Sham-Vehicle 群 のそれ の約 135% に増加 し た. CAL-SAHA 群 の ユビキチ ン化タン パ ク質含量は,CAL-Vehicle 群のそれの約 85% となり,ユビキチン化タンパク質の蓄積 は軽減された(Figure 18A および B).
Figure 18 Effects of suberoylanilide hydroxamic acid (SAHA) treatment on changes in left ventricular ubiquitinated protein content of sham-operated (Sham) and coronary artery-ligated (CAL) rats at the 8th week (8W) after the operation.
Representative immunoblots (A) and semi -quantification of ubiquitinated protein (B) in the viable left ventricle of Sham and CAL rats with and without SAHA treatment at the 8th we ek after the operation are shown. Each protein band of ubiquitinated protein was normalized to its respective glyceraldehyde 3 -phosphate dehydrogenase (GAPDH) band. Each value represents the means ± SEM of 4 independent experiments. * P<0.05
vs. the corresponding Sham groups.
45 3‐ 2‐ 7 左 冠 状 動 脈 結 紮 後 の 体 重 お よ び 組 織 重 量 の 変 化 に 及 ぼ す suberoylanilide hydroxamic acid 投与の効果 左 冠 状 動 脈 結 紮 後 の 体 重 お よ び 組 織 重 量 の 変 化 に 及 ぼ す SAHA 投 与 の 効 果 を Table 3 に示す. 術後 8 週目の CAL-Vehicle 群の BW は,Sham-Vehicle 群のそれの約 73% であっ た . CAL-SAHA 群 の BW は , Sham-SAHA 群 の そ れ の 約 86% で あ っ た . こ の CAL-SAHA 群の BW 値は,CAL-Vehicle 群のそれの約 112% の高値となった. 術後 8 週目の CAL-Vehicle 群の HW/BW は,Sham-Vehicle 群のそれの約 155% に 上昇した.CAL-SAHA 群の HW/BW は,Sham-SAHA 群のそれの約 130% となり, この CAL-SAHA 群の HW/BW 値は,CAL-Vehicle 群のそれの約 88% の低値となっ た.
術後 8 週目の CAL-Vehicle 群および CAL-SAHA 群の LVW/BW は,Sham-Vehicle 群および Sham-SAHA 群のそれらと同様の値となった.CAL-SAHA 群の LVW/BW 値 は,CAL-Vehicle 群のそれと比較して差はなかった.
術後 8 週目の CAL-Vehicle 群の SepW/BW は,Sham-Vehicle 群のそれの約 170% に上昇した.CAL-SAHA 群の SepW/BW は,Sham-SAHA 群のそれの約 130% となり, この CAL-SAHA 群の SepW/BW 値は,CAL-Vehicle 群のそれの約 80% の低値とな った.
術後 8 週目の CAL-Vehicle 群の RVW/BW は,Sham-Vehicle 群のそれの約 290% に上昇した.CAL-SAHA 群の RVW/BW は,Sham-SAHA 群のそれの約 235% となり, この CAL-SAHA 群の RVW/BW 値は,CAL-Vehicle 群のそれの約 82% の低値となっ た.
46
Table 3 Changes in tissue-weight parameters of sham-operated (Sham) and coronary artery-ligated (CAL) rats with and without suberoylanilide hydroxamic acid (SAHA) treatment at the 8 th week (8W) after the operation.
8W
Vehicle SAHA
Sham CAL Sham CAL
BW (g) 326 ± 9 238 ± 5 * 310 ± 11 266 ± 4 *# Tissue weight LVW (mg) 381 ± 9 257 ± 7 * 380 ± 18 291 ± 15 * LVW/BW (mg/g) 1.17 ± 0.02 1.08 ± 0.02 1.22 ± 0.02 1.09 ± 0.05 SepW (mg) 178 ± 2 221 ± 9 * 180 ± 4 199 ± 7 SepW/BW (mg/g) 0.55 ± 0.02 0.93 ± 0.03 * 0.58 ± 0.01 0.75 ± 0.03 *# RVW (mg) 152 ± 4 327 ± 22 * 150 ± 4 302 ± 15 * RVW/BW (mg/g) 0.47 ± 0.02 1.37 ± 0.07 * 0.48 ± 0.01 1.13 ± 0.05 *# HW (mg) 711 ± 7 805 ± 31 * 709 ± 25 791 ± 25 HW/BW (mg/g) 2.18 ± 0.03 3.38 ± 0.06 * 2.29 ± 0.01 2.97 ± 0.07 *# LungW (mg) 894 ± 12 1482 ± 51 * 875 ± 38 1902 ± 80 *# LungW/BW (mg/g) 2.74 ± 0.04 6.23 ± 0.11 * 2.82 ± 0.04 7.14 ± 0.24 *#
Each value represents the means ± SEM of 4-6 independent experiments. *P<0.05 vs. the corresponding Sham
groups. #P<0.05 vs. CAL-Vehicle group.
47
3‐2‐8 左冠状動脈結紮後の心機能指標の変化に及ぼす suberoylanilide hydroxamic acid 投与の効果
左冠状動脈結紮後の心機能指標の変化に及ぼす SAHA 投与の効果を Table 4 に示 す.
術後 8 週目の CAL-Vehicle 群の LVIDd および LVIDs は,Sham-Vehicle 群のそれ らのそれぞれ約 176% および 335%,CAL-SAHA 群のそれらは Sham-SAHA 群のそれ らのそれぞれ約 173% および 300% の高値となった.CAL-SAHA 群のこれらの値は, CAL-Vehicle 群のそれらのそれぞれ約 95% および 88% の低値となった. 術後 8 週目の CAL-Vehicle 群の FS は,Sham-Vehicle 群のそれの約 19% に低下 し た . CAL-SAHA 群 の FS は , Sham-SAHA 群 の そ れ の 約 32% と な り , こ の CAL-SAHA 群の FS 値は,CAL-Vehicle 群のそれの約 170% の高値となった. 術後 8 週目の CAL-Vehicle 群の CO index は,Sham-Vehicle 群のそれの約 75% に 低下した.一方,CAL-SAHA 群の CO index は,Sham-SAHA 群のそれと同程度の値 となった.この CAL-SAHA 群の CO index 値は,CAL-Vehicle 群のそれの約 135% の 高値となった.
術後 8 週目の CAL-Vehicle 群の PAAT は,Sham-Vehicle 群のそれの約 53% に低 下 し た . CAL-SAHA 群 の PAAT は , Sham-SAHA 群 の そ れ の 約 68% と な り , こ の CAL-SAHA 群の PAAT 値は,CAL-Vehicle 群のそれの約 126% の高値となった. 術 後 8 週 目 の CAL-Vehicle 群 の LV E/A ratio は , Sham-Vehicle 群 の そ れ の 約 145% に上昇した.一方,CAL-SAHA 群の LV E/A ratio は,Sham-SAHA 群のそれと 同程度の値となった.この CAL-SAHA 群の LV E/A ratio は,CAL-Vehicle 群のそれ の約 70% であった.
術 後 8 週 目 の CAL-Vehicle 群 の LV Tei index は , Sham-Vehicle 群 の そ れ の 約 360% に上昇した.CAL-SAHA 群の LV Tei index は,Sham-SAHA 群のそれの約 200% となり,この CAL-SAHA 群の LV Tei index 値は,CAL-Vehicle 群のそれの約 57% で あった.
48
Table 4 Changes in echocardiographic parameters of sham-operated (Sham) and coronary artery-ligated (CAL) rats with and without suberoylanilide hydroxamic acid (SAHA) treatment at the 8th week (8W) after the operation.
8W
Vehicle SAHA
Sham CAL Sham CAL
M-mode LVIDd (mm) 5.78 ± 0.04 10.19 ± 0.07 * 5.59 ± 0.06 9.67 ± 0.12 *# LVIDs (mm) 2.74 ± 0.02 9.16 ± 0.09 * 2.65 ± 0.05 8.05 ± 0.11 *# FS (%) 52.5 ± 0.1 10.0 ± 0.2 * 52.3 ± 0.5 16.8 ± 0.3 *# ESV (L) 20.6 ± 0.5 770.9 ± 21.5 * 18.8 ± 1.1 522.5 ± 20.5 *# EDV (L) 194 ± 4 1059 ± 23 * 175 ± 5 905 ± 32 *# EF (%) 89.4 ± 0.1 27.3 ± 0.6 * 89.3 ± 0.3 42.3 ± 0.6 *# D-mode HR (bpm) 407 ± 3 402 ± 1 411 ± 4 400 ± 2 CO (mL/min) 139.9 ± 2.3 73.9 ± 3.0 * 131.2 ± 2.9 113.0 ± 1.6 *# CO index (L/min/g) 404 ± 1 302 ± 1 * 406 ± 2 403 ± 3 # SV (L) 344 ± 7 184 ± 7 * 320 ± 8 282 ± 5 *# SV index (L/g) 0.99 ± 0.01 0.75 ± 0.01 * 0.99 ± 0.01 1.01 ± 0.01 # PAAT (msec) 29.9 ± 0.6 16.0 ± 0.1 * 29.9 ± 0.7 20.2 ± 0.2 *# LV E/A ratio 1.53 ± 0.01 2.22 ± 0.04 * 1.53 ± 0.01 1.55 ± 0.01 # LV Tei index 0.33 ± 0.01 1.18 ± 0.04 * 0.33 ± 0.01 0.67 ± 0.03 *# RV Tei index 0.21 ± 0.01 0.58 ± 0.01 * 0.20 ± 0.01 0.40 ± 0.03 *#
Each value represents the means ± SEM of 6 independent experiments. *P<0.05 vs. the corresponding Sham
groups. #P<0.05 vs. CAL-Vehicle group.
50
51
55
引用文献
1) Okura Y, Ramadan MM, Ohno Y, Mitsuma W, Tanaka K, Ito M, Suzuki K, Tanabe N, Kodama M, Aizawa Y. Impending epidemic: future projection of heart failure in Japan to the year 2055. Circ. J., 72, 489–491 (2008).
2) Selzer A. Myocardial infarction and heart failure. Calif. Med., 68, 350–352 (1948). 3) Hori M, Kitabatake A, Tsutsui H, Okamoto H, Shirato K, Nagai R, Izumi T, Yokoyama
H, Yasumura Y, Ishida Y, Matsuzaki M, Oki T, Sekiya M, J -DHF program committee. Rationale and design of a randomized trial to assess the effects of β -blocker in diastolic heart failure; Japanese Diastolic Heart Failure Study (J -DHF). J. Card. Fail., 11, 542–547 (2005).
4) Hori M, Sasayama S, Kitabatake A, Toyo -oka T, Handa S, Yokoyama M, Matsuzaki M, Takeshita A, Origasa H, Matsui K, Hosoda S. Low-dose carvedilol improves left ventricular function and reduces cardiovascular hospitalization in Japan ese patients with chronic heart failure: the Multicenter Carvedilol Heart Failure Dose Assessment (MUCHA) trial. Am. Heart J., 147, 324–330 (2004).
5) Poole-Wilson PA, Swedberg K, Cleland JGF, Lenarda A Di, Hanrath P, Komajda M, Lubsen J, Lutiger B, Metra M, Remme WJ, Torp-Pedersen C, Scherhag A, Skene A, for the COMET investigators. Comparison of carvedilol and metoprolol on clinical
outcomes in patients with chronic heart failure in the Carvedilol Or Metoprolol European Trial (COMET): randomised controlled trial. Lancet, 362, 7–13 (2003). 6) ISIS-4 collaborative group. ISIS-4: A randomised factorial trial assessing early oral
captopril, oral mononitrate, and intravenous magnesium sulphate in 58,050 patients with suspected acute myocardial infarction. Lancet, 345, 669–682 (1995).
7) Ferrari R, the PREAMI investigators. Effects of angiotensin-converting enzyme inhibition with perindopril on left ventricular remodeling and clinical outcome: results of the randomized Perindopril and Remodeling in Elderly with A cute Myocardial Infarction (PREAMI) study. Arch. Intern. Med., 166, 659–666 (2006).
8) Kober L, Torp-Pedersen C, Carlsen JE, Bagger H, Eliasen P, Lyngborg K, Videbaek J, Cole DS, Auclert L, Pauly NC, Aliot E, Persson S, Camm AJ, for the TRACE study group. A clinical trial of the angiotensin-converting – enzyme inhibitor trandolapril in patients with left ventricular dysfunction after myocardial infarction. N. Engl. J. Med., 333, 1670–1676 (1995).