(様式4)
学 位 論 文 概 要
平成 30年 1月 10日
学位申請者
( 永瀬 翠 ) 印
学位論文題目
生体内の酸化ストレスと酸化傷害評価法:百寿者と心肺停止症候群及び筋萎縮性側索硬化症患者への応用
学位論文の要旨
酸化ストレスとは生体内の酸化と抗酸化のバランスが崩れ前者に傾き,生体にとって好まし くない状態と定義されている.我々はこれまで,血漿中酸化ストレスマーカーとしてコエンザイ ムQ10(CoQ10)の酸化還元バランス,組織の酸化傷害マーカーとして血漿中遊離脂肪酸とそ の組成に注目し,分析法の確立と応用を行なってきた.還元型CoQ10は強い抗酸化能を持ち,
酸化されると定量的に酸化型になる.そのため,酸化ストレスの定義や還元型CoQ10の鋭敏 性から,血漿中の全CoQ10中の酸化型の割合(%CoQ10)は生体内の酸化ストレスマーカーと して有用であると思われる.しかし,%CoQ10は全身の酸化ストレスを評価しているが,必ずしも 組織の酸化ストレスを評価しているわけではない.生体膜中には非常に酸化されやすい高度 不飽和脂肪酸(PUFA)が多い.そのため組織が酸化傷害を受けると,PUFAが減少し細胞膜 の流動性の低下が起こる.これを補うために飽和脂肪酸を1価不飽和脂肪酸に変換するステ アリルCoA不飽和化酵素によって,オレイン酸やパルミトオレイン酸が増加する.さらに酸化傷 害が進むと細胞は死に至り,膜成分は加水分解され遊離脂肪酸として血中に放出されると考 えられる.したがって,組織が酸化傷害を受けると血漿中の全遊離脂肪酸量は増加し,そのう ちのPUFAの割合(%PUFA)は減少し,16:1や18:1の割合は増加すると考えられる.
この2つの酸化ストレスマーカーを用いて,当研究室では様々な疾病の酸化ストレスを評価 してきたが,本研究では心停止後症候群(PCAS)患者,筋萎縮性側索硬化症(ALS)患者,百 寿者における酸化ストレスを評価した.PCAS,ALS患者,百寿者において,%CoQ10が健常人 に比べ有意に高く%PUFAが有意に低いことから,酸化ストレスが亢進していることが分かった.
また,スーパーオキシドとNOの拡散律速によって生成される,ペルオキシナイトライトのスカベ ンジャーである尿酸がPCASとALSで減少していることが分かった.そのため,これらの疾病で はペルオキシナイトライトの生成も示唆された.さらに全ての例でフリーコレステロール(FC)と コレステロールエステル(CE)の比が有意に高くなっていることもわかった.この比は肝臓から HDLと共に分泌される酵素によって決まる.そのため,肝機能の低下が起きていることが考え られた.これらの結果から,PCAS,ALS患者,百寿者に対する酸化ストレス亢進や肝機能低下 に対する対策が必要であることが示唆された.さらに,局所的な酸化ストレスマーカーとして有 用になると考えられる脳脊髄液(CSF)中のCoQ10の酸化還元バランスの測定法を開発した.
以上の結果と考察は臨床現場での酸化ストレス評価に有用であり,治療方針の策定にも役立
つと考えられる.
備 考
1.要旨は1200字程度にまとめること。
2.本様式により、ワープロで作成することを原則とする。
3.用紙はA4版 上質紙を使用すること。
Contents
Contents
List of Abbreviations
Chapter 1 General Introduction
1-1 Markers of Oxidative Stress! ! ! ! ! ! 2 1-2 Coenzyme Q10 as a AntiOxidant! ! ! ! ! 10 1-3 The Objective of This Study! ! ! ! ! ! 11 References! ! ! ! ! ! ! ! 12
Chapter 2 Oxidative Stress and Abnormal Cholesterol Metabolism in Patients with Post-cardiac Arrest Syndrome
Introduction! ! ! ! ! ! ! ! 16 Subjects and methods! ! ! ! ! ! ! 17 Results and discussion! ! ! ! ! ! ! 19 Conclusion! ! ! ! ! ! ! ! 29
! ! References! ! ! ! ! ! ! ! 30
Chapter 3
Increased oxidative stress in patients with amyotrophic lateral sclerosis and the effect of edaravone administration Introduction! ! ! ! ! ! ! ! 34 Subjects and methods! ! ! ! ! ! ! 35 Results and discussion! ! ! ! ! ! ! 36 Conclusion! ! ! ! ! ! ! ! 44! ! References! ! ! ! ! ! ! ! 45
Chapter 4 Increased Oxidative Stress and
Coenzyme Q10 Deficiency in Centenarians
Introduction! ! ! ! ! ! ! ! 48 Materials and methods! ! ! ! ! ! ! 49 Results and discussion! ! ! ! ! ! ! 50 Conclusion!! ! ! ! ! ! ! ! 58
! ! References! ! ! ! ! ! ! ! 59
! !
Chapter 5 Simultaneous detection of reduced and oxidized forms of
! ! coenzyme Q10 in human cerebral spinal fluid as
! ! a potential marker of oxidative stress
Introduction! ! ! ! ! ! ! ! 63 Materials and methods! ! ! ! ! ! ! 64 Results and discussion! ! ! ! ! ! ! 65 Conclusion! ! ! ! ! ! ! ! 71
! ! References! ! ! ! ! ! ! ! 72
! !
Chapter 6 Conclusion
List of Publications
List of Abbreviations
BR! ! unconjugated bilirubin CE! ! cholesterol esters
CoQ10! oxidized form of coenzyme Q10
CoQ10H2! ubiquinol-10, reduced form of coenzyme Q10 CSF! ! cerebral spinal fluid
CV! ! coefficient of variation ECD! ! electrochemical detector FC! ! free cholesterol
FFA! ! free fatty acids
HDL! ! high density lipoprotein IPA! ! 2-propanol
LCAT! ! lecithin-cholesterol acyltransferase MSA! ! multiple system atrophy
NaClO4! sodium perchlorate
%CoQ10! percentage of oxidized form of coenzyme Q10 in TQ10
%PUFA! percentage of polyunsaturated fatty acids in total FFA
%16:1!! percentage of palmitoleic acid in total FFA
%18:1!! percentage of oleic acid in total FFA PCAS!! post-cardiac arrest syndrome
Psap! ! prosaposin
TBHQ!! tert-butylhydroquinone TH! ! therapeutic hypothermia TC! ! total cholesterol
TQ10! ! total coenzyme Q10 UA! ! uric acid
VC! ! ascorbic acid VE! ! vitamin E
Chapter 1
General Introduction
1
1-1! Markers of Oxidative Stress
Oxidative Stress
! Oxidative stress is defined as a disturbance in the pro-oxidant-antioxidant balance in favor of the former.(1) Increase in oxidative stress has been suggested to cause aging and degenerative diseases such as heart attack, stroke,
neurodegenerative diseases, diabetes, and cancer.(2,3)
! To evaluate oxidative stress, measurement of free radicals and reactive oxygen species (ROS) is the first choice. However it is difficult to measure them directly
because their reactivities are high, and consequently their life-spans are very short and their concentrations are low. Electron spin resonance (ESR) has been used for the measurement of free radicals directly in vitro. However, the detection of free radicals in vivo has not been successful mainly because of the presence of many antioxidants.
! Second choice could be oxidation products of lipids, proteins, and DNA. Kasai et al. focused on 8-hydroxydeoxyguanosine (8-OHdG), oxidation product of
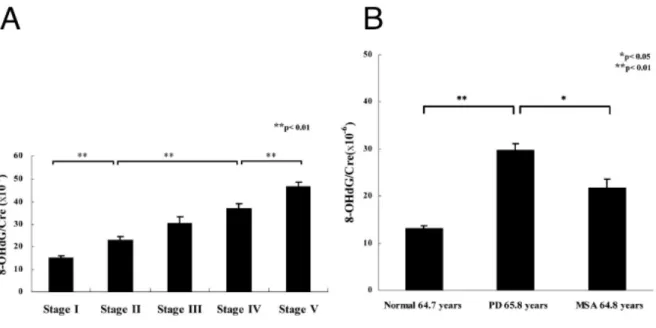
deoxyguanosine (Fig. 1).(4) Since 8-OHdG is secreted to urine, it is a good advantage that a non-invasive measurement is possible. Sato et al. reported that urinary 8-OHdG levels in patients with Parkinson’s disease (PD) were significantly higher than healthy controls and increased with the progression of the disease (Fig. 2).(5)
Moreover, Hayakawa et al. reported the accumulation of 8-OHdG in mitocondrial DNA of human diaphragm with age (Fig.3).(6)
Fig. 1!Structures of deoxyguanosine and 8-OHdG.
! 8-isoprostane F2α is the prostaglandin-liked compounds produced in the free radical oxidation of arachidonic acid in cell membrane and lipoprotein (Fig. 4).(7) Edzard et al. reported 8-isoprostane F2α and that metabolite significantly increased in patients with coronary heart disease that it is known related with diabetes and
hypertension (Fig. 5).(8)
3
Fig. 2!Comparison of urinary levels of 8-OHdG in PD at different of stages (A) and that
! with normal and patients with Multiple system atrophy (MSA) (B).
from ref.[5], Sato S et al. (2015).
Fig. 3 !Changes in 8-ODdG levels in mitochondrial DNA of human diaphragm with age.
from ref.[6], Hayakawa M et al. (1991).
from ref.[7], Stéphanie M et al. (2002).
Fig. 4! Formation of isoprostanes from autoxidation of arachidonic acid.
from ref.[8], Edzard S et al. (2004).
Fig. 5!Levels of urinary 8-iso-Prostaglandin F2α in patients with coronary heart disease as
! compared with age-matched controls. *p < 0.001.
! Thiobarbituric acid reactive substances (TBARS) have been used for the
evaluation of lipid oxidation for a long time. Although the method is convenient, it lacks specificity and accuracy. To overcome these problems Yamamoto et al. developed a postcolumn HPLC detection with chemiluminescence method for the analysis of lipid hydroperoxides (LOOH).(9) LOOH were decomposed by microperoxidase to alkoxyl radicals (LO•) and they oxidized isoluminol to produce light through
isoluminolendoperoxide (Fig. 6).(9) Conversion of LOOH to light makes the detection limit of lipid hydroperoxide very low (less than picomole). Yamamoto et al. detected cholesterol ester hydroperoxide (CE-OOH) even in healthy human plasma.(10) It is intersting that levels of CE-OOH and the ratio of CE-OOH/CE significantly increased in the order of humans, Sprague-Dawley rats (SDR) and Nagase analbuminemic rat (NAR) (Fig.7).(11) NAR are known to be very sensitive to carcinogen such as
N-dimethlnitrosamine, suggesting that increased oxidative stress resulted in increasing the risk of carcinogenesis.(11)
5
from ref.[9], Yamamoto Y et al. (1987).
Fig. 6!Conversion of lipid hydroperoxide to light in the presence of
! microperoxidase and isoluminol.
from ref.[11], Yamamoto Y et al. (1992).
Fig. 7!Levels of lipid hydroperoxide in human, SDR, and NAR plasmas. * means
! human vs SDR and **p < 0.01. † means SDR vs NAR and † = 0.011, †† < 0.01.
! These biological oxidation products are useful to understand the mechanism of ROS-induced oxidative damage. However, they may not be useful oxidative stress markers at early stage because antioxidants protect the oxidation of lipids, proteins, and DNA. In other words, decrease of antioxidants should be a good marker of early
oxidative stress. There is an interesting report by Yamamoto et al. showing which is the most sensitive plasma antioxidants against oxidative stress.(12) Figure 8 shows that vitamin C (VC) decreased first and followed by the reduced form of coenzyme Q10 (CoQ10H2). However, no significant decay in vitamin E (VE) was seen. Furthermore a significant increase in CE-OOH was observed after the depletion of VC and CoQ10H2. The above results indicate that VC and CoQ10H2 should be a useful marker of oxidative stress at early stage. However metabolism of VC is rapid and VC is influenced by
meals. On the other hand, coenzyme Q10 is present in the reduced form (CoQ10H2) and the oxidized form (CoQ10) (Fig. 9) and CoQ10H2 was converted to CoQ10
quantitatively in plasma oxidation (Fig. 8), the redox balance of coenzyme Q10 would be a sensitive marker of early oxidative stress.
Fig. 8!Change in plasma antioxidant levels during the aerobic oxidation of
! human plasma in the presence of 5 μM cupric chloride at 37 ℃.
Fig. 9!Chemical structures of reduced and oxidized forms of coenzyme Q10.
from ref.[12], Yamamoto Y et al. (1991).
Plasma Mareker of Oxidative Stress
! Percentage of CoQ10 in total coenzyme Q10 (%CoQ10) would be a good
oxidative stress marker. Yamashita and Yamamoto developed the HPLC method for the simultaneous detection of plasma CoQ10H2 and CoQ10 by an electrochemical detector.
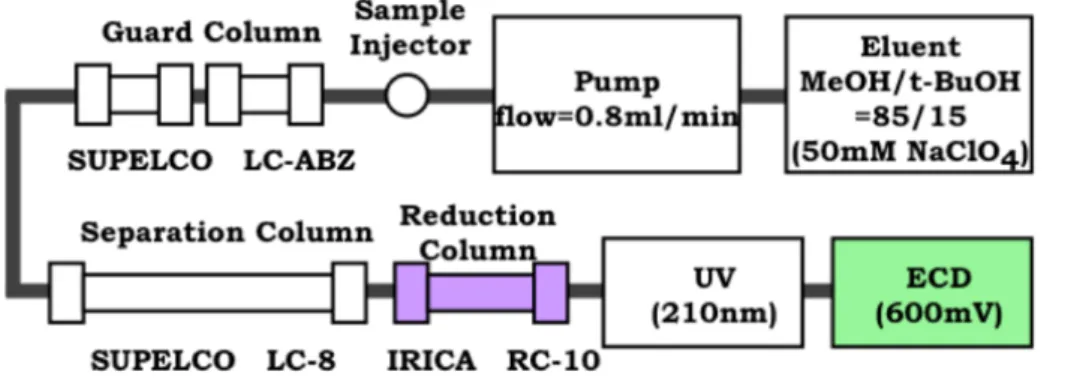
(13) CoQ10 was reduced to CoQ10H2 after the HPLC separation by a reduction column as shown in Fig. 10.(13) Introduction of column switching system makes the method more practical and reliable (unpublished data). The method was applied to various subjects and an increase of oxidative stress was observed in patients with hepatitis, cirrhosis, and hepatoma,(14) juvenile fibromyalgia (JFM),(15) and PD.(16) Table 1 summarizes the representative results.
7
from ref.[13], Yamashita S et al. (1997).
Fig. 10 Schematic diagrams of HPLC system for simultaneous detection of CoQ10H2 and CoQ10.
Table 1 Change in plasma markers of oxidative stress and cellular oxidative damage in patients
! with various diseases as compared to healthy controls and humans or rats under
! oxidative stress conditions. Ref means reference, in prep means manuscript in preparation.
Plasma Marker of Tissue Oxidative Damage
! As discussed above, %CoQ10 is useful for evaluating the formation of oxygen radicals in blood plasma, but it would be more practical to have a plasma marker of tissue oxidative damage. We focused on plasma total free fatty acids (FFAs) because the activities of phospholipase A2 and A1 increase under oxidative stress(3) and the resulting FFAs may enter the bloodstream through leakage or lysis of oxidatively damaged tissues. If this were indeed the case, we would expect an increase in plasma FFA concentration and a decrease in polyunsaturated fatty acids (PUFAs) such as linoleic acid (18:2), linolenic acid (18:3), arachidonic acid (20:4) and docosahexaenoic acid (22:6) in the blood plasma(17) since they are highly susceptible to oxidation. The oxidative loss of PUFAs should be compensated by an increase in monoenoic acids such as palmitoleic acid (16:1) and oleic acid (18:1) due to the action of stearoyl-CoA desaturase.(18) Such changes in the plasma were observed in rats with carbon
tetrachloride poisoning,(19) in LEC rats which are spontaneous liver injury model,(20) and patients with hepatitis, cirrhosis, and hepatoma.(14)
! Stearoyl-CoA desaturase (SCD) is a membrane-boud enzyme that catalyzes the biosynthesis of monounsaturated fatty acids from saturated acids.(18) Thus, 18:1 and 16:1 are produced frome stearic acid (18:0) and palmitic acid (16:0), respectively. SCD expression is regulated by various factores. Oxidative stress is a general stimulant of SCD activity,(19) since decreased levels of PUFA due to its high susceptibility to oxidation need to be compensated for by an increase in monoenoic acids to maintain membrane fluidity. (18) High SCD activity has been implicated in oxidative stress-related diseases such as diabetes, atherosclerosis, and cancer.(21)
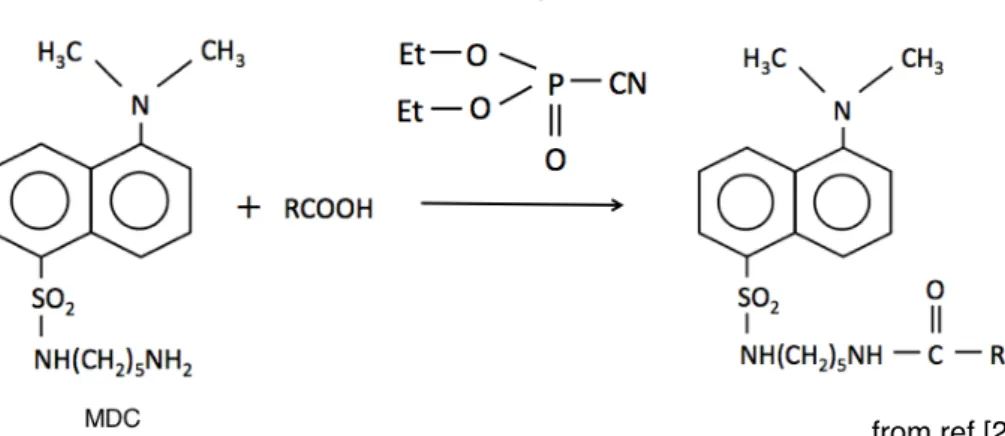
! These results suggest that plasma FFA and their composition are good markers of tissue oxidative damage (Fig. 11). Lee et al. developed a fluorometric derivatization method of carboxylic acid with monodansyl cadaverine for HPLC analysis(Fig. 12).(22) Their method was modified and applied to the plasmas obtained from the rats with a middle cerebral artery occlusion,(23) patients with JFM,(15) and newborn babies.(24) Table 1 summarizes the representative results.
Oxidative Stress Marker in Cerebrospinal Fluid
! Edaravone is a low-molecular-weight antioxidant drug targeting peroxyl radicals among many types of reactive oxygen species. In 2001, Edaravone was approved in Japan as a drug to treat acute-phase cerebral infarction, and then in 2015 it was approved for amyotrophic lateral sclerosis (ALS). In 2017, the U.S. Food and Drug Administration also approved edaravone for treatment of patients with ALS.!
Therefore, oxidative stress in brain has received much attention.
! Mutation in coenzyme Q10 biosynthesis enzyme gene was found in patients with multiple system atrophy (MSA) and brain level of coenzyme Q10 in homozygous patient was very low as compared with those of control subject.(25) Now a phase 2 clinical trial employing a high dose CoQ10H2 for patients with MSA is ongoing.
! In order to discuss oxidative stress in brain, cerebrospinal fluid (CSF) should be a good target. However, the levels of total coenzyme Q10 (TQ10) in human CSF are less than 1/500 of those in human plasma. In this study, we developed a method for the simultaneous electrochemical detection of CoQ10H2 and CoQ10 in CSF.
9
from ref.[22], Lee Y et al. (1989).
Fig 12 Conversion of FFA to a fluorometric derivatives.
FC, mg/g-tissue TQ10, μg/g-tissue
1-2! Coenzyme Q10 as a Antioxidant
Tissue Coenzyme Q10 Levels
! Coenzyme Q10 is an essential component of the mitochondrial electron transport system. CoQ10H2 is one of the most important lipid-soluble antioxidant. Changes in tissue levels of free cholesterol (FC) and coenzyme Q10 was shown in Fig. 13.(26)
Tissue levels decrease in the order of heart, kidney > liver > spleen, pancreas > adrenal
> lung. Tissue levels are the highest at the age of 20’s and decrease with age (Fig. 13).
Contrary, FC levels increase with age. Since biosynthetic pathways of coenzyme Q10 and FC are common, increase in tissue FC level retards the biosynthesis of coenzyme Q10. Figure 14 shows the changes in the levels of coenzyme Q10 in various regions of the huan brain.(27) They decrease with age and their drops are apparent after age 70.
More than 60% decline in hippocampus should be very serious since it controls our memory.
heart
kidney
liver
spleen
pancreas
paranephros
lung
Fig. 13!Changes in human tissue levels of FC and coenzyme Q10 with age.
from ref.[26], Kalén A et al. (1989).
FC, mg/g-tissue TQ10, μg/g-tissue
Coenzyme Q10 binding/transfer Protein
! Since coenzyme Q10 is not soluble in water, it is located in lipoproteins in blood.
Moreover, coenzyme Q10 binding/transfer proteins were identified as saposin B and its precursor prosaposin (Psap).(28) Psap is the precursor protein for saposins A, B, C, and D. These glycoproteins were isolated as activators of sphingolipids hydrolytic enzymes in lysosome. Psap also exists as a secreted protein, which has been found in various bodily fluids such as milk, serum, seminal plasma, and cerebrospinal fluid. Despite a lot of previous works, many physiological functions of Psap have not been elucidated to date. In this study, we measured Psap in human plasma and discussed the role of Psap under oxidative stress.
1-3! The Objective of This Study
! Since useful methods for the evaluation of oxidative stress in circulation (plasma
%CoQ10) and tissue oxidative damage (plasma FFA and their composition), I applied these methods to human subjects under oxidative stress such as patients with post- cardiac arrest syndrome (PCAS) and ALS, and centenarians. Water-soluble
antioxidants such as VC and uric acid, Psap, FC, and CE were also measured.
Taken all data, we discussed the characteristic of the diseases and aging.
For the future study, we also developed a method for simultaneous electrochemical detection of CoQ10H2 and CoQ10 in CSF.
11
from ref.[27], Sëderberg M et al. (1990).
Fig. 14!Changes in coenzyme Q10 levels at various regions in human brain with age.
References
1. ! Sies H. Oxidative stress: introductory remarks. IN: Sies H, ed. Oxidative Stress, London: Academic Press, 1985; 1-8.
2.! Halliwell B, Gutteridge JMC. Free Radicals in Biology and Medicine. 5 ed. Oxford:
Oxford University Press, 2015.
3.! Yamamoto Y. Plasma marker of tissue oxidative damage and edaravone as a scavenger drug against peroxyl radicals and peroxynitrite. J Clin Biochem Nutr, 2017; 60: 49-54.
4.! Kasai H, Hayami H, Yamaizumi Z, Saito H, Nishimura S. Detection and identificationof mutagens and carcinogens as their adducts with guanosine derivatives. Nucleic Acids Research 1984; 12: 2127-2136.
5.! Sato S, Mizuno Y, Hattori N. Urinary 8-hydroxydeoxyguanosine levels as a biomarker for progression of Parkinson disease. Neurology 2015; 64: 1081-1083.
6.! Hayakawa M, Torii K, Sugiyama S, Tanaka M, Ozawa T. Age-associated accumulation of 8-hydroxydeoxyguanosine in mitochondrial DNA of human diaphragm. Biochem Biophys Res Commun, 1991; 179: 1023-1029.
7.! Stéphanie M, Jean-Lue C, Thierry D, Olivier C, Janine B, Alexandre G, Francoise SL, Jean-Claude R, Germain B. THe 5-series F2-isoprostanes possess no
vasomotor effects in the rat thoracic aorta, the human internal mammary artery and the human saphenous vein. Br J of Pharma 2002; 135: 1276-1280.
8.! Edzard S, Asja B, Henrike L, Dimitrios T, Renke M, Jens B, Frank M. G, Jürgen B, Jürgen C, Rainer H. Urinary 8-iso-Prostaglandin F2α as a risk marker in patients with coronary heart disease a matched case-control study. Circulation 2004; 109:
843-848.
9.! Yamamoto Y, Michael H. Brodsky, Jeffery C. Baker, Bruce N. Ames. Ditection and characterization of lipid hydroperoxides at picomole levels by high-performance liquid chromatography. Anal Biochem 1987; 160: 7-13.
10.! Yamamoto Y, Niki E. Presence of cholesteryl ester hydroperoxide in human blood plasma. Biochem Biophys Res Commun, 1989; 165: 988-993.
11.! Yamamoto Y, Wakabayashi K, Niki E, Nagao M. Comparison of plasma levels of lipid hydroperoxides and antioxidants in hyperlipidemic Nagase analbuminemic rats, Sprague-Dawley rats, and human. Biochem Biophys Res Commun 1992;
189: 518-523.
12.! Yamamoto Y, Kawamura M, Tatsuno K et al. Formation of lipid hydroperoxides in the cupric ion-induced oxidation of plasma and low density lipoprotein. IN: Davies KJA, ed. Oxidative Damage and Repair, New York: Pergamon Press, 1991;
287-291.
13.! Yamashita S, Yamamoto Y. Simultaneous detection of ubiquinol and ubiquione in human plasma as a marker of oxidative stress. Anal Biochem 1997; 250: 66-73.
14.! Yamamoto Y, Yamashita S, Fujisawa A. Oxidative stress in patients with Hepatitis, Cirrhosis and Hepatoma evaluated by plasma antioxidants. Biochem Biophys Res Commun 1998; 247: 166-170.
15.! Miyamae T, Seki M, Naga T, Uchino S, Asazuma H, Kikuchi M, Imagawa T, Natsumeda Y, Yokota S, Yamamoto Y, et al. Increased oxidative stress and coenzyme Q10 deficiency in juvenile fibromyalgia: amelioration of
hypercholesterolemia and fatigue by ubiquinol-10 supplementation. Redox Report 2013; 18: 12-19.
16.! Sohmiya M, Tanaka M, Nyou Wei Tak, Yanagisawa M, Tanino Y, Suzuki Y, Okamoto K, Yamamoto Y. Redox status of plasma coenzyme Q10 indicates elevated systemic oxidative stress in Parkinson’s disease. Neurological Sciences 2004; 223: 161-166.
17.! Gutteridge JMC, Quinlan Gj, Yamamoto Y. Are fatty acid patterns characteristic of essential fatty acid deficiency indicative of oxidative stress? Free Radic Res 1998;
28: 109-114.
18.! Ntambi JM. Regulation of stearoyl-CoA desaturase by polyunsaturated fatty acids and cholesterol. J Lipid Res 1999; 40: 1549-1558.
19.! Yamamoto Y, Nagata Y, Katsurada M, Sato S, Ohori Y. Changes in rat plasma-free fatty acid composition under oxidative stress induced by carbon tetrachloride:
decrease of polyunsaturated fatty acids and increase of palmitoleic acid. Redox Report 1996; 2: 121-125.
20.! Yamamoto Y, Sone H, Yamashita S, Nagata Y, Niikawa H, Hara K, Nagao M.
Oxidative stress in LEC rats evaluated by plasma antioxidants and free fatty acids.
J Trace Elem Exp Med 1997; 10: 129-134.
21.! Ntambi M, Miyazaki M, Dobrzyn A. Regulation of stearoyl-CoA desaturase expression. Lipids 2004; 39: 1061-1065.
22.! Yong-Moon Lee, Nakamura H, Nakajima T. Fluorometric determination of
carboxylic acids by High Performance Liquid Chromatography after derivatization with Monodansyl cadaverine. Analy Sci 1989; 5: 681-685.
23.! Yamamoto Y, Yanagisawa M, Tak NW, Watanabe K, Takahashi C, Fujisawa A, Kashiba M, Tanaka M. Repeated edaravone treatment reduces oxidative cell damage in rat induced by middle cerebral artery occlusion. Redox Report 2009;
14: 251-258.
24.! Hara K, Yamashita S, Fujisawa A, Ishiwa S, Ogawa T, Yamamoto Y. Oxidative stress in newborn infants with and without asphyxia as measured by plasma antioxidants and free fatty acids. Biochem Biophys Res Commun 1999; 257:
244-248.
25.! The multiple-system atrophy research collaboration. Mutations in COQ2 in familial and sporadic multiple system atrophy. N Engl J Med, 2013; 369: 233-244.
13
26.! Kalén A, Appelkvist EL, Dallner G. Age-related changes in the lipid compositions of rat and human tissues. Lipids 1989; 24: 579-584.
27.! Sëderberg M, Edlund C, Kristensson K et al. Lipid compositions of differnt regions of the human brain during aging. J Neurochem 1990; 54: 415-423.
28.! GuangZhi J, Kubo H, Kashiba M, Horinouchi R, Hasegawa M, Oizumi M, Fujisawa A, Tsukamoto H, Yoshimura S, Yamamoto Y. Saposine B is a human Coenzyme Q10-binding/transfer protein. J Clin Biochem Nutr 2008; 42: 167-174.
Chapter 2
Oxidative Stress and Abnorma Cholesterol Metabolism in Patients with Post-cardiac Arrest Syndrome
15
Introduction
! Ischemia/reperfusion is an important trigger of reactive oxygen species (ROS) formation.(1-3) As direct evidence, Maekawa et al. observed the continuous formation of superoxides in the rat jugular vein after forebrain ischemia and subsequent reperfusion promoted its production.(4,5) Newborn babies suffer from whole body ischemia/reperfusion injury since their oxygen tensions change from 2-8% to 21%
at birth.(6) We previously demonstrated a significant increase in oxidative stress by measuring plasma antioxidants at 0, 1, 3, and 5 days after birth.(7) Plasma levels of the most sensitive antioxidant, ascorbic acid, decreased daily to equilibrium values at 3 and 5 days.(7) Percentages of the oxidized form of coenzyme Q10 (%CoQ10) in total coenzyme Q10, another blood marker of oxidative stress, in infants (25-31%) were significantly higher than those in healthy young adults (4.5%).(7) We also measured plasma free fatty acids (FFA) and their composition as markers of tissue oxidative damage.(7) FFA levels were highest at day 1 and decreased rapidly
thereafter, whereas the content of oxidatively vulnerable polyunsaturated fatty acids (%PUFA) in total FFA was lowest at day 1 and then increased.(7)
! Patients with post-cardiac arrest syndrome (PCAS) also suffer from whole body ischemia/reperfusion. Therefore, their oxidative stress is likely severe.
However, few papers describe a decrease of antioxidants and an increase of oxidation products from lipids and proteins. In this paper, we evaluated oxidative stress
in patients with PCAS by measuring plasma markers of oxidative stress in the circulation (antioxidants) and tissues (FFA and their composition).
We also measured plasma levels of free cholesterol (FC) and cholesterol esters (CE).
Their time course changes (0, 6, and 24 hrs, and 2 and 7 days after hospitalization) were compared among 6 groups of patients divided according to outcome severity as follows: died within a day; died within a week; died within a month; hospitalized for more than 2 weeks; hospitalized for less than 2 weeks; and discharged in a week. We will discuss important factors determining the survival of patients.
! The survival rate to hospital discharge from PCAS in Japan was only 7.9% in 2014.(3) To increase the survival rate, we treated about 70% of patients with
therapeutic hypothermia (TH). Surprisingly, TH treatment enhanced the increase in plasma ratio of total coenzyme Q10 (TQ10) to total cholesterol (TC) at the end of rewarming. This implies that coenzyme Q10 was introduced to blood circulation by a lipoprotein-independent pathway not previously discussed.
Subjects and Methods
Study design
! The present study was carried out in the Division of Emergency and Critical Care Medicine, Department of Acute Medicine, Nihon University School of Medicine during the period from 29 November 2005 to 4 August 2015. The study protocols were approved by the Ethical Committee of Nihon University School of Medicine, and patient samples were obtained in accordance with the Helsinki Declaration of 1964, as revised in 2001. Forty subjects (27 males aged 66.0 ± 15.8 years (mean ± SD) and 13 females aged 63.4 ± 20.8 years) were enrolled. The causes of PCAS were acute myocardial infarction (number of patients =10), ventricular fibrillation (5), suffocation (5), congestive heart failure (2), hyperkalemia (2), complete
atrioventricular block (1), sick sinus syndrome (1), coronary spastic angina (1),
chronic obstructive pulmonary disease (1), diffuse interstitial fibrosing pneumonia (1), pulmonary embolism (1), necrotizing fasciitis (1), sepsis (1), acute pancreatitis (1), diabetic ketoacidosis (1), gastric ulcer bleeding (1), subarachnoid hemorrhage (1), double outlet right ventricle (1), and unknown (3).
! Patients were treated with conventional resuscitation methods and, if possible, TH treatment (34°C for 24 hr and gradual rewarming to 36°C for 24 hr) was
introduced. In 32 of 40 cases, TH treatment was applied; however, in 5 cases
treatment was not completed because of unstable blood pressure (4 cases) and low temperature caused by infection (1 case) (Table 1). TH treatment was not applied to 8 cases.
! Heparinized plasma was collected when patients were hospitalized and at 6 and 24 hrs, and 2 and 7 days, and stored at -80°C until analysis.
17
Table 1! Outcomes of the 40 PCAS patients and therapeutic hypothermia treatment.
Analytical procedure
! Plasma levels of vitamin E (VE), ubiquinol-10, ubiquinone-10, FC, and CE were determined as previously described(8) with some modifications. In brief, plasma was extracted with 19 volumes of 2-propanol and the extract was analyzed by HPLC using an analytical column (Supelcosil LC-8, 5 µm, 25 cm x 4.6 mm i.d.; Supelco Japan, Tokyo, Japan), a reduction column (RC-10-1; Irica, Kyoto, Japan) and an amperometric electrochemical detector (Model Σ985; Irica) with an oxidation potential of +600 mV (vs. Ag/AgCl) on a glass carbon electrode. The mobile phase consisted of 50 mM sodium perchlorate in methanol/2-propanol (9/1, v/v), delivered at a flow rate of 0.8 ml/min.
! Plasma levels of ascorbic acid (VC), uric acid (UA) and unconjugated bilirubin (BR) were determined by HPLC on a bonded-phase aminopropylsilyl column
(Supelcosil LC-NH2, 5 µm, 25 cm x 4.6 mm i.d.; Supelco Japan) with UV/VIS
detection (265 nm for 0-15 min and 460 nm for 15-22 min) as described previously.(9)
! Plasma FFA were derivatized with monodansylcadaverine for analysis by HPLC.(10) Briefly, plasma samples (50 µl) were mixed with 200 µl of methanol and then centrifuged at 13,000 x g for 5 min. Aliquots (50 µl) of supernatants were mixed with 20 µl of methanol containing 25 µM tridecanoic acid (internal standard) and dried under a stream of nitrogen gas, and the residue was admixed with diethyl
phosphorocyanidate (1 µl) and N,N-dimethylformamide (50 µl) containing
monodansylcadaverine (2 mg/ml) and kept at room temperature in the dark for 20 min. A 5-µl sample was injected onto an octadecylsilyl column (3 µm, 3.3 cm x 4.6 mm i.d.; Supelco Japan) and a pKb-100 column (5 µm, 25 cm x 4.6 mm i.d.; Supelco Japan) connected in tandem. The FFA components were measured by fluorescence detection (Model 821-FP; Japan Spectroscopic, Tokyo, Japan) with excitation at 320 nm and emission at 520 nm. The mobile phase consisted of acetonitrile/methanol/
water (17.5/65.0/17.5, v/v/v) delivered at a flow rate of 1.5 ml/min. The analytical columns were heated to 40°C.
! Plasma levels of prosaposin (Psap), a coenzyme Q10 binding and transfer protein, were measured by a sandwich ELISA using monoclonal and polyclonal antibodies against human saposin B.(11) Plasma was diluted 100 times with a
phosphate-buffer saline containing 0.1% Triton X-100, 1 g/L NaN3, 10 g/L BSA, and 1 mM EDTA. Purified saposin B was used as a standard.(11)
Statistical analysis
! Data presented are mean values and standard deviations. Statistical analysis was performed with a paired Student's t-test for two comparisons and one-way repeated measures ANOVA followed by the Tukey–Kramer multiple comparisons test. p < 0.05 was considered statistically significant.
Results and Discussion
Oxidative stress in PCAS patients
Table 2 shows plasma levels of antioxidants and lipids in PCAS patients at the time of hospitalization and those in age-matched healthy controls. A significant
increase in %CoQ10 was observed in PCAS patients compared to healthy controls, indicating that the redox balance of coenzyme Q10 shifted to the oxidized form, confirming increased oxidative stress in the blood of PCAS patients. A significant increase in plasma FFA levels suggests that considerable tissue damage occurred in PCAS patients. This damage is likely oxidative because a significant decrease in
%PUFA was observed. Tissue damage results in the decomposition of DNA and the conversion of purines to UA. This is consistent with the observed significant increase in plasma UA. In contrast, plasma levels of VC, VE, and TQ10 in PCAS patients were similar to healthy controls. The significant decrease in BR is notable, since
decreased BR is recognized as a risk factor for coronary artery disease.(12-13)
It is noteworthy that infants also exhibited high %CoQ10 (25-31%) at birth.(7) Plasma FFA level were the highest at day 1, decreasing thereafter.(7) Whereas, plasma %PUFA were the lowest at day 1 and then increased,(7) and plasma levels of UA were the highest at day 1.(7) The similarity in data between patients with PCAS and newborns is reasonable, since both are exposed to ischemia/reperfusioninduced oxidative stress.
Plasma levels of FC, CE, and TC were significantly lower than those in
agematched healthy controls. Moreover, the FC/CE ratio was significantly greater than that in controls, indicating decreased activity of lecithin-cholesterol acyltransferase (LCAT), which catalyzes the conversion of FC to CE.(14,15) Since LCAT is secreted from the liver, an increased FC/CE ratio suggests impairment of liver function.(14,15)
19
Time course changes in plasma antioxidants and cholesterol
! Next, we examined time course (0-7 days after hospitalization) changes in plasma antioxidants and lipids as shown in Figs. 1-9. Patients with PCAS were divided into 6 groups according to outcome severity as follows: died within a day (6 cases); died within a week (6); died within a month (4); hospitalized for more than 2 weeks (11); hospitalized for less than 2 weeks (10); and discharged in a week (3).
We expect that comparisons among these 6 groups could reveal important factors in determining the survival of patients.
Figure 1 shows the time course changes of the oxidative stress marker
%CoQ10 in the circulation. %CoQ10 values increased with time in patients who went on to die. In contrast, %CoQ10 values decreased in patients who were discharged within one or two weeks. These results clearly show that control of oxidative stress in blood circulation is important for patient survival.
Figures 2 and 3 show the time course changes in lipid-soluble antioxidants, TQ10 and VE, respectively. Surprisingly, more than 50% of TQ10 and VE levels were lost over 6 hr in patients who died within a day. However, these declines may not be associated with oxidative stress, since ~50% of TC also disappeared in 6 hr (Fig. 4).
Lipoprotein secretion from the liver and other organs was obviously impaired in patients who died within a day.
Table 2! Levels of plasma antioxidants and lipids in patients with PCAS at the time of hospitalization as compared to age-matched healthy controls (average ± SD).
p values were determined using a Student’s t-test. VC, ascorbic acid; UA, uric acid; BR, unconjugated bilirubin; VE, vitamin E; TQ10, total coenzyme Q10;
%CoQ10, ratio of oxidized form of coenzyme Q10 to TQ10; FFA, free fatty acids; %PUFA, ratio of polyunsaturated fatty acids to total free fatty acids;
! ! %16:1, ratio of palmitoleic acid to total FFA; %18:1, ratio of oleic acid to total FFA; FC, free cholesterol; CE, cholesterol esters; TC, total cholesterol.
In contrast, plasma levels of TC, TQ10, and VE in patients who were discharged in a week remained constant and within normal ranges (Figs. 2-4).
21
Fig. 1! !Time course of changes in the percentage of the oxidized form of coenzyme Q10 in TQ10 (%CoQ10) after hospitalization. Patients were divided into six groups according to outcome. Average %CoQ10 in age-matched healthy controls was 3.9 ± 1.3 (± SD, n=55); this range is shaded in green.
Fig. 2! !Time course of changes in plasma total coenzyme Q10 (TQ10) after hospitalization.
Patients were divided into six groups according to outcome. The average TQ10 level in age-matched healthy controls was 710 ± 206 µM (± SD, n=55); this range is shaded in green. # p < 0.05, significant differences compared to values at 0 hr as determined by a paired Student’s t-test.
Fig. 3! ! Time course of changes in plasma vitamin E (VE) after hospitalization.
Patients were divided into six groups according to outcome. The average VE level in age-matched healthy controls was 28.5 ± 7.3 µM (± SD, n=55);
! this range is shaded in green. # p < 0.05, significant differences compared to values at 0 hr as determined by a paired Student’s t-test. p values are
indicated when one-way repeated ANOVA analysis was significant.
Fig. 4! ! Time course of changes in plasma total cholesterol (TC) after hospitalization.
Patients were divided into six groups according to outcome. The average TC level in age-matched healthy controls was 4.72 ± 0.94 mM(± SD, n=55); this range is shaded in green. # p < 0.05, significant differences compared to values at 0 hr as determined by a paired a Student’s t-test. p values are indicated when one-way repeated ANOVA analysis was significant.
! * p < 0.05, significant differences compared to values at 0 hr as determined by the Tukey–Kramer multiple comparisons test.
! Figures 5 and 6 show the time course changes in plasma CE and FC,
respectively. It is apparent that the declines of CE were more profound than those of FC. This can be seen more easily in the FC/CE ratios shown in Fig. 7. The FC/CE ratios remained constant and within a normal range in PCAS patients who were discharged in a week. On the other hand, the FC/CE ratios were extremely high in PCAS patients who died within a day. This ratio increased with time in PCAS patients who died and those hospitalized for more than 2 weeks. Since the FC/CE ratio is determined by LCAT activity, which converts FC to CE, and LCAT is secreted with HDL from the liver, a high FC/CE ratio indicates some impairment of liver function.
Supplementation with coenzyme Q10 could be one approach to preserve liver function, since improved FC/CE ratios were observed in patients with fibromyalgia upon supplementation.(16)
23
Fig. 5! ! Time course of changes in plasma cholesterol esters (CE) after hospitalization.
Patients were divided into six groups according to outcome. The average CE level in age-matched healthy controls was 3.36 ± 0.72 mM (± SD, n=55); this range is shaded in green. # p < 0.05, significant differences compared to values at 0 hr as determined by a paired Student’s t-test. p values are indicated when one-way repeated ANOVA analysis was significant.
! * p < 0.05, significant differences compared to values at 0 hr as determined by the Tukey–Kramer multiple comparisons test.
Fig. 6! ! Time course of changes in plasma free cholesterol (FC) after hospitalization.
Patients were divided into six groups according to outcome. The average FC level in age-matched healthy controls was 1.37 ± 0.25 mM (± SD, n=55); this range is shaded in green. # p < 0.05, significant differences compared to values at 0 hr as determined by a paired Student’s t-test. p values are
indicated when one-way repeated ANOVA analysis was significant. * p < 0.05, significant differences compared to values at 0 hr as determined by the
Tukey–Kramer multiple comparisons test.
Fig. 7! !Time course of changes in plasma ratio of free cholesterol to cholesterol esters (FC/CE) after hospitalization. Patients were divided into six groups according to outcome. The average FC/CE ratio in age-matched healthy controls was 0.41 ± 0.05 (± SD, n=55); this range is shaded in green. # p < 0.05, significant
differences compared to values at 0 hr as determined by a paired Student’s
! ! t-test. p values are shown when one-way repeated ANOVA analysis was significant. * p < 0.05, significant differences compared to values at 0 hr as determined by the Tukey–Kramer multiple comparisons test.
! Figures 8 and 9 show the time course changes in water-soluble antioxidants, VC and UA, respectively. Plasma levels of VC can be increased when many tissue cells are disrupted, because tissue cells contain mM levels of VC while plasma contains levels of ~30 μM. Such increases in VC levels were observed at 48 hr in PCAS patients who died within a week (Fig. 8). It is reasonable that UA levels also increased at this point, because tissue disruption results in the conversion of purines to UA (Fig. 9). However, a significant decrease in UA was observed in PCAS patients who were hospitalized for more than a week (Fig. 9). This may due to the formation of peroxynitrite since UA is a specific inhibitor of peroxynitrite.(17,18)
25
Fig. 8! ! Time course of changes in plasma ascorbic acid (VC) after hospitalization.
Patients were divided into six groups according to outcome. The average VC level in age-matched healthy controls was 31.1 ± 21.0 µM (± SD, n=55); this range is shaded in green. p values are shown when one-way repeated ANOVA analysis was significant. * p < 0.05, significant differences compared to values at 0 hr as determined by the Tukey–Kramer multiple comparisons test.
! We have employed plasma FFA and the content of oxidatively vulnerable PUFA in total FFA as markers of tissue oxidative damage.(15) It is common that stearoyl-CoA desaturase is activated to compensate for the loss of PUFA; therefore, the percentages of palmitoleic acid and oleic acid in total FFA (%16:1 and %18:1, respectively) are also appropriate markers of tissue oxidative damage.(15) Figure 10 shows the time course changes in FFA, %PUFA, %16:1 and %18:1. Here, we divided patients into 3 groups: those who died within a day (6 cases), died within a month (10), and survived (26). No significant changes were observed in patients who survived. In contrast, %PUFA decreased, and %16:1 and %18:1 increased with time in patients who died within a month, indicating ongoing tissue oxidative damage in these patients. However, all parameters significantly decreased at 6 hr in patients who died within a day, suggesting that the above lipid preserving reactions had ceased in those patients.
Fig. 9! ! Time course of changes in plasma uric acid (UA) after hospitalization.
Patients were divided into six groups according to outcome. The average UA level in age-matched healthy controls was 317 ± 86 µM (±
SD, n=55); this range is shaded in green. # p < 0.05, significant differences compared to values at 0 hr as determined by a paired Student’s t-test. p values are shown when one-way repeated ANOVA analysis was significant. * p < 0.05, significant differences compared to values at 0 hr as determined by the Tukey–Kramer multiple
comparisons test.
Effect of therapeutic hypothermia (TH) treatment
! The efficacy of TH treatment against PCAS is generally acknowledged in Japan.(20,21) TH treatment is employed to reduce the formation of oxygen radicals.
Infact, TH treatment decreased superoxide formation in an animal model of
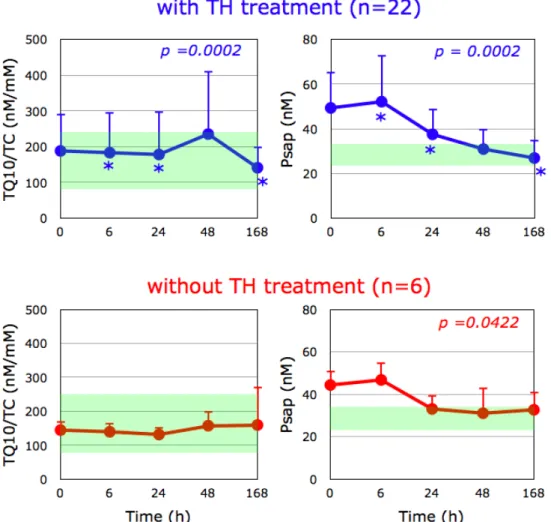
ischemia/reperfusion injury.(22) Moreover, we observed that TH treatment induced a significant increase in plasma TQ10/TC at the end of rewarming (48 hr) compared to the 24 hr values and this ratio was significantly decreased at day 7 (Fig. 11). This was not the case in the absence of TH treatment (Fig. 11). Since the ratios of TQ10/TC were increased, this indicates that the increment is not lipoprotein-dependent.
Thus, we focused on the levels of Psap as a coenzyme Q10 binding and transfer protein(11,23,24) in plasma.
27
Fig. 10!Time course of changes in plasma free fatty acids (FFA), the percentage of polyunsaturated fatty acids in total FFA (%PUFA), the percentage of
palmitoleic acid in total FFA (%16:1), and the percentage of oleic acid in total FFA (%18:1) after hospitalization. Patients were divided into three groups according to outcome. The average FFA level, %PFA, %16:1, and %18:1 in age-matched healthy controls were 457 ± 288 µM, 23.6 ± 4.6, 3.9 ± 1.4, and 34.4 ± 5.1, respectively (± SD, n=55); these ranges are shaded in green. # p
< 0.05 and ### p < 0.001, significant differences compared to values at 0 hr as determined by a paired Student’s t-test.
! Psap is a multifunctional glycoprotein present in all organs as the lysosomal precursor of four small sphingolipid activator proteins, known as saposin A, B, C, and D, and also exists as a secreted protein, which has been found in various bodily fluids such as serum, milk, and seminal fluid.(25,26) Notably, plasma levels of Psap in PCAS patients at the time of hospitalization were 47.3 ± 15.1 (± SD, n=36),
significantly higher than in age-matched healthy controls (27.2 ± 5.8, n=80) (p <
0.001). Since plasma Psap levels decreased with time (Fig. 11), the elevation of Psap levels preceded the alterations in TQ10/TC ratio. Although the detailed mechanism requires further study, it is of interest that the human body appears to require coenzyme Q10 under critical conditions such as PCAS.
Fig. 11 Time course of changes in ratio of plasma total coenzyme Q10 to total cholesterol (TQ10/TC) and plasma prosaposin (Psap) after hospitalization. Patients were divided into groups with (n=22) and without (n=6) therapeutic hypothermia (TH) treatment. The average Psap level and TQ10/TC ratio in age-matched healthy controls were 27.2 ± 5.8 nM (± SD, n=80) and 180 ± 86 nM/mM (± SD, n=55), respectively; these ranges are shaded in green. p values are shown when one-way repeated ANOVA analysis was significant. * p < 0.05, significant differences
compared to values at 48 hr as determined by the Tukey–Kramer multiple comparisons test.
Conclusion
! In summary, increased oxidative stress was confirmed in PCAS patients at the time of hospitalization by the significant increases in plasma %CoQ10 and FFA, and the significant decrease in %PUFA. Impairment of liver function was suggested by an
increase in FC/CE ratio. A time course study revealed that this ratio is one of the key factors in determining the survival of patients. TH treatment enhanced increases in the plasma ratio of TQ10 to TC at the end of rewarming via a lipoprotein-independent pathway.
29
References
1.! Warner DS, Sheng H, Batinic-Haberle I. Oxidants, antioxidants and the ischemic brain. J Exp Biol 2004; 207: 3221-31.
2! Bagheri F, Khori V, Alizadeh AM, Khalighfard S, Khodayari S, Khodayari H.
Reactive oxygen species-mediated cardiac-reperfusion injury: Mechanisms and therapies. Life Sci 2016; 165: 43-55.
3.! Uchino H, Ogihara Y, Fukui H, Chijiiwa M, Sekine S, Hara N, Elmer E. Brain injury following cardiac arrest: pathophysiology for neurocritical care. J Intensive Care 2016; 4: 31. DOI 10.1186/s40560-016-0140-9
4.! Aki HS, Fujita M, Yamashita S, Fujimoto K, Kumagai K, Tsuruta R, Kasaoka S, Aoki T, Nanba M, Murata H, et al. Elevation of jugular venous superoxide anion radical is associated with early inflammation, oxidative stress, and endothelial injury in forebrain ischemia-reperfusion rats. Brain Res 2009; 1292: 180-90.
5.! Ono T, Tsuruta R, Fujita M, Aki HS, Kutsuna S, Kawamura Y, Wakatsuki J, Aoki T, Kobayashi C, Kasaoka S, et al. Xanthine oxidase is one of the major sources of superoxide anion radicals in blood after reperfusion in rats with forebrain ischemia/
reperfusion. Brain Res 2009; 1305: 158-67.!
6.! Fischer B, Bavister BD. Oxygen tension in the oviduct and uterus of rhesus monkeys, hamsters and rabbits. J Reprod Fertil 1993; 99: 673-9.
7.! Hara K, Yamashita S, Fujisawa A, Ishiwa S, Ogawa T, Yamamoto Y. Oxidative stress in newborn infants with and without asphyxia as measured by plasma antioxidants and free fatty acids. Biochem Biophys Res Commun 1999; 257:
244-8.
8.! Yamashita S, Yamamoto Y. Simultaneous detection of ubiquinol and ubiquinone in human plasma as a marker of oxidative stress. Anal Biochem 1997; 250: 66–73.
9.! Yamamoto Y, and Ames BN. Detection of lipid hydroperoxides and hydrogen
peroxide at picomole levels by an HPLC and isoluminol chemiluminescence assay.
Free Radic Biol Med 1987; 3: 359-61.
10.! Yamamoto Y NY, Katsurada M, Sato S, Ohori Y. Changes in rat plasma free fatty acids composition under oxidative stress induced by carbon tetrachloride:
Decrease of polyunsaturated fatty acids and increase of palmitoleic acid. Redox Rep. 1996; 2: 121-5.
11.! Jin G, Kubo H, Kashiba M, Horinouchi R, Hasegawa M, Suzuki M, Sagawa T, Oizumi M, Fujisawa A, Tsukamoto H, et al. Saposin B is a human coenzyme Q10- binding/transfer protein. J Clin Biochem Nutr 2008; 42: 167-74.
12.! Niklowitz P, Onur S, Fischer A, Laudes M, Palussen M, Menke T, Döring F.
Coenzyme Q10 serum concentration and redox status in European adults:
influence of age, sex, and lipoprotein concentration. J Clin Biochem Nutr 2016; 58:
240-5.
13.! Schwertner HA, Jackson WG, Tolan G. Association of low serum concentration of bilirubin with increased risk of coronary artery disease. Clinical Chem 1994; 40:
18-23.
14.! Kunutsor SK, Bakker SJ, Gansevoort RT, Chowdhury R, Dullaart RP. Circulating total bilirubin and risk of incident cardiovascular disease in the general population.
Arterioscler Thromb Vasc Biol 2015; 35: 716-24.
15.! Florén CH, Chen CH, Franzén J, Albers JJ. Lecithin: cholesterol acyltransferase in liver disease. Scand J Clin Lab Invest 1987; 47: 613–7.
16. ! Yamamoto Y, Yamashita S, Fujisawa A, Kokura S, YoshikawaT. Oxidative stress in patients with hepatitis, cirrhosis, and hepatoma evaluated by plasma antioxidants.
Biochem Biophys Res Commun 1998; 247: 166–70.
17.! Miyamae T, Seki M, Naga T, Uchino S, Asazuma H, Yoshida T, Iizuka Y, Kikuchi M, Imagawa T, Natsumeda Y, et al. Increased oxidative stress and coenzyme Q10 deficiency in juvenile fibromyalgia: amelioration of hypercholesterolemia and fatigue by ubiquinol-10 supplementation. Redox Rep 2013; 18: 12-9.
18.! Pacher P, Beckman JS, Liaudet L. Nitric oxide and peroxynitrite in health and disease. Physiol Rev 2007; 87: 315–424.
19.! Nagase M, Yamamoto Y, Miyazaki Y, Yoshino H. Increased oxidative stress in patients with amyotrophic lateral sclerosis and the effect of edaravone
administration. Redox Rep 2016; 21: 104–112.
20.! Yamamoto Y. Plasma marker of tissue oxidative damage and edaravone as a scavenger drug against peroxyl radicals and peroxynitrite. J Clin Biochem Nutr 2017; 60: 49-54.
21.! Komatsu T, Kinoshita K, Sakurai A, Moriya T, Yamaguchi J, Sugita A, Kogawa R, Tanjoh K. Shorter time until return of spontaneous circulation is the only
independent factor for a good neurological outcome in patients with postcardiac arrest syndrome. Emerg Med J 2014; 31: 549-55.
22.! Kaneko T, Kasaoka S, Nakahara T, Sawano H, Tahara Y, Hase M, Nishioka K, Shirai S, Hazui H, Arimoto H, et al. Effectiveness of lower target temperature therapeutic hypothermia in post-cardiac arrest syndrome patients with a resuscitation interval of ≤ 30 min. J Intensive Care 2015; 3: 28.!
23.! Koda Y, Tsuruta R, Fujita M, Miyauchi T, Kaneda K, Todani M, Aoki T, Shitara M, Izumi T, Kasaoka S, et al. Moderate hypothermia suppresses jugular venous superoxide anion radical, oxidative stress, early inflammation, and endothelial injury in forebrain ischemia/reperfusion rats. Brain Res 2010; 1311: 197-205.
24.! Kashiba M, Oizumi M, Suzuki M, Sawamura Y, Nagashima K, Yoshimura S, Yamamoto Y. Prosaposin regulates coenzyme Q10 levels in HepG2 cells, especially those in mitochondria. J Clin Biochem Nutr 2014; 55: 85-9.
31
25.! Kashiba M, Terashima M, Sagawa T, Yoshimura T, Yamamoto Y. Prosaposin knockdown in Caco-2 cells decreases cellular levels of coenzyme Q10 and ATP, and results in the loss of tight junction barriers. J Clin Biochem Nutr 2017; 60:
81-85.
26.! O'Brien JS, Kishimoto Y. Saposin proteins: structure, function, and role in human lysosomal storage disorders. FASEB J 1991; 5: 301-308.
27.! Kishimoto Y, Hiraiwa M, O'Brien JS. Saposins: structure, function, distribution, and molecular genetics. J Lipid Res 1992; 33: 1255-67.
Chapter 3
Increased oxidative stress in patients with amyotrophic lateral sclerosis and the effect of edaravone administration
33
Introduction
! Amyotrophic lateral sclerosis (ALS) is characterized by muscular atrophy and reduced muscle strength, and it is an adult-onset neurodegenerative disease that causes selective degeneration of upper and lower motor neurons.(1) Disease
progression is usually rapid and respiratory disturbance results in death within 20 to 48 months.(2) Despite extensive research, the cause of the disease is unknown and no effective treatment is available.(3) Although familial ALS is known, sporadic ALS accounts for the majority of ALS cases. Beal et al. reported an increase in 3- nitrotyrosine(4) and 8-hydroxyguanine(5) in
the spinal cord of both sporadic and familial ALS patients. 3-Nitrotyrosine is formed by peroxynitrite-mediated nitration of tyrosine(6) and 8-hydroxyguanine is generated from guanine by oxidants such as hydroxyl radical. An increase of 3-nitrotyrosine was confirmed in the cerebrospinal fluid (CSF) of patients with sporadic ALS.(7) We have also reported an increase of oxidative stress in patients with sporadic ALS, based on measurements of the redox balance of plasma coenzyme Q10.(8)
! These observations prompted us to evaluate the efficacy of edaravone, a free radical scavenger,(9) in patients with ALS. Edaravone has been shown to inhibit lipid peroxidation as efficiently as well-known antioxidants such as vitamin E (VE) and ascorbic acid (VC).(10) In April 2001, the Japanese Ministry of Health, Labor, and
Welfare approved intravenous infusion of 30 mg edaravone twice a day for a maximum of 14 days in patients with acute brain infarction within 24 hr after onset, and edaravone is now widely used in Japan. Therefore, it is considered to be safe.
! We have demonstrated that edaravone (60 mg) administration 5-6 times a week for 6 months significantly reduced both the decline of the revised ALS functional rating scale (ALSFRS-R) and 3-nitrotyrosine levels in CSF of treated patients.(11)
In this study we evaluated oxidative stress in ALS patients by measuring the redox balance of plasma coenzyme Q10, plasma uric acid (UA being the predominant
endogenous scavenger of peroxynitrite(6)), and tissue oxidative damage markers such as the percentage of polyunsaturated fatty acids in the total plasma free fatty acids (FFA). We also evaluated the effect of edaravone administration on these markers.
Subjects and Methods
Study design
! The present study was carried out at the Yoshino Neurology Clinic during the period from 26 October 2011 to 31 May 2014. The study protocols were approved by the Ethical Committee of Tokyo University of Technology, and samples from patients were obtained in accordance with the Helsinki Declaration of 1964, as revised in 2001.
Twenty-six subjects (14 males aged 61.5 ± 12.4 years (mean ± SD) and 12 females aged 60.2 ± 16.5 years) were enrolled after they had given informed consent to participate in the study. The inclusion criterion was a diagnosis of sporadic or familial ALS. Exclusion criteria were compromised respiratory function that include tracheotomy, artificial respiration, or dyspnea. Additional exclusion criteria were complications such as advanced cancer, severe cardiac insufficiency, and age of less than 20 years.
Edaravone (30 mg) dissolved in 100 ml of saline was administered via an intravenous drip 1-4 times a week; among the 26 patients, 17 received edaravone administration for at least 3 months and 13 continued treatment for 6 months. Heparinized blood was collected before and after edaravone administration at week 0, week 1, month 1, month 3, and month 6; the collected plasma samples were stored at -30 °C until analysis.
ALSFRS-R scores were also measured before edaravone administration at week 0, week 1, month 1, month 3, and month 6.
Analytical procedures
! Plasma levels of VE, ubiquinol-10, ubiquinone-10, free cholesterol (FC), and cholesterol esters (CE) were determined as previously described12 with some modifications. In brief, plasma was extracted with 19 volumes of 2-propanol and the extract was analyzed by HPLC using an analytical column (Supelcosil LC-8, 5 µm, 25 cm x 4.6 mm i.d.; Supelco Japan, Tokyo), a reduction column (RC-10-1; Irica, Kyoto, Japan) and an amperometric electrochemical detector (Model Σ985; Irica) with an oxidation potential of +600 mV (vs. Ag/AgCl) on a glassy carbon electrode. The mobile phase consisted of 50 mM sodium perchlorate in methanol/2-propanol (9/1, v/v), delivered at a flow rate of 0.8 ml/min.
! Plasma levels of VC, UA and unconjugated bilirubin were determined by HPLC on a bonded-phase aminopropylsilyl column (Supelcosil LC-NH2, 5 µm, 25 cm x 4.6 mm i.d.; Supelco Japan) with UV/VIS detection (265 nm for 0 - 15 min and 460 nm for 15-22 min) as described previously.13
35
! Plasma FFA were derivatized with monodansylcadaverine for analysis by HPLC.
14 Briefly, plasma samples (50 µl) were mixed with 200 µl of methanol containing 25 µM margaric acid (internal standard) and then centrifuged at 13,000 x g for 5 min. Aliquots (50 µl) of supernatants were dried under a stream of nitrogen gas, and the residue was admixed with diethyl phosphorocyanidate (1 µl) and N,N-dimethylformamide (50 µl) containing monodansylcadaverine (2 mg/ml) and kept at room temperature in the dark for 20 min. A 5-µl sample was injected onto an octadecylsilyl column (3 µm, 3.3 cm x 4.6 mm i.d.; Supelco Japan) and a pKb-100 column (5 µm, 25 cm x 4.6 mm i.d.; Supelco Japan) connected in tandem. The FFA components were measured by fluorescence detection (Model 821-FP; Japan Spectroscopic, Tokyo, Japan) with excitation at 320 nm and emission at 520 nm. The mobile phase consisted of acetonitrile/methanol/water (17.5/65.0/17.5, v/v/v) delivered at a flow rate of 1.5 ml/min. The analytical columns were heated to 40°C.
Statistical analysis
! Data presented are mean values and standard deviations unless otherwise specified. The statistical significance of differences was evaluated with Student’s t-test.
To assess the time course of efficacy of edaravone administration, post-treatment data were assessed using repeated-measures analysis of variance (ANOVA). Group
differences were analyzed by means of Fisher’s exact probability test. P < 0.05 was considered statistically significant.
Results and Discussion
Oxidative stress in ALS patients
! Oxidative stress markers such as 3-nitrotyrosine,(4,7,11) 8-hydroxyguanine,(5) and protein carbonyl(5) are typically increased in ALS patients. Here, we examined a range of markers of circulatory oxidative stress and tissue oxidative damage in 26 patients with ALS as compared to those of 55 age-matched healthy controls,(8,15,16) as shown in Table 1. There were no significant differences in the plasma antioxidants, VC, VE, and total coenzyme Q10 between the two groups. However, a significant decrease was observed in UA, a peroxynitrite scavenger, and this is consistent with increased CSF levels of 3-nitrotyrosine observed in patients with ALS.(4,7,11) A significant decrease in plasma UA was also previously reported in ALS patients.(17) There was also a significant decrease in plasma unconjugated bilirubin, which is an important physiological
antioxidant.(18) Strikingly, we found that the ratio of the oxidized form of coenzyme Q10 (%CoQ10) to total coenzyme Q10 was significantly increased, corroborating an
increased level of oxidative stress in patients with ALS.
! Plasma level and composition of FFA are good markers of tissue oxidative damage, since polyunsaturated fatty acids (PUFA) such as linoleic acid (18:2), linolenic acid (18:3), arachidonic acid (20:4), and docosahexaenoic acid (22:6) are highly
susceptible to cellular oxidation. The oxidative loss of PUFA reduces membrane fluidity, but this can be compensated by the conversion of stearic acid (18:0) to oleic acid (18:1) or of palmitic acid (16:0) to palmitoleic acid (16:1) by stearoyl-CoA desaturase.(19)
Acceleration of oxidative stress causes hydrolysis of tissue and membrane lipids to FFA, which enter the blood stream. Under condition of oxidative stress, a lower
percentage of PUFA to total FFA (%PUFA) and/or higher percentages of 18:1 and 16:1 to total FFA (%18:1 and %16:1, respectively) would be expected. Indeed, such
modifications have been observed in patients with adult respiratory distress syndrome,
(20) multiple sclerosis,(21) Papillon-Lefevre syndrome,(22) and juvenile fibromyalgia,(23) and in newborn babies.(24) We recently observed elevation of plasma FFA, %16:1, and
%18:1 in rats after a 2-hour occlusion-reperfusion of the middle cerebral artery, and we showed that these changes were attenuated by administration of edaravone.(25)
37
Table 1!Levels of plasma antioxidants and lipids in patients with ALS as compared to age-matched healthy controls (average ± SD). P values were determined using the Student’s t-test. VC, ascorbic acid; UA, uric acid; BR, unconjugated bilirubin; VE, vitamin E; TQ10, total coenzyme Q10; %CoQ10, ratio of oxidized form of coenzyme Q10 to TQ10; FFA, free fatty acids; %PUFA, ratio of
polyunsaturated fatty acids to total free fatty acids; %16:1, ratio of palmitoleic acid to total FFA; %18:1, ratio of oleic acid to total FFA; FC, free cholesterol;
! CE, cholesterol esters; TC, total cholesterol.
! Although plasma levels of FFA, %16:1, and %18:1 were the same in ALS patients as in healthy controls, a significant decrease in %PUFA was observed in the patients, suggesting an increased level of tissue oxidative damage (Table 1). ALS patients also showed small but significant increases in FC and the FC/CE ratio, suggesting some impairment of lecithin-cholesterol acyltransferase and liver function does occur.(23)
Efficacy of edaravone administration
! Since oxidative damages are indicated in the pathogenesis of ALS,
administration of a free radical scavenger drug seems a rational theraputic stratege for diesease management. Indeed, we obtained a positive response to edaravone
treatment in our phase II trial (60 mg/day 5-6 times a week for 6 months).(11)
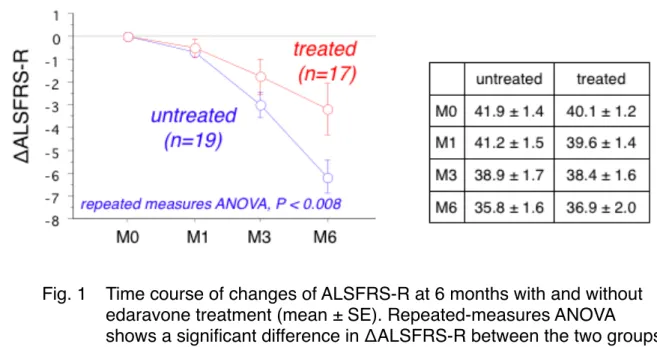
In the present study, edaravone was administered only 1-4 times a week for up to 6 months, since patients had joined this study independently. Among the 26 ALS patients, 17 received edaravone administration (30 mg/day, 1-4 times a week) for at least 3 months and 13 continued treatment for 6 months. Missing values of ΔALSFRS-R at 6 months for the 4 patients having an administration time between 3 and 6 months were estimated as twice the value of ΔALSFRS-R at 3 insetmonths. We observed a
significant improvement in ΔALSFRS-R at 6 months in these patients as compared to that of edaravone-untreated patients,11 as shown in Fig. 1 (the P value of repeated measures ANOVA was lower than 0.008). There was no significant difference in
ALSFRS-R at month 0 between the two groups (the values are shown in the inset table in Fig. 1).
Fig. 1 ! Time course of changes of ALSFRS-R at 6 months with and without edaravone treatment (mean ± SE). Repeated-measures ANOVA shows a significant difference in ΔALSFRS-R between the two groups (P < 0.008). Inset table provides the raw ALSFRS-R values.