Japan Advanced Institute of Science and Technology
JAIST Repository
https://dspace.jaist.ac.jp/
Title
Enabling Society With Information Technology : Speech enhancement and segregation based on human auditory mechanisms
Author(s) Akagi, Masato; Mizumachi, Mitsunori; Ishimoto, Yuichi; Unoki, Masashi
Citation
Issue Date 2002
Type Book
Text version author
URL http://hdl.handle.net/10119/4995
Rights
This is the author-created version of Springer, Speech enhancement and segregation based on human auditory mechanisms, Masato Akagi, Mitsunori Mizumachi, Yuichi Ishimoto, and Masashi Unoki,Enabling Society with Information Technology, Q. Jin et al. Eds, Springer,
Tokyo,2002,186-196. The original publication is available at www.springerlink.com.
Speech Enhancement and Segregation based on
Human Auditory Mechanisms
Masato Akagi1, Mitsunori Mizumachi2, Yuichi Ishimoto1, and Masashi Unoki3
1 Japan Advanced Institute of Science and Technology, Ishikawa 923-1292, Japan
2
ATR Spoken Language Translation Research Laboratories, Kyoto 619-0288, Japan
3 CNBH, Physiology Department, University of Cambridge, CB2 3EG, U.K.
1
Introduction
Humans can perceive specific desired sounds without difficulty, even in noisy environments. This is a useful ability that many animals possess, and is referred to as the 'Cocktail party effect'. We believe that by modeling this mechanism we will be able to produce tools for speech enhancement and segregation, or for other problems in speech recognition and analysis.
To construct models that mimic human sound perception ability, engineering know-how and knowledge of auditory physiology and/or psychoacoustics are required. This paper, first, introduces the basic concepts used to construct models such as "cancellation on the neural system" [5, 6, 7] and "auditory scene analysis" [2]. It then proposes models based on these concepts.
Specifically, this paper discusses the following;
(1) Speech enhancement: a cancellation model and speech enhancement, and (2) Speech segregation: auditory scene analysis proposed by Bregman [3] and an auditory sound segregation model based on auditory scene analysis.
2
Speech Enhancement [1,10,11,12]
2.1
Method
This paper assumes that the noises considered are unevenly distributed with regard to time, frequency, and direction. In this situation, spatial filtering is useful to extract target signals. Thus, we will discuss this filtering method with respect to inter-aural time differences (ITDs).
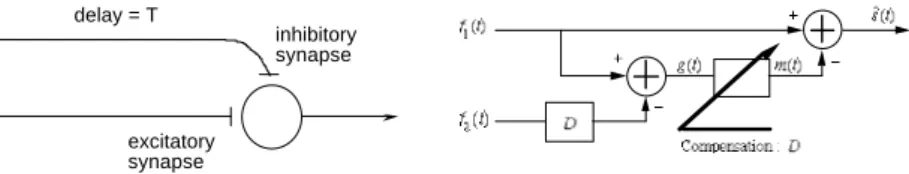
Models of systems used to reduce noise have been constructed using knowledge about auditory physiology and/or psychoacoustics. We used a cancellation method to design our filters (Durlach [7], Culling & Summerfield [5] for binaural masking level difference (BMLD) modeling, and de Cheveigné [6] for fundamental frequency estimation). The original cancellation method is a subtraction method that reduces periodical target signals with period T, using the
circuit in Fig. 1. We considered delay time T as to be the ITD for spatial filtering. We modified the circuit with an engineering point of view, as shown in Fig. 2.
2.2
Algorithm
Our method uses a microphone array with three linear and equally spaced (10 cm) omni-directional microphones, which estimates the largest noise at the position of the center microphone in each time period. Then, noise is reduced by subtracting the estimated noises from the signal received by the center microphone.
2.2.1
Estimation of noise
Noises are estimated by using the signals received by the paired microphones. These microphones are located at both ends of the microphone array (main pair), or with one in the center and one at both ends of the array (sub pair). Assume that a speech signal comes from a certain direction, and that noises come from directions other than that of the speech signal. Assuming that the speech signal
s(t )comes from a direction such as the difference in arrival time between main
paired microphones 2ζ, and the largest noise n(t ) comes from a direction that is 2δ, signals received at each microphone are described as follows:
left mic. : l(t) =s(t−ζ)+n (t−δ) (1)
center mic. : c(t )= s(t)+n(t) (2)
right mic. : r (t )= s(t+ζ)+n(t+δ) (3) For simplicity, we assume that speech signals come from the front. Then,
l(t) and r (t ) are shifted ±τ in time, where τ is a certain constant (τ ≠ 0 ),
and these make function glr(t) . The function glr(t) is a beamformer in the time
domain, and its short-term Fourier transformation (STFT) is Glr(ω) . The
function is defined as
glr(t)= {l(t+τ)−l(t−τ)}−{r(t+τ)−r(t−τ)}
4 ≡g(l,r ,τ,t ) , (4)
Glr(ω)=STFT g(l, r,
[
τ,t )]
=N(ω)sinωδsinωτ , (5) where N(ω) is the STFT of the largest noise n(t ). Note that Glr(ω) does nothave the component of S(ω) , the STFT of the speech signal s(t ), that is, S(ω) was cancelled. delay = T excitatory synapse inhibitory synapse
The item δ in Eq. (5) represents the direction from which the largest noise comes, so it is determined by estimating where the noise comes from in each frame (this is described later). The spectrum of the noise can be calculated by setting a certain value τ at the estimation of δ and dividing Eq. (5) by
sin2ωδ . However, it is not accurately calculated in the case of
ωδ =nπ, n: integer . In that frequency band, Gcr(ω) can be expressed form the
other beamformer g (c, r,τ2, t) as follows:
Gcr(ω)= STFT g(c, r,
[
τ2, t)]
=N(ω)exp jω δ 2
sinωδ 2sinωτ2. (6) Then, the spectrum of the largest noise n(t )is estimated over the entire frequency range as ˆ N (ω)= Glr(ω) sin2ωδ , sin2ωδ > ε 1Gcr(ω) sin2ω δ
( )
2 , sin2ωδ ≤ ε1 and sin2ω δ( )
2 >ε2Glr(ω) ε22 , sin2ω δ 2
( )
≤ε2
, (7)where ε1 and ε2 are threshold values.
2.2.2
Estimation of noise direction
The arrival directions of noises are automatically estimated frame by frame. In this paper, two signals, in which the speech signal is perfectly eliminated, provide these noise directions, and they are calculated by using Eq. (6) and
Glc(ω)=STFT g (l, c,
[
τ2, t)]
.
Here, the speech signal has no effect on the estimation of noise directions, as Gcr(ω) and Glc(ω) do not include speechsignals at all. Setting τ2 arbitrary, the following is calculated,
d (t)= IFFT Glc(ω)Gcr * (ω) Glc(ω) Gcr(ω)
and δ =arg maxtd (t )
[
]
(8) The value δ, half of the difference in the arrival time between the main paired microphones is given by Eq. (8).2.2.3
Signal enhancement
After estimating the spectrum of noise N (ˆ ω), it must be subtracted from that of the noisy-speech signal received by the center microphone c(t ) . This method employs a non-linear spectral subtraction (SS), expressed as
ˆ S (ω) = C(ω) −α ⋅ ˆ N (ω), C(ω) ≥α ⋅N (ˆ ω) βC(ω) , otherwise
, (9)where α is the subtraction coefficient, and β is the flooring coefficient. Thus, this method reduces any distortions in amplitude spectra cased by acoustic noises. In regards to SS, this method is superior to others; it can cope with all types
Noise added Noise reduced 0 2 4 6 [kHz] [kHz] 0 2 4 6 10 dB Time Noises 0 2 4 6 [kHz] /a/ (a) (b) (c)
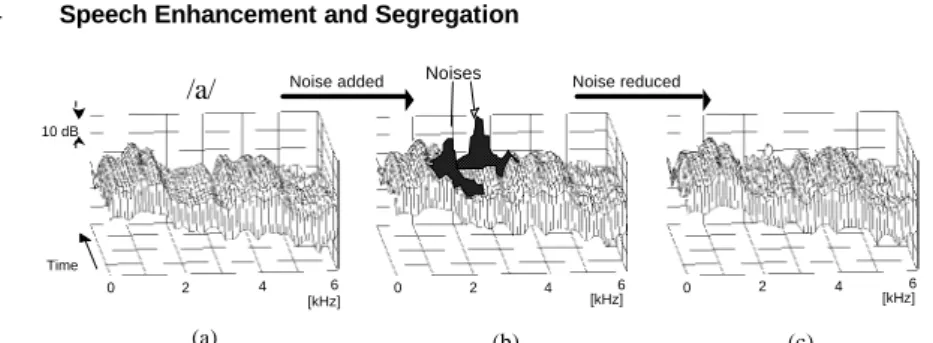
Fig. 3. Simulated results using sound data A. (a) original noise-free speech wave (vowel /a/), (b) noise-added speech wave, (c) noise-reduced speech wave.
of acoustic noise by estimating the spectra of each noise in frames. Other methods, however, are poor at eliminating non-stationary, like sudden, noise. This is because they substitute signals received in the past in greater or lesser degree.
This method can also employ wave subtraction (WS) [1].
2.3
Evaluation
2.3.1
Sound data simulation conditions
Two types of noise-added speech waves were evaluated. Both sound data were sampled at 48 kHz with 16-bit accuracy.
Sound data A, shown in Fig. 3, is a vowel /a/ in the ATR speech database. Two sudden narrow-band noises with center frequencies of 1500 Hz and 2500 Hz, bandwidth of 200 Hz, and duration of 50 ms are included. They were mixed on a computer with the speech signal coming from the front, and both of noises coming from about 30 degrees to the right. The noises are marked in black.
Sound data B is real sound waveform presented by two speakers in a soundproof room (reverberation time: about 50 ms at 500 Hz). The speech and noise come from 0 and 30 degrees to the right, both 3 meters from the microphones. The noise is wide-band white noise between 125 Hz to 6 kHz. Three SNRs (-10, 0, and 10 dB) were used. The speech waves without noise, and the speech wave with an SNR of 0 dB, are illustrated in Fig. 4.
2.3.2
Simulation conditions
The noise reduction experiments were done under the following conditions. The frame length was 5.3 ms, the frame shift was 2.7 ms, and the window function is Hamming. The threshold values ε1 and ε2 were 0.6 and 0.2, and the coefficients α and β in Eq. (9) were 1 and 0.001, respectively. Here, the frame length was set to be as short as possible to decrease the distortions caused by the SS. The other parameters were set experimentally.
0 0.5 1 1.5 2 2.5 3 3.5 4 4.5 5 Sampling Point (x 10000) -2 0 2 (a) (b) (c) (d) -2 0 2 -2 0 2 -2 0 2 LSD = 19.0 dB Noisy Speech (SNR = 0 dB) Noisy Speech (SNR = 10 dB) Result LSD = 13.4 dB LSD = 14.9 dB 0 2 4 6 -20 0 20 40 -20 0 20 40 dB 0 2 4 6 kHz (a) Original (c) Procesed (b) SNR = 0 dB (d) SNR = 10 dB
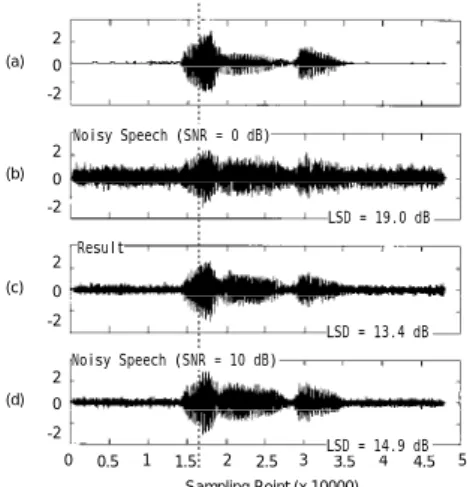
Fig. 4. Simulated results for Sound data B, (a) noise-free speech wave presented by speaker (ATR, mht14348 /bunri/), (b) noise-added speech wave: SNR = 0 dB, (c) noise-reduced speech wave, and (d) noise-added speech signal (SNR = 10 dB).
Fig. 5. Log-spectra of sound of vowel /u/ at about 16000 points, (a) original sound, (b) noise-added speech wave (SNR = 0 dB), (c) noise-reduced speech wave, and (d) noise-added speech signal (SNR = 10 dB).
2.3.3 Results
For sudden noise in the sound data A, the noise-reduced speech signal for the simulation using the proposed method is shown in Fig. 3(c). By comparing Figs. 3(a), (b) and (c), we see that sudden noises are greatly reduced.
For sound data B, Fig. 4(c) shows the noise-reduced sound from the 0-dB SNR. The amplitude of the noise was reduced, and was almost the same as that of the 10-dB SNR speech wave (Fig. 4(d)). This demonstrates that our method reduces noise in all segments. Figure 5 shows the log-spectra of the vowel /u/ at about 16000 points. Large peaks and dips are evident. The spectra of noise-added speech, by contrast, are flattened, especially in the higher-frequency region. Our results (Fig. 5(c)) indicate that this method recovers spectrum peaks and dips, and thus, may be helpful at the front end of ASR.
2.3.4
Front-end of automatic speech recognition [13]
We studied the decline in ASR performance under additive noise conditions and the subsequent improvement offered by noise reduction. We used speaker-dependent HMM with 12th order MFCCs, as a baseline ASR. The phoneme recognition tests were conducted using 1048 words from the ATR Japanese speech database for training. Experiments were conducted using open data. A total of 216 phoneme-balanced words were used for testing, uttered by the
20 15 10 5 0 0 5 10 15 20 25 30 35 SNR [dB] No processed Delay-and-Sum Proposed method
Phoneme error rate [%]
Fig. 6. Phoneme error rates. Three bars correspond to phoneme error rates of noise-added speech (black bar), noise-reduced speech obtained by optimized delay-and-sum beamformer (gray bar), and noise-reduced speech obtained by the proposed method (white bar).
same speaker in the same database. Some test sets were prepared by adding random noise (125-6000 Hz) to several SNRs, and then reducing them. The speech signal came from the front, and the noise signal came from 30 degrees to the right. For comparison, a conventional delay-and-sum beamformer [9], was used as a typical algorithm for noise reduction. We assume that the signal directions are known for the delay-and-sum beamformer. On the other hand, the proposed method estimates them automatically.
The results of the phoneme recognition tests are shown in Fig. 6. There are three bars in each SNR. They correspond to the phoneme error rates of the noise-added speech, the speech noise-reduced by the optimized delay-and-sum beamformer, and that reduced by our proposed method. Our proposed method clearly decreased phoneme error rates.
3
Speech Segregation [15,16,17,18]
3.1
Method
Bregman reported that the human auditory system uses four psychoacoustically heuristic regularities related to acoustic events to solve the problem of auditory scene analysis (ASA) [2, 3]. A number of ASA-based segregation models have been proposed to computationally solve this problem[4, 8, 14]. All models use a subset of the four regularities, and the amplitude (or power) spectrum as the acoustic feature. As a result, they do not completely segregate the desired signal from the noisy one, when the signal and noise are in the same frequency region.
We have addressed the necessity of using both the amplitude and the phase spectrum to completely extract the desired signal from a noisy one, thus solving the problems associated with segregating two acoustic sources [16]. This problem is defined as follows [16, 17, 18]. First, only the mixed signal f (t ), where
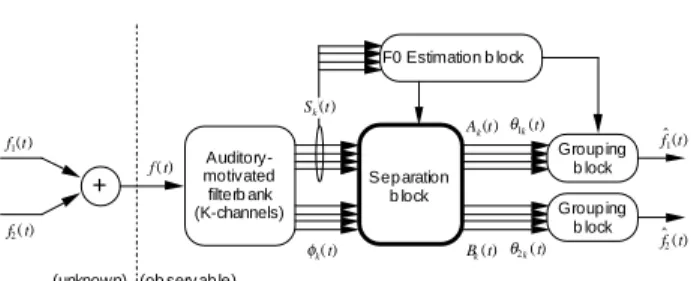
Auditory- motivated filterb ank (K-channels) + f1(t) f2( t) f ( t) φk( t) Ak(t) Bk(t) θ1k(t) θ2k( t) ˆ f 1(t) ˆ f 2(t) Sep aration b lock Sk(t) F0 Estimation b lock Group ing b lock Group ing b lock (unknown) (ob serv ab le)
Fig. 7. Auditory sound segregation model. f (t )= f
1(t )+ f2(t) , can be observed. Next, the observed signal f (t ) is
decomposed into its frequency components by using a filterbank ( K channels). The output of the k-th channel Xk(t) is represented by
Xk(t)= Sk(t ) exp j
(
ωkt+jφk(t ))
. (10)Here, if the outputs of the k-th channel, which correspond to f1(t ) and f2(t ), are assumed to be Ak(t )exp jωkt+ jθ
1 k(t )
(
)
and Bk(t) exp jωkt+ jθ2 k(t)
(
)
, theninstantaneous amplitudes Ak(t ), Bk(t) , and θk(t) can be determined by
Ak(t )= Sk(t) sin
(
θ2 k(t )−φk(t ))
sinθkt , (11)Bk(t) =Sk(t)sin
(
φk(t )−θ1 k(t ))
sinθkt , and (12)θk(t) =arctan Sk(t )sin
(
φk(t )−θ1 k(t ))
Sk(t )cos(
φk(t )−θ1k(t))
+Ak(t)
, (13)where θk(t) =θ2 k(t)−θ1k(t ) , θk(t) ≠nπ , n∈Z , and ωk is the center
frequency of the k-th channel [18]. However, the solution of this problem, Ak(t ),
Bk(t) , θ1k(t ) , and θ2 k(t ) , cannot be uniquely determined without some constraints. The problem, therefore, is an ill-inverse problem.
This paper proposes an auditory sound segregation model to solve this problem by using constraints related to the heuristic regularities.
3.2
Algorithm
This paper assumes that the desired signal f1(t ) is a harmonic complex tone, where F0(t) is the fundamental frequency. The constraints used in this model are
shown in Table 1.
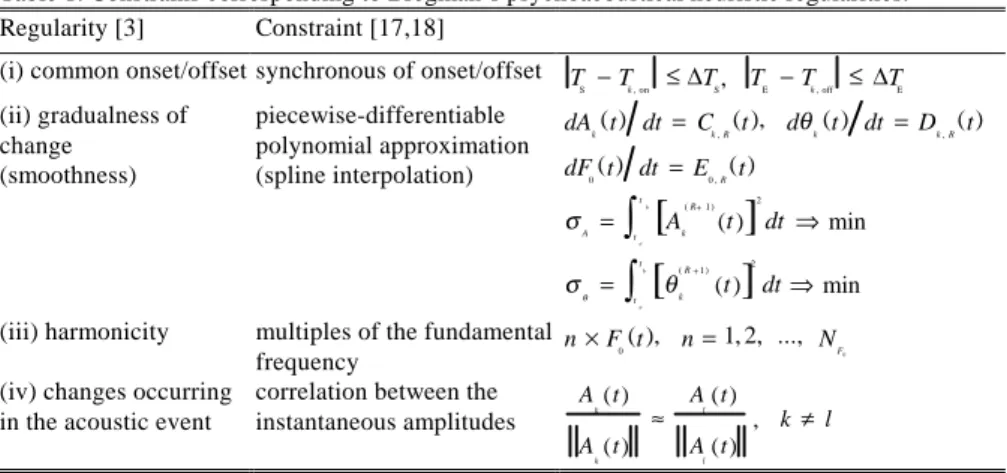
Constraint (i) is implemented by comparing the onset/offset (Tk , on, Tk , off) of
Xk(t) with the onset/offset (TS, TE) of Xl ˆ (t ) corresponding to F0(t) , where
∆TS =25 ms and ∆TE =50 ms [17]. Constraint (iii) is implemented by determining the channel number corresponding to the integer multiples of F0(t) [17]. Constraints (i) and (iii) are used to determine the concurrent time-frequency region of the desired signal in background noise.
To segregate the desired signal from the mixed one by constraining the temporal differentiation of Ak(t ) , θ1k(t ) , and F0(t) , constraint (ii) is
Table 1. Constrains corresponding to Bregman’s psychoacoustical heuristic regularities.
Regularity [3] Constraint [17,18]
(i) common onset/offset synchronous of onset/offset TS −Tk , on ≤ ∆TS, TE −Tk , off ≤ ∆TE
(ii) gradualness of change (smoothness) piecewise-differentiable polynomial approximation (spline interpolation) dAk(t) dt=Ck , R(t ), dθk(t ) dt =Dk , R(t) dF0(t) dt =E0 , R(t) σA = Ak ( R+1 ) (t )
[
]
2 dt t a t b∫
⇒min σθ = θk ( R+1 ) (t )[
]
2 dt t a t b∫
⇒min(iii) harmonicity multiples of the fundamental
frequency
n×F0(t ), n=1, 2, ..., NF0
(iv) changes occurring in the acoustic event
correlation between the instantaneous amplitudes A k(t) A k(t) ≈ Al(t) A l(t) , k≠l
E0 , R(t) is zero (R=0) in a small segment Th−Th−1, where Th is the continuous
point of F0(t) [18]. Constraint (iv) is implemented by correlation function of the
instantaneous amplitudes with the across-channel to determine the optimal
Ck , R(t) and Dk, R(t ) [17][18].
The proposed model has four blocks: an auditory-motivated filterbank, an F0 estimation block, a separation block, and a grouping block, as shown in Fig. 7.
The auditory-motivated filterbank (a constant Q gammatone filterbank) decomposes the observed signal f (t ) into Sk(t) and φk(t) [16].
The F0 estimation block determines the fundamental frequency of f1(t )
using the Comb filtering on an amplitude spectrogram Sk(t) s [15].
The separation block determines the optimal Ck ,1(t ) and Dk, 1(t) in every
small segment using constraints (iv), and then determines Ak(t ), Bk(t) , θ1k(t ) ,
and θ2 k(t ) from Sk(t) , φk(t) , Ck ,1(t ), and Dk, 1(t) using Eqs. (11) - (13), in
the concurrent time-frequency region. This concurrent region is determined by using constraints (i) and (iii), and the small segments are determined from the length of Th−Th−1 on the discontinuity of F0(t) . Ck ,1(t ) and Dk, 1(t) are determined as optimal arguments when the correlation between the instantaneous amplitudes with the across-channel, obtained from the candidates of the smoothed
5 10 15 20 0 5 10 15 20 25 30 SNR (dB) Proposed method Condition 1 Condition 2 Condition 3 Segregation accurcy (dB) Proposed method Condition 1 Condition 2 Condition 3 5 10 15 20 0 5 10 15 20 25 30 SNR (dB) S egregat ion accurcy (dB)
(the spline-interpolated) Ck ,1(t ) and Dk, 1(t) , is to be a maximum, in which the estimated region for Ck ,1(t ) and Dk, 1(t) are determined by using the Kalman filtering.
The grouping block reconstructs the segregated instantaneous amplitude and phase using the inverse wavelet transformation [17].
3.2
Evaluation
3.2.1
Sound and simulation conditions
To show that our proposed method segregates the desired signal f1(t ) from a noisy signal f (t ) that has precisely even waveforms, we ran two simulations using the following signals: (a) a noisy real vowel (/a/, /e/, /i/, /o/, /u/); and (b) a noisy real continuous vowel (/aoi/), where the noise was pink, and the SNRs of the noisy signals were between 5 and 20 dB, in 5-dB increments. These vowels were in the ATR database uttered by four speakers (two males and two females).
We used segregation accuracy, that is, the SNR in which S is an original signal and N is a difference between original and the extracted signals, to evaluate the segregation performance of the proposed method. Next, to show the advantages of the constraints in Table 1, we compared the performance of our method, when (1) extract without the smoothness of constraint (ii); (2) extract without constrains (ii) and (iv); and (3) extract with no constrains.
3.2.2
Results and discussion
The segregation accuracy in the two simulations and the four comparisons is shown in Fig. 8. In this figure, the bars show the mean of segregation accuracy and the error bar shows the standard deviation of segregation accuracy. The results show that the segregation accuracy of the proposed model was better than that of the others. These results also prove that, even in waveforms, the proposed model is capable of precisely segregating a desired vowel sound from a noisy one. In addition, by comparing the proposed model and (2), we see that simultaneous signals can be precisely segregated using the instantaneous amplitude and phase. Finally, when compared with (3), the proposed method improved segregation accuracy at an SNR of 5 dB in both simulations by about 8 dB.
4
Conclusion
This paper introduced some models associated with the 'Cocktail party effect'. Specially, it described;
- speech enhancement done by spatial filtering, and
Simulated results showed that spatial filtering is useful in speech enhancement, and thus can be effectively used at the front-end of automatic speech recognition. Even in waveforms, the sound segregation model is capable of precisely extracting a desired signal from a noisy one.
Acknowledgments
This work was supported by CREST, JST, and by Grant-in-Aid for Science research from the Ministry of Education, Japan (No. 10680374 and Research Fellowship of the Japan Society for the promotion of science for Young Scientists).
References
[1] Akagi, M, Mizumachi, M. (1997): Noise reduction by paired microphones. Proc. EUROSPEECH97, Rodes, 335-338
[2] Bregman, A.S. (1990): Auditory Scene Analysis. Academic Press.
[3] Bregman, A.S. (1993): Auditory Scene Analysis: hearing in complex environments. In: Thinking in Sounds. Oxford University Press, New York, pp. 10-36
[4] Cooke, M. P., Brown, G.J. (1993): Computational auditory scene analysis : Exploiting principles of perceived continuity. Speech Communication 13, 391-399
[5] Culling, J. F., Summerfield, Q. (1995): Perceptual separation of concurrent speech sounds: Absence of across-frequency grouping by common interaural delay. J. Acoust. Soc. Am. 98(2), 785-797
[6] de Cheveigné, A. (1993): Separation of concurrent harmonic sounds: Fundamental frequency estimation and a time-domain cancellation model of auditory processing. J. Acoust. Soc. Am. 93(6), 3271-3290
[7] Durlach, N. L. (1963): Equalization and Cancellation Theory of Binaural Masking-Level Difference. J. Acoust. Soc. Am. 35(8), 1206-1218
[8] Ellis, D. P. W. (1996): Prediction-driven computational auditory scene analysis. Ph.D. thesis, MIT Media Lab
[9] Flanagan, J. L, et al. (1991): Autodirective microphone systems. Acoustica 73(2), 58-71 [10] Mizumachi, M, Akagi, M. (1998): Noise reduction by paired-microphones using spectral subtraction. Proc. ICASSP98 II, 1001-1004
[11] Mizumachi, M., Akagi, M. (1999): Noise reduction method that is equipped for robust direction finder in adverse environments. Proc. Workshop on Robust Methods for Speech Recognition in Adverse Conditions, Tampere, Finland. 179-182
[12] Mizumachi, M., Akagi, M. (1999): An objective distortion estimator for hearing aids and its application to noise reduction. Proc. EUROSPEECH99, Budapest, 2619-2622
[13] Mizumachi, M., et al. (2000): Design of robust subtractive beamformer for noisy speech recognition. Proc. ICSLP2000, Beijing, IV-57-60
[14] Nakatani, T., et al. (1994): Unified Architecture for Auditory Scene Analysis and Spoken Language Processing. Proc. ICSLP '94, Yokohama, 24(3)
[15] Unoki, M., Akagi, M. (1998): Signal Extraction from Noisy Signal based on Auditory Scene Analysis. Proc. ICSLP'98, Sydney, 1515--1518
[16] Unoki, M., Akagi, M. (1997): A method of signal extraction from noisy signal. Proc. EUROSPEECH97, Rodes, 2587-2590
[17] Unoki, M., Akagi, M. (1999a): Signal Extraction from Noisy Signal based on Auditory Scene Analysis. Speech Communication 27(3), pp. 261—279
[18] Unoki, M., Akagi, M. (1999b): Segregation of vowel in background noise using the method of segregating two acoustic sources based on auditory scene. Proc. EUROSPEECH99, Budapest, 2575-2578