九州大学学術情報リポジトリ
Kyushu University Institutional Repository
Effects of Different Appllicaton Methods of Fertilizer and Manure on Soil Chemical
Properties, Yield, and NPK Balances in Whole Crop Rice Cultivation
ケーム, ボリン
http://hdl.handle.net/2324/1959173
出版情報:九州大学, 2018, 博士(農学), 課程博士 バージョン:
権利関係:
Effects of Different Application Methods of Fertilizer and Manure on Soil Chemical Properties, Yield, and
NPK Balances in Whole Crop Rice Cultivation
Borin Khem
2018
Effects of Different Application Methods of Fertilizer and Manure on Soil Chemical Properties, Yield, and
NPK Balances in Whole Crop Rice Cultivation
Borin Khem
2018
Effects of Different Application Methods of Fertilizer and Manure on Soil Chemical Properties, Yield, and
NPK Balances in Whole Crop Rice Cultivation
Borin Khem
Department of Agro-Environmental Sciences
Graduate School of Bioresource and Bioenvironmental Sciences Kyushu University
A thesis submitted for the degree of Doctor of Philosophy (Ph.D)
August 2018
Acknowledgement
On a journey to complete my research at Kyushu University, I am fortunate to have received tremendous support from many people. Without such support, this dissertation would not have become a reality.
First and foremost, I would like express my deepest gratitude to my supervisor, Associate Professor Yasumaru Hirai, for his valuable time and tremendous support, and his patience since the beginning of the research until finish. He has provided great support in checking, revising, and providing valuable and useful comments to improve the manuscripts for publication and dissertation. In addition, I am grateful for this guidance and comments to help me improve my presentation skills.
Secondly, I would like to express my gratitude to advisory committee members such as Professor Eiji Inoue, Professor Yoshiyuki Shinogi, Associate Professor Takeo Yamakawa, and Associate Professor Yasumaru Hirai, for their time and efforts on providing feedbacks, checking the dissertation, and in the evaluation towards my PhD graduation.
In addition, I would like to thank Associate Professor Takeo Yamakawa and Assistant Professor Yuki Mori, and Prof. emeritus of Kyushu University, Shinchiro Wada for their instructions on chemical analysis of manure and soil samples, and for checking paper manuscript to make improvement.
I also appreciate the useful comments and suggestions during the laboratory seminar by professors and students alike. Their comments and suggestions helped me improve not only my presentation skills but also the manuscript.
I would also like to extend my appreciation to all the helps and understanding of all previous and current members of laboratory of Agricultural Machinery and Production Systems Design including Professor Eiji Inoue, Associate Professor Takashi Okayasu, Assistant Professor Muneshi Mitsuoka, Tanaka San, Nakahira San, Lee San, Andri San, Shin San, Sovatna San and more. Through our discussion and interaction, I have learned a lot in order to improve my research, presentation and manuscript publication.
Furthermore, I would like to express my profound gratitude to MEXT scholarship for providing me with a golden opportunity to pursue my dream in Japan for 5 years and a half.
Without MEXT scholarship, it would not have been possible for me to complete such a great journey.
Last but not least, I would like to thank my dear family, and my parents for encouraging me and providing motive support. Their encouragement enables me to move forward and finish my doctoral degree.
Borin KHEM August 8, 2018
Abstract
Whole crop rice (WCR) is expected to establish a recycling system exchanging animal feed with manure from livestock farming. In WCR cultivation, the above-ground parts are harvested as animal feed unlike food rice. WCR is also known to absorb more nutrients compared with food rice. Therefore, the application of manure in the paddy fields is beneficial to replenish the removed nutrients and maintain soil fertility. However, due to different availability of manure, field drainage, and available time for its application, some farmers applied manure excessively whereas other farmers have to rely only on chemical fertilizer, which might lead to deterioration in soil fertility, yield reduction, or environmental pollution. In addition, there have been limited studies on how different application methods of fertilizer and manure in actual farming situations affected soil chemical properties, yield, and nutrient balances in WCR cultivation.
Therefore, the objectives of this study were (1) to investigate the effects of different application methods of fertilizer and manure on soil chemical properties and yield in WCR cultivation, and (2) to assess NPK balances in actual paddy fields where WCR was cultivated under different manure and chemical fertilizer applications.
This study was conducted in 2013 and 2014 in Itoshima region, Fukuoka Prefecture, Japan. Eight fields were surveyed in both 2013 and 2014 with an additional two fields added in 2014 (18 fields in total). The surveyed fields included two application methods—manure (M) alone, and chemical fertilizer (CF) alone.
For the first objective, the total 18 fields were investigated. The results showed that soil texture (clay plus silt) partly contributed to the increases of total nitrogen (TN), total
Ex. K, K saturation degree and available N between CF and M at around 40% of clay plus silt content strongly suggested that manure application contributed to increases in the soil chemical properties. The relatively large negative values of yearly difference of available N in CF fields may suggest the decrease of mineralizable part of soil TN even though long- term study is needed to verify. In addition, potential N supply in soil was significantly correlated with straw weight (r = 0.698, p < 0.05 for 2013; r = 0.873, p < 0.01 for 2014) or yield of whole crop (r = 0.852, p < 0.01 for 2014) indicated that N mineralized from soil, which was enhanced by manure application, increased straw weight, resulting in an increase in yield of whole crop.
For the second objective, same surveyed fields were investigated. Residual N, P and K, which were calculated as NPK input-output balances, were markedly large in M fields: 390–
1174 kg N ha−1, 100–489 kg P ha−1, and 168–968 kg K ha−1, respectively. Contrarily, residual N, P and K were small in CF fields: 40–74 kg N ha−1, 1–8 kg P ha−1, and −18 to 24 kg K ha−1, respectively. Excessive application of manure beyond crop requirement resulted in large residual N, P and K, which can cause water pollution through leaching and surface runoff. Positive trends of soil N and P balances in M fields implied that large amount of manure application accumulated N and P in the paddy fields. Applying manure to meet crop requirement on available P basis, which considers residual effects of continuous application and compensates for shortage of N using fertilizer, is a possible measure to produce yields comparable to N-based manure application with low environmental impact.
Table of Contents
Acknowledgement ... i
Abstract ... iii
List of Tables ... vii
List of Figures ... viii
List of Abbreviations and Acronyms ...x
Chapter 1. Introduction ...1
1.1 Background ...1
1.2 Previous studies on WCR ...3
1.3 Research objectives and thesis outline ...4
Chapter 2. Effects of Different Application Methods of Fertilizer and Manure on Soil Chemical Properties and Yield in Whole Crop Rice Cultivation ...6
2.1 Introduction...6
2.2 Materials and methods...7
2.2.1 Surveyed fields ...7
2.2.2 Measurements of physicochemical properties of manure ... 11
2.2.3 Measurements of soil chemical properties... 12
2.2.4 Measurement of yield of whole crop ... 13
2.2.5 Statistical analysis ... 13
2.3 Results ... 14
2.3.1 Physicochemical properties of manures ... 14
2.3.2 Soil chemical properties ... 14
2.3.3 Yield ... 15
2.3.4 Relationships between clay plus silt content and soil chemical properties ... 19
2.3.5 Relationships between soil TN and available N ... 25 2.3.6 Relationships between straw weight, grain head weight, yield of whole crop, and
2.4 Discussion ... 28
2.4.1 Yearly differences of soil chemical properties ... 28
2.4.2 Relationships between clay plus silt content and soil chemical properties ... 28
2.4.3 Effects of fertilizer and manure application on soil chemical properties ... 29
2.4.4 Effects of fertilizer and manure application on yield ... 30
2.5 Conclusions... 32
Chapter 3. NPK Balances in Whole Crop Rice Cultivation under Different Application Methods of Fertilizer and Manure ... 33
3.1 Introduction... 33
3.2 Nutrient flow associated with rice production ... 34
3.3 Materials and methods... 36
3.3.1 Fields information ... 36
3.3.2 Application methods of manure and chemical fertilizer ... 36
3.3.3 Measurement of soil chemical properties ... 39
3.3.4 Estimation of NPK uptake by WCR ... 39
3.3.5 Estimation of NPK balances ... 43
3.4 Results ... 49
3.4.1 N balance ... 49
3.4.2 P balance ... 53
3.4.3 K balance ... 55
3.5 Discussion ... 57
3.5.1 N balance ... 57
3.5.2 P balance ... 58
3.5.3 K balance ... 59
3.5.4 Measures to reduce environmental impacts ... 60
3.6 Conclusions... 62
Chapter 4. Summary and Conclusions ... 63
References ... 66
List of Tables
2.1 Soil properties, cropping system, and cultivation period in surveyed fields ... 9
2.2 Application methods of manure and chemical fertilizer ... 10
2.3 Physicochemical properties of applied manures... 16
2.4 Soil TN, TP, Ex. K, K saturation degree, and available N ... 17
2.5 Straw weight and yield of whole crop... 18
2.6 Simple correlation analysis between straw weight, yield of whole crop, and N supply sources ... 27
3.1 Soil properties in the surveyed fields ... 38
3.2 Application methods of manure and chemical fertilizer ... 41
3.3 Physicochemical properties of applied manures... 42
3.4 Water requirement, and N and P concentration in irrigation water ... 46
3.5 K concentration used in the calculation of K input from precipitation ... 47
3.6 Cited data used in the calculation of NPK input-output balances ... 48
3.7 NPK uptake by WCR ... 50
3.8 TN, TP and TK in soil after harvest and soil NPK balances ... 52
List of Figures
2.1 Relationships between clay plus silt percentage and soil TN after harvest. M = manure alone; CF = chemical fertilizer alone. Pooled data means correlation was analyzed by pooling the data from M and CF. ... 20 2.2 Relationships between clay plus silt percentage and soil TP after harvest. M = manure
alone; CF = chemical fertilizer alone. Pooled data means correlation was analyzed by pooling the data from M and CF... 21 2.3 Relationships between clay plus silt percentage and Ex. K after harvest. M = manure
alone; CF = chemical fertilizer alone. Pooled data means correlation was analyzed by pooling the data from M and CF... 22 2.4 Relationships between clay plus silt percentage and K saturation degree. M = manure alone; CF = chemical fertilizer alone. Pooled data means correlation was analyzed by pooling the data from M and CF... 23 2.5 Relationships between clay plus silt percentage and available N. The available N was measured for soil samples collected before transplanting. M = manure alone; CF = chemical fertilizer alone. Pooled data means correlation was analyzed by pooling the data from M and CF ... 24 2.6 Relationships between soil TN after harvest and available N. The available N was measured for soil samples collected before transplanting. M = manure alone; CF = chemical fertilizer alone. Pooled data means correlation was analyzed by pooling the data from M and CF ... 26 3.1 N flow associated with rice production ... 35
3.2 N input-output (a) and residual N (b). The values of input from manure, fertilizer, irrigation, precipitation, and biological N2 fixation were taken positive, and the values of uptake by WCR were taken negative. Residual N was calculated as input-output balances using Eq. (1) ... 51 3.3 P input-output (a) and residual P (b). The values of input from manure, fertilizer, irrigation, and precipitation were taken positive, and the values of uptake by WCR were taken negative. Residual P was calculated as input-output balances using Eq. (1) ... 54 3.4 K input-output (a) and residual K (b). The values of input from manure, fertilizer, irrigation, and precipitation were taken positive, and the values of uptake by WCR were taken negative. Residual K was calculated as input-output balances using Eq. (1) ... 56
List of Abbreviations and Acronyms
CEC: Cation exchange capacity CF: Chemical fertilizer alone EC: Electrical conductivity Ex. K: Exchangeable potassium M: Manure alone
TN: Total nitrogen TK: Total potassium TP: Total phosphorus
Chapter 1 Introduction
1.1 Background
The use of redundant paddy fields has been an important subject in Japan’s paddy farming since a continuous decline in rice consumption started in the 1960s (MAFF 2006). The government has been tackling this subject by encouraging the cultivation of soybean, wheat, and feed crops as substitutes for rice. The cultivation of those crops boosted the food self- sufficiency ratio on a calorie basis by 4.31% according to the estimation by Arahata (2014).
However, substitutive upland crops were not always able to be cultivated in paddy fields because of unsuitable drainage conditions (Kato, 2008). Arahata (2014) estimated that the area of fallow paddy fields was currently approximately 293,000 ha. This situation has raised concerns about the loss of multiple functions of paddy fields such as food production, flood prevention, groundwater retention, and formation of rural landscapes.
Improving the low self-sufficiency ratio of livestock feed—27% in 2014 (MAFF, 2016)—is also important in relation to paddy farming in Japan. This low self-sufficiency ratio has occurred because the Agricultural Basic Law issued in 1961 promoted intensive livestock industry that was dependent on foreign feed (Nishio, 2005). Meanwhile, the
foreign feed. For bulky feed, such as hay and rice straw, the self-sufficiency ratio was 78%
in 2014 (MAFF, 2016); the potential to further boost the ratio is beneficial from the safety and economic aspects. Kato (2008) and Sakai et al. (2008) noted the infection risk of foot and mouth disease through imported bulky feed. Kato (2008) also mentioned the high transportation costs of some bulky feed imported from America, Canada and China.
Because of the concerns noted above, whole crop rice (WCR), which is cultivated in paddy fields with similar cultural practices as food rice, has been promoted by the government since 2000 (Kato 2008; Taniguchi et al., 2010). The cultivation area of WCR has rapidly increased to reach 38,226 ha in 2015 (MAFF 2016). WCR cultivation is expected to establish a system that recycles local organic resources by exchanging feed with manure produced from animal wastes. The recycling system can lower the production cost of WCR and simultaneously solve problems related to the disposal of animal waste, which has always been a concern in livestock farming. The recycling system is also important to maintain soil fertility in WCR cultivation, because the entire above-ground biomass is harvested as animal feed unlike food rice where straw is normally incorporated into the soil. Ooya and Watanabe (2013) and Oya et al. (2015) demonstrated that a 2–4 year successive application of cow manure in WCR cultivation maintained or increased humus and total nitrogen (TN) in soil, and soil available N.
Meanwhile, manure application in actual farming situations is restricted by factors such as availability of manure, field drainage, and available time for its application, which is especially short in a dual-crop system. Moreover, farmers might rely more heavily on subsidies to cover their production costs rather than increasing yield because of low market price of WCR at about 40 JPY kg−1 (Taniguchi et al., 2010). Thus, farmers can save fertilizer costs, and also apply excessive amounts of manure supplied from livestock farmers for free.
These situations can cause excessive application of manure and insufficient application of
fertilizer, which might lead to deterioration in soil fertility, yield reduction, or environmental pollution.
1.2 Previous studies on WCR
Due to decreasing trend of rice consumption, rice production in Japan has been restricted in order to balance the supply and demand of rice since 1970s (Sakai et al., 2003). As a consequence, a large area of paddy fields was left without rice cultivation. In addition, to improve the low self-sufficiency ratio of animal feed, there is a strong need for domestic feed production. The experiment on the use of rice for feed has been conducted since 1970s;
however, the cost of using food rice for animal feed was too high (Sakai et al., 2003). Thus, in 1999, the Ministry of Agriculture, Forestry and Fisheries (MAFF) of Japan initiated a research project, which mainly focused on developing whole crop rice cultivar with high productivity and suitable for low-cost production (Sakai et al., 2003; Sakai et al., 2008).
Consequently, this project has developed high yielding cultivars including Bekoaoba, Yumeaoba, and Kusayutaka for cool regions, Hoshiaoba, Kusahonami, Kusanohoshi, and Leafstar for moderate regions, and Mohretsu, Nishiaoba, and Tachiaoba for warm regions like Kyushu (Sakai et al., 2008).
A few studies have focused on different aspects of WCR cultivation. Cheng et al. (2018) investigated differences in methane (CH4) emission among food rice, feed rice, and WCR cultivation. Their research showed that methane emission from WCR (Tachisuzuka cultivar) and feed rice (Fukuhibiki cultivar) were 87% and 40% higher than that from food rice (Haenuki cultivar). Islam et al. (2004) estimated the nutritive value of WCR (Hamasari cultivar) at yellow mature stage. Their results showed that the head parts were more nutritious than leaf and stem.
Limited studies investigated the effects of different application methods of fertilizer and manure on soil chemical properties and yield of WCR in actual farming situations. Oya et al. (2014) and Oya et al. (2015) conducted surveys on 70 farmers' fields in western Japan and reported that 80% of the fields were below the standard for potassium (K) saturation degree and that the average yield (12.8 ton ha−1) was about 2 ton ha−1 lower than the yield target (15 ton ha−1).
N balance in WCR cultivation has been extensively studied due to environmental concerns, and possible use of WCR for reducing N loads in the environment. Kyaw et al.
(2005) estimated N balance in a paddy field planted with WCR (Kusahonami cultivar) under unfertilized and fertilized (160 kg N ha−1) conditions. They aimed to establish an appropriate fertilizer application method suitable for reducing N loads in the environment, and increase productivity. Their results showed that N uptake by WCR was a main output in both treatments and N losses by leaching were relatively small, 4.8–7.3 kg N ha−1. Zhou and Hosomi (2008) investigated N balance in a constructed wetland for nutrient-polluted river water treatment. They found that WCR absorbed large amount of N from the wetland suggesting that harvesting aboveground biomass could recycle large amount of removed N.
Gusmini et al. (2015) estimated N balance by pot experiment when WCR was cultivated with 140 and 280 kg N ha−1 applied from combined cow and poultry manure.
1.3 Research objectives and thesis outline
There have been limited studies focusing on the effects of different application methods of fertilizer and manure on soil chemical properties and yield of WCR in actual farming situations. From the aspects of environmental impact, some studies investigated N balances in WCR cultivation, while they did not compare N balances under different application
methods of fertilizer and manure. In addition, phosphorus (P) and potassium (K) balances have not been investigated in WCR cultivation. Therefore, the objectives of this study were (1) to investigate the effects of different application methods of fertilizer and manure on soil chemical properties and yield in WCR cultivation, and (2) to assess NPK balances in a paddy field where WCR is cultivated under different application methods of fertilizer and manure.
Chapter 2 presents the study on the first objective. To complete this objective, field surveys were conducted in 2013 and 2014 in Itoshima region, Fukuoka Prefecture, Japan.
The surveyed fields included two application methods of fertilizer and manure—manure (M) alone, and chemical fertilizer (CF) alone. Soil chemical properties including TN, TP, exchangeable potassium (Ex. K), K saturation degree, and available N were compared between M and CF fields. The relationships between soil chemical properties, soil potential N supply and yield were also investigated.
Chapter 3 shows the study on the second objective. To complete this objective, we assessed NPK input-output balances, which is expressed as residual values, calculated by nutrient input in minus nutrient output from a paddy field during the estimation period. In addition, we assessed soil NPK balances in a paddy field by subtracting NPK in soil after harvest in 2013 from soil after harvest in 2013. Then, we investigated trends of NPK input- output balances (residual) and soil NPK balances in M and CF fields and considered its environment impact.
Chapter 2
Effects of Different Application Methods of Fertilizer and Manure on Soil Chemical Properties and Yield in Whole Crop Rice
Cultivation
2.1 Introduction
WCR is expected to establish a cultivation method using manure produced from animal wastes. Meanwhile, application methods of fertilizer and manure in the WCR cultivation are affected by manure availability, available time for manure application, and field drainage, and low market price of WCR. Moreover, farmers might rely more heavily on subsidies to cover their production costs rather than increasing yield. These situations can cause excessive application of manure and insufficient application of fertilizer which might lead to deterioration in soil fertilizer and yield reduction.
This chapter focuses on the effects of different application methods of fertilizer and manure on soil chemical properties and yield in WCR cultivation. Section 2.2 shows the
materials and methods used in this study. This section includes information on field surveys, application methods, soil and manure sampling, chemical analysis methods and statistical analysis. Section 2.3 presents physicochemical properties of manures, soil chemical properties, yield, relationships between soil texture and soil chemical properties, relationships between soil total nitrogen and available nitrogen, and relationships between yield and nitrogen supply sources. Section 2.4 discusses the yearly differences of soil chemical properties in M and CF fields. The section also discusses the relationships between soil texture and soil chemical properties, effects of fertilizer and manure application on soil chemical properties, and yield. Section 2.5 concludes the main findings presented in this chapter.
2.2 Materials and methods
2.2.1 Surveyed fields
Field surveys were conducted in the Itoshima region, Fukuoka Prefecture, Japan (33°30'N–
33°34'N, 130°08'E–130°15'E). Eight fields were surveyed in both 2013 and 2014, and two more fields were added in 2014 (i.e., 18 fields in total). The surveyed fields were cultivated by five different farmers. The Tachiaoba cultivar (Oryza sativa L.) was grown in all surveyed fields. Transplanting dates were from 14–25 June in 2013 and 11–26 June in 2014. Heading dates were from 6–18 September in 2013 and 12–18 September in 2014. Harvesting dates were 17 October in 2013, and 8 and 11 October in 2014.
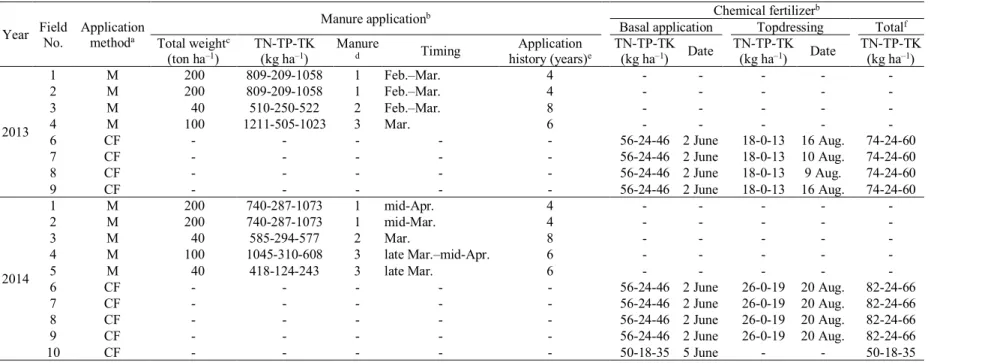
Table 2.1 shows soil properties and cultivation period in surveyed fields. The surveyed fields included two application methods of manure (M) alone (5 fields: Field Nos. 1–5) and chemical fertilizer (CF) alone (5 fields: Field Nos. 6–10). Soil types included and the ranges of CEC in the surveyed fields were as follows: light clay (LiC), sandy clay loam (SCL) and
clay loam (CL), and 10.58–18.74 cmol kg−1 in M fields; SCL and sandy loam (SL), and 5.81–9.68 cmol kg−1 in CF fields. The cropping system was single WCR in all the surveyed fields. The periods of WCR cultivation were 4–13 years, and manure was applied yearly in M fields.
Table 2.2 shows application methods of manure and chemical fertilizer. In M fields, estimated amounts of TN, TP, and total K (TK) applied from manure varied widely from 418–1211 kg ha−1 (average: 763 kg ha−1), 124–505 kg ha−1 (average: 275 kg ha−1), and 243–
1073 kg ha−1 (average: 804 kg ha−1), respectively. The application timings of manure extended from February to April. In CF fields, TN, TP, and TK applied from chemical fertilizer amounted to 50–82 kg ha−1 (average: 75 kg ha−1), 18–24 kg ha−1 (average: 23 kg ha−1), and 35–69 kg ha−1 (average: 60 kg ha−1), respectively.
Table 2.1 Soil properties, cropping system, and cultivation period in surveyed fields
Field No.
Application methodsa
Soil classificationb
Clay
(%) Silt
(%) Sand
(%) Soil typec
CEC (cmol kg–1)
Cropping system
WCR cultivation period (year)d
Manure application history (year)d
1 M GrL-bf 28 25 47 LiC 15.85 Single WCR 4 4
2 M GrL-bf 29 24 47 LiC 17.30 Single WCR 4 4
3 M G-sf 30 34 36 LiC 18.74 Single WCR 8 8
4 M G-f 18 19 63 SCL 11.43 Single WCR 6 6
5 M G-smc 18 24 58 CL 10.58 Single WCR 6 6
6 CF G-smc 20 11 69 SCL 8.48 Single WCR 13 N.A
7 CF G-smc 23 18 59 SCL 9.68 Single WCR 13 N.A
8 CF G-f 12 11 77 SL 5.81 Single WCR 13 N.A
9 CF G-f 21 10 69 SCL 7.50 Single WCR 13 N.A
10 CF G-f 16 20 64 SCL 9.10 Single WCR 13 N.A
a M = manure alone; CF = chemical fertilizer alone. b Based on the Classification of Cultivated Soils in Japan - 2nd Approximation (Third Division of Soils, National Institute for Agro-Environmental Sciences, 1983). G-f = Fine-textured Gley soils; G-smc = Medium and Coarse- textured Strong-gley soils; GrL-bf = Fine-textured Gray Lowland soils (grayish brown type); G-sf = Fine-textured Strong-gley soils. c CL = clay loam; SCL = sandy clay loam; SL = sandy loam; LiC = light clay. d Approximation based on interviews with farmers (as of October in 2014).
N.A = Not applied.
Table 2.2 Application methods of manure and chemical fertilizer
Year Field No. Application methoda
Manure applicationb Chemical fertilizerb
Basal application Topdressing Totalf Total weightc
(ton ha–1) TN-TP-TK
(kg ha–1) Manure
d Timing Application
history (years)e TN-TP-TK (kg ha–1) Date TN-TP-TK (kg ha–1) Date TN-TP-TK (kg ha–1)
2013
1 M 200 809-209-1058 1 Feb.–Mar. 4 - - - - -
2 M 200 809-209-1058 1 Feb.–Mar. 4 - - - - -
3 M 40 510-250-522 2 Feb.–Mar. 8 - - - - -
4 M 100 1211-505-1023 3 Mar. 6 - - - - -
6 CF - - - - - 56-24-46 2 June 18-0-13 16 Aug. 74-24-60
7 CF - - - - - 56-24-46 2 June 18-0-13 10 Aug. 74-24-60
8 CF - - - - - 56-24-46 2 June 18-0-13 9 Aug. 74-24-60
9 CF - - - - - 56-24-46 2 June 18-0-13 16 Aug. 74-24-60
2014
1 M 200 740-287-1073 1 mid-Apr. 4 - - - - -
2 M 200 740-287-1073 1 mid-Mar. 4 - - - - -
3 M 40 585-294-577 2 Mar. 8 - - - - -
4 M 100 1045-310-608 3 late Mar.–mid-Apr. 6 - - - - -
5 M 40 418-124-243 3 late Mar. 6 - - - - -
6 CF - - - - - 56-24-46 2 June 26-0-19 20 Aug. 82-24-66
7 CF - - - - - 56-24-46 2 June 26-0-19 20 Aug. 82-24-66
8 CF - - - - - 56-24-46 2 June 26-0-19 20 Aug. 82-24-66
9 CF - - - - - 56-24-46 2 June 26-0-19 20 Aug. 82-24-66
10 CF - - - - - 50-18-35 5 June - - 50-18-35
aM = manure alone; CF = chemical fertilizer alone. bInformation on application amount and timing of manure and chemical fertilizer is approximation based on interviews with farmers. cWet basis. dRefer to Table 3. eBased on interviews with farmers (as of October 2014). fThe total values are not always equal to the summation of basal application and topdressing in the table due to rounding.
2.2.2 Measurements of physicochemical properties of manure
Samples of the manures were collected in May in both 2013 and 2014 from three locations in piles of manure at each of three different cow sheds. The maturity of collected manures was nearly same with those applied in the surveyed fields. Manure samples were preserved in Ziploc® bags. Three samples of manure from the same shed were mixed; half of the amount of each mixed sample was air-dried and passed through a 1-mm sieve, while the remaining raw sample was stored at 4 °C. The air-dried sample was then ground using a standard Wiley Cutting Mill (No.1029, YOSHIDA SEISAKUSHO CO., Ltd, Tokyo, Japan).
First, moisture content of raw manure was measured by oven-drying at 105 °C for 24 h.
Then, raw manure, which was equivalent to 15 g on a dry weight basis, was placed in a beaker. The beaker was left for 1 h after adding hot water at approximately 70 °C. The reason for using hot water was to sterilize manure before chemical analysis. Here, hot water was used following the method of a germination test to evaluate the quality of animal waste compost (Kumagai and Yamaguchi, 2004). The solution of raw manure was adjusted to be 150 mL for total water volume. Then, manure extract was collected by filtering the solution through a No. 5B filter paper (Advantec, Tokyo, Japan). Electrical conductivity (EC), pH, ammonium (NH4–N), and nitrate (NO3–N) were measured using the manure extract. The EC and pH were measured using an EC meter (B-173; HORIBA, Ltd., Kyoto, Japan) and a pH meter (B-212; HORIBA, Ltd.), respectively. NH4–N and NO3–N were measured by the indophenol method (Cataldo et al., 1974) and Cataldo method (Cataldo et al., 1975), respectively.
TN, TP, and TK were measured using dry ground samples. Each of the samples was digested by the H2SO4-H2O2 Kjeldahl digestion method (Ohyama et al., 1991) with three replications. TN and TP were measured by the indophenol method and ascorbic acid method
for TN and TP, respectively, using a spectrophotometer (V-630; JASCO, Tokyo, Japan) with a rapid sampler (NQF-720; JASCO). TK was measured using atomic absorption spectrophotometry (Z-5300; Hitachi High-Technologies Co., Tokyo, Japan). Total carbon (TC) was measured for dry ground samples using a total organic carbon analyzer (TOC- 5000A; Shimadzu, Kyoto, Japan) equipped with solid sample module (SSM-5000A;
Shimadzu) in 2013 and a CHN coder (MT-5, Yanaco) in 2014.
2.2.3 Measurements of soil chemical properties
Soil samples were collected at five locations with a crisscross pattern in each surveyed field.
The soil from 0–10 cm depth was sampled using a 5-cm diameter soil core sampler. Soil was sampled before transplanting (late May to early June) and after harvest (early December in 2013, early to mid- October in 2014).
Soil samples were air-dried, and were then passed through a 2-mm sieve by a Soil Sample Crusher (SSM-1; Fujihara, Tokyo, Japan), while five soil samples from each surveyed field were mixed into one composite. The composite samples were ground into fine particle using a sample mill (Cyclotec TC 1093, Fisher Scientific, Atlanta, Georgia).
The soil samples that had been collected after harvest were analyzed for TN and TP following the same procedures as described in Section 2.2 for manure. Ex. K was extracted with 1 M ammonium acetate (pH 7) by a shaking extraction method (Muramoto et al., 1992) and measured by atomic absorption spectrometry (Z-2300, Hitachi, Tokyo, Japan). The soil samples that had been collected before transplanting were analyzed for available N under 4- week incubation. First, 20 g of dry soil was added to a 500-mL glass bottle, then 50 mL of distilled water was added. Next, the headspace in the bottle was replaced with N gas and the bottle capped with a rubber stopper. The flooded soil in the bottle was incubated at 30 °C for 4 weeks. After incubation, NH –N was extracted with 100 mL of 0.5 M K SO by
shaking the bottle for 20 min. The extract was filtered through a No. 5B filter paper and NH4–N in the extract was measured by the indophenol method. Finally, available N was evaluated as values per 1 kg of dry soil.
2.2.4 Measurement of yield of whole crop
Yield of whole crop was estimated by quadrat sampling of 60 hills. Of these, 30 hills were manually harvested in each of the two plots located in a diagonal direction across the field on October 17, 2013 (yellow ripening stage) and on October 8 and 11, 2014 (one week before yellow ripening stage). Straw and grain heads were separately weighed and measured for moisture content by oven-drying at 70 °C for 48 h. Then, yield of whole crop including straw and grain heads were calculated on a dry weight basis.
2.2.5 Statistical analysis
Correlation analysis was conducted on the relationships between clay plus silt content and soil TN, TP, Ex. K, K saturation degree, and available N. These relationships were analyzed by pooling the data from the two-year survey where data from two application methods (M, CF) were analyzed as a pool, and analyzed separately by application methods. The correlation analysis was conducted to evaluate the effects of application methods of fertilizer and manure on soil chemical properties considering the effects of soil texture simultaneously.
Correlation analysis was also conducted on the relationship between soil TN and available N. In addition, correlation analysis was conducted to evaluate the effects of N supply sources (soil, basal application, topdressing) on straw weight, grain head weight, and yield of whole crop. Yearly difference was calculated in fields surveyed for two, by subtracting values in
2.3 Results
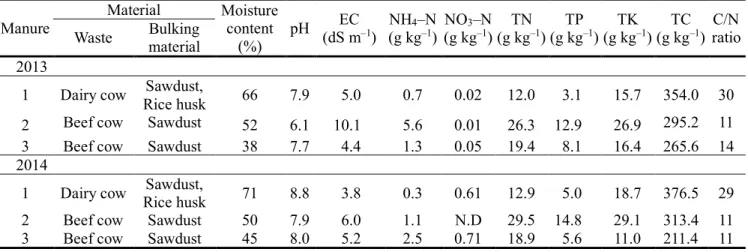
2.3.1 Physicochemical properties of manures
Table 2.3 shows physicochemical properties of manures applied in the surveyed fields. Three different manures were applied in surveyed fields each year: manure 1, Field Nos. 1 and 2;
manure 2, Field No. 3; and manure 3, Field Nos. 4 and 5 (Table 2.2). The materials of manures were dairy cow waste, sawdust, and rice husk in manure 1 and beef cow waste and sawdust in manures 2 and 3. Manure 1 had a high moisture content of around 70%, whereas manure 3 tended to be dry with a moisture content around 40%. For all three manures, pH and EC were in the range of 6.1–8.8, and 3.8–10.1 dS m−1. NH4–N content in manure 1 was consistently low in both years, while it fluctuated from 5.6 g kg−1 in 2013 to 1.1 g kg−1 in 2014 in manure 2. The NO3–N was detected at low levels in all manures in 2013, while it was 0.61 g kg-1 in manure 1 and 0.71 g kg-1 in manure 3 in 2014. TN was low in manure 1 and high in manure 2, whereas that of all manures, it ranged from 12.0–29.5 g kg−1. TP and TK were high in manure 2 in both years. High TC and low TN in manure 1 resulted in a high C/N ratio of 29–30. C/N ratio was 11 in manure 2 and 11–14 in manure 3.
2.3.2 Soil chemical properties
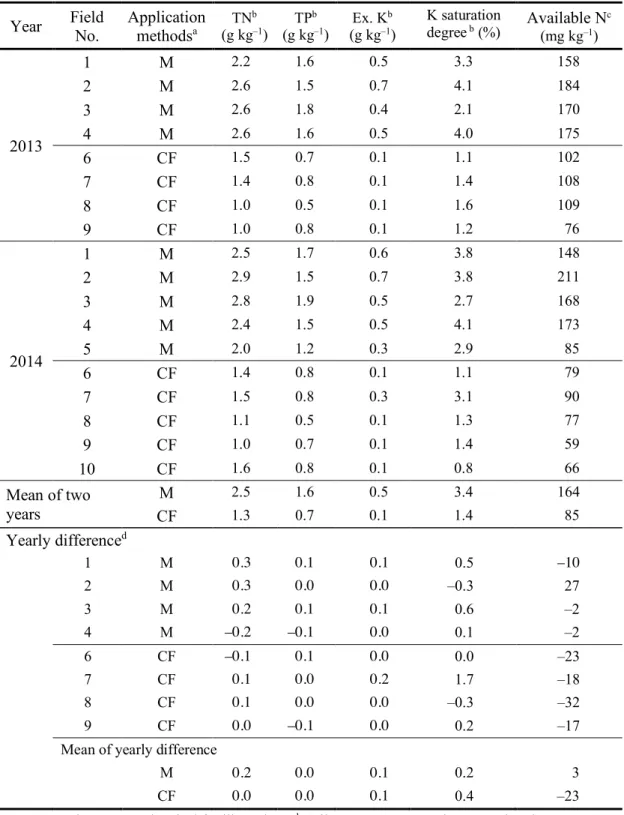
Table 2.4 shows TN, TP, Ex. K, and K saturation degree for soil after harvest and available N measured for soil before transplanting. Differences in mean values between CF and M fields showed a similar trend for all the chemical properties in both years. The mean values of the two years were higher in M (TN: 2.5 g kg−1, TP: 1.6 g kg−1, Ex. K: 0.5 g kg−1, K saturation degree: 3.4%, available N: 164 mg kg−1) than those in CF (TN: 1.3 g kg−1, TP: 0.7 g kg−1, Ex. K: 0.1 g kg−1, K saturation degree: 1.4%, available N: 85 mg kg−1). Yearly
differences of TN tended to be higher in M fields than those is CF fields, while the differences of TP and Ex. K were around 0 in both CF and M fields. For K saturation degree, relatively high yearly differences were observed in M fields (Field No. 1: 0.5%, Field No.
3: 0.6%) and in one CF field (Field No. 7: 1.7%). Yearly differences of available N in CF showed relatively large negative values consistently (−17 to −32 mg kg−1). Moreover, the values of yearly differences in M (−10 to 27 mg kg−1) were larger than those in CF.
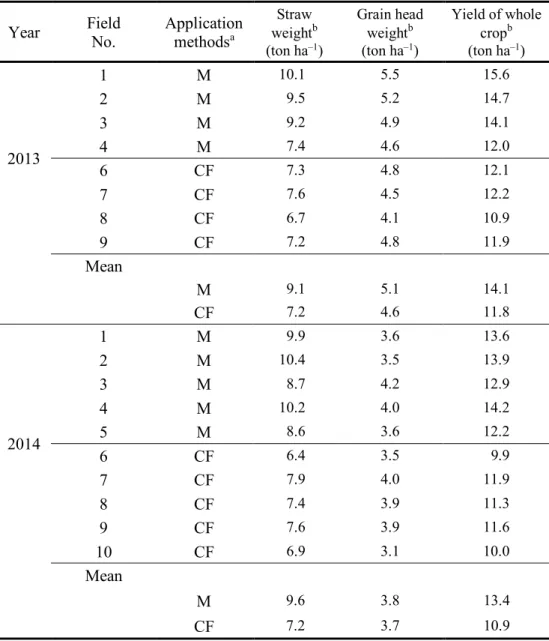
2.3.3 Yield
Table 2.5 shows straw weight, grain head weight, and yield of whole crop in each surveyed field. For straw weight and yield of whole crop, the mean values in 2013 were higher in M (straw weight: 9.1 ton ha−1; yield of whole crop: 14.1 ton ha−1) than in CF (straw weight: 7.2 ton ha−1; yield of whole crop: 11.8 Ton ha−1). The trend was same in 2014; the mean values were higher in M (straw weight: 9.6 ton ha−1; yield of whole crop: 13.4 ton ha−1) than in CF (straw weight: 7.2 ton ha−1; yield of whole crop: 10.9 ton ha−1). For grain head weight, the mean value in 2013 was higher in M (5.1 ton ha−1) than CF (4.6 ton ha−1), whereas the mean values in 2014 were similar between M (3.8 ton ha−1) and CF (3.7 ton ha−1).
Table 2.3 Physicochemical properties of applied manures
Manure Material Moisture
content
(%) pH EC
(dS m–1) NH4–N
(g kg–1) NO3–N (g kg–1) TN
(g kg–1) TP
(g kg–1) TK
(g kg–1) TC (g kg–1) C/N
ratio Waste Bulking
material 2013
1 Dairy cow Sawdust,
Rice husk 66 7.9 5.0 0.7 0.02 12.0 3.1 15.7 354.0 30 2 Beef cow Sawdust 52 6.1 10.1 5.6 0.01 26.3 12.9 26.9 295.2 11
3 Beef cow Sawdust 38 7.7 4.4 1.3 0.05 19.4 8.1 16.4 265.6 14
2014
1 Dairy cow Sawdust,
Rice husk 71 8.8 3.8 0.3 0.61 12.9 5.0 18.7 376.5 29
2 Beef cow Sawdust 50 7.9 6.0 1.1 N.D 29.5 14.8 29.1 313.4 11
3 Beef cow Sawdust 45 8.0 5.2 2.5 0.71 18.9 5.6 11.0 211.4 11
N.D = Not detected.
Table 2.4 Soil TN, TP, Ex. K, K saturation degree, and available N
Year Field No.
Application methodsa TN
b
(g kg–1) TPb
(g kg–1) Ex. Kb (g kg–1)
K saturation
degree b (%) Available Nc (mg kg–1)
2013
1 M 2.2 1.6 0.5 3.3 158
2 M 2.6 1.5 0.7 4.1 184
3 M 2.6 1.8 0.4 2.1 170
4 M 2.6 1.6 0.5 4.0 175
6 CF 1.5 0.7 0.1 1.1 102
7 CF 1.4 0.8 0.1 1.4 108
8 CF 1.0 0.5 0.1 1.6 109
9 CF 1.0 0.8 0.1 1.2 76
2014
1 M 2.5 1.7 0.6 3.8 148
2 M 2.9 1.5 0.7 3.8 211
3 M 2.8 1.9 0.5 2.7 168
4 M 2.4 1.5 0.5 4.1 173
5 M 2.0 1.2 0.3 2.9 85
6 CF 1.4 0.8 0.1 1.1 79
7 CF 1.5 0.8 0.3 3.1 90
8 CF 1.1 0.5 0.1 1.3 77
9 CF 1.0 0.7 0.1 1.4 59
10 CF 1.6 0.8 0.1 0.8 66
Mean of two years
M 2.5 1.6 0.5 3.4 164
CF 1.3 0.7 0.1 1.4 85
Yearly differenced
1 M 0.3 0.1 0.1 0.5 –10
2 M 0.3 0.0 0.0 –0.3 27
3 M 0.2 0.1 0.1 0.6 –2
4 M –0.2 –0.1 0.0 0.1 –2
6 CF –0.1 0.1 0.0 0.0 –23
7 CF 0.1 0.0 0.2 1.7 –18
8 CF 0.1 0.0 0.0 –0.3 –32
9 CF 0.0 –0.1 0.0 0.2 –17
Mean of yearly difference
M 0.2 0.0 0.1 0.2 3
CF 0.0 0.0 0.1 0.4 –23
aM = manure alone; CF = chemical fertilizer alone. b Soil TN, TP, Ex. K, and K saturation degree were measured for soil samples collected after harvest. c Available N was measured for soil samples collected before transplanting. d Yearly difference was calculated by subtracting values in 2013 from those in 2014.
Yearly difference was only calculated for fields where soil chemical properties were measured in both 2013 and 2014 (fields 1–4 and 6–9).
Table 2.5 Straw weight, grain head weight, and yield of whole crop
Year Field
No. Application methodsa
Straw weightb (ton ha–1)
Grain head weightb (ton ha–1)
Yield of whole cropb (ton ha–1)
2013
1 M 10.1 5.5 15.6
2 M 9.5 5.2 14.7
3 M 9.2 4.9 14.1
4 M 7.4 4.6 12.0
6 CF 7.3 4.8 12.1
7 CF 7.6 4.5 12.2
8 CF 6.7 4.1 10.9
9 CF 7.2 4.8 11.9
Mean
M 9.1 5.1 14.1
CF 7.2 4.6 11.8
2014
1 M 9.9 3.6 13.6
2 M 10.4 3.5 13.9
3 M 8.7 4.2 12.9
4 M 10.2 4.0 14.2
5 M 8.6 3.6 12.2
6 CF 6.4 3.5 9.9
7 CF 7.9 4.0 11.9
8 CF 7.4 3.9 11.3
9 CF 7.6 3.9 11.6
10 CF 6.9 3.1 10.0
Mean
M 9.6 3.8 13.4
CF 7.2 3.7 10.9
a M = manure alone; CF = chemical fertilizer alone. b Dry basis.
2.3.4 Relationships between clay plus silt content and soil chemical properties
Figures 2.1–2.5 show the relationships between clay plus silt content and soil TN, TP, Ex.
K, K saturation degree, and available N. The relationships showed positive correlations for TN (r = 0.831, p < 0.001, Fig. 2.1) and TP (r = 0.876, p < 0.001, Fig. 2.2) with the data pooled for the two application methods. Positive correlations lowered with the data separated for the application methods both for TN and TP. Soil TN and TP involved a large gap between CF and M at around 40% of clay plus silt content.
Ex. K (r = 0.776, p < 0.001, Fig. 2.3) and K saturation degree (r = 0.543, p < 0.01, Fig.
2.4) showed a positive correlation with clay plus silt content for the pooled data. Ex. K and K saturation degree also involved a large gap between CF and M at around 40% of clay plus silt content except for one field in CF (Field No. 7 in 2014; Table 2.4), which had higher values than other fields in CF. Unlike TN, TP and Ex. K, K saturation degree in M fields tended to decrease as clay plus silt content increased.
For available N, a positive correlation was significant with the pooled data (r = 0.701, p
< 0.001, Fig. 2.5), whereas correlations were not significant with the separated data. The available N also involved a gap between CF and M at around 40% of clay plus silt content except for one field in M (Field No. 5 in 2014; Table 2.4), which had a lower value than other fields in M.
Figure 2.1 Relationships between clay plus silt percentage and soil TN after harvest. M = manure alone; CF = chemical fertilizer alone. Pooled data means correlation was analyzed by pooling the data from M and CF.
0.0 0.5 1.0 1.5 2.0 2.5 3.0 3.5
0 20 40 60 80
Soil TN after harvest (g kg−1 )
Clay + Silt (%)
M CF
Pooled data (n = 18) r = 0.831, p < 0.001
CF (n = 9)
r = 0.660, p< 0.05 M (n = 9) r = 0.457
Figure 2.2 Relationships between clay plus silt percentage and soil TP after harvest. M = manure alone; CF = chemical fertilizer alone. Pooled data means correlation was analyzed by pooling the data from M and CF.
0.0 0.5 1.0 1.5 2.0 2.5
0 20 40 60 80
Soil TP after harvest (g kg−1 )
Clay + Silt (%)
M CF
Pooled data (n = 18) r = 0.876, p < 0.001
M (n = 9)
r = 0.692, p< 0.05
CF (n = 9)
r = 0.660, p< 0.05
Figure 2.3 Relationships between clay plus silt percentage and Ex. K after harvest. M = manure alone; CF = chemical fertilizer alone. Pooled data means correlation was analyzed by pooling the data from M and CF.
0.0 0.1 0.2 0.3 0.4 0.5 0.6 0.7 0.8
0 20 40 60 80
Ex. K after harvest (g kg−1 )
Clay + Silt (%)
M CF
Pooled data (n = 18) r = 0.776, p< 0.001
CF (n = 9)
r = 0.614, p< 0.05 M (n = 9) r = 0.239
Figure 2.4 Relationships between clay plus silt percentage and K saturation degree. M = manure alone; CF = chemical fertilizer alone. Pooled data means correlation was analyzed by pooling the data from M and CF.
0.0 1.0 2.0 3.0 4.0 5.0
0 20 40 60 80
K saturation degree (%)
Clay + Silt (%)
M CF
Pooled data (n = 18) r = 0.543, p < 0.01
M (n = 9)
r = −0.627, p < 0.05 CF (n = 9)
r = 0.360
Figure 2.5 Relationships between clay plus silt percentage and available N. The available N was measured for soil samples collected before transplanting. M = manure alone; CF = chemical fertilizer alone. Pooled data means correlation was analyzed by pooling the data from M and CF.
0 50 100 150 200 250
0 20 40 60 80
Available N (mg kg−1 )
Clay + Silt (%)
M CF
Pooled data (n = 18) r = 0.701, p< 0.001
M (n = 9) r = 0.245
CF (n = 9) r = 0.046
2.3.5 Relationships between soil TN and available N
The relationship between soil TN and available N showed a strong positive correlation with the pooled data (r = 0.897, p < 0.001, Fig. 2.6). A positive correlation was significant only for M with the separated data (r = 0.835, p < 0.01).
2.3.6 Relationships between straw weight, grain head weight, yield of whole crop, and N supply sources
Table 2.6 shows results of correlation analysis between straw weight, grain head weight, yield of whole crop and N supply sources including potential N supply and N input from basal application and topdressing. Here, potential N supply was calculated by the product of available N, soil depth (10 cm), and bulk density (1 g cm–3). Straw weight was significantly correlated with potential N supply in both 2013 (r = 0.698, p < 0.05) and 2014 (r = 0.873, p
< 0.01). Yield of whole crop showed a significant correlation with potential N supply only in 2014 (r = 0.852, p < 0.01). Correlations were not significant between straw weight, grain head weight or yield of whole crop, and N supply sources including basal application and topdressing.
Figure 2.6 Relationships between soil TN after harvest and available N. The available N was measured for soil samples collected before transplanting. M = manure alone; CF = chemical fertilizer alone. Pooled data means correlation was analyzed by pooling the data from M and CF.
0 50 100 150 200 250
0.0 1.0 2.0 3.0 4.0
Available N (mg kg−1 )
Soil TN after harvest (g kg−1)
M CF
CF (n = 9) r = 0.147
M (n = 9)
r = 0.835, p < 0.01 Pooled data (n = 18)
r = 0.897, p < 0.001
Table 2.6 Correlation analysis between straw weight, grain head weight, yield of whole crop, and N supply sources
Year Potential N supplya
Potential N supply + basal application
Potential N supply + basal application + topdressing
Straw weight 2013 0.698* 0.346 –0.176
2014 0.873** 0.629 0.389
Grain head weight 2013 0.469 0.033 –0.445
2014 0.217 0.234 0.338
Yield of whole crop 2013 0.664 0.295 –0.222
2014 0.852** 0.628 0.430
a Potential N supply was calculated by the product of available N, soil depth (10 cm), and bulk density (1 g cm–3). * = significant at p < 0.05. ** = significant at p < 0.01. Numbers of observation were 8 in 2013 and 10 in 2014.
2.4 Discussion
2.4.1 Yearly differences of soil chemical properties
Yearly differences of TN were higher in M fields (Table 2.4). However, it was not clear that manure application contributed to increases of TN because TN input from manure was not significantly correlated with increase of TN. Yearly differences of TP and Ex. K were similar in M and CF. The reason for relatively large yearly differences of K saturation degree in Field Nos. 1, 3, and 7 was not clear from data collected in this study. For available N, it was consistent that CF fields had relatively large negative values and the values of yearly differences were larger in M fields. These results might suggest that WCR cultivation without organic matter applications for 13 years (Table 2.1) in CF fields has been decreasing mineralizable part of TN in soil. Therefore, long-term study is needed to verify the possible decrease of available N in the WCR cultivation with CF alone.
2.4.2 Relationships between clay plus silt content and soil chemical properties
Close correlations between clay plus silt content and soil TN and TP (Figs. 2.1, and 2.2) were partly because fine-textured soils have a higher retention of organic matter than coarse- textured soils (Van Veen and Kuikman, 1990). A possible reason of significant correlation between clay plus silt content and Ex. K (Fig. 2.3) is a close correlation between clay plus silt content and CEC (r = 0.970, p < 0.01). Meanwhile, correlation coefficients calculated using pooled data were always higher than those calculated each for CF and M (Figs. 2.1–
2.3). Tokutsu (2002) points out that correlation coefficients can be overestimated when samples from different populations are mixed in correlation analysis. In Figs. 2.1–2.3, samples from CF are located at the lower left, while samples from M are located at the upper
right. The relative positions of data points are likely to emphasize correlations between clay plus silt content and soil TN, TP, and Ex. K.
A positive correlation between clay plus silt content and K saturation degree for the pooled data (Figs. 2.4) seemed to be mistakenly determined by relative positions of data points from CF and M. A negative correlation shown in M fields was considered more reasonable because CEC linearly increased with clay plus silt content (r = 0.970, p < 0.01).
A positive correlation shown in CF fields was because of high K saturation degree of 3.1%
at Field No. 7 in 2014 (Table 2.4).
A positive correlation between clay plus silt content and available N for the pooled data (Fig. 2.5) also seemed to be mistakenly determined by relative positions of data points from CF and M. The correlation analysis using separated data indicated that clay plus silt content was not correlated with available N.
2.4.3 Effects of fertilizer and manure application on soil chemical properties
Clear gaps of TN, TP, Ex. K, and K saturation degree between CF and M at around 40% of clay plus silt content (Figs.2.1–2.4), strongly suggested that TN, TP, Ex. K, and K saturation degree were increased by manure application. In addition, significant correlations between TN, TP, and TK input from manure and chemical fertilizer (Table 2.2) and soil TN (r = 0.852, p < 0.01), TP (r = 0875, p < 0.01), and Ex. K (r = 0.941, p < 0.01) can verify that large amounts of manure application increased the soil chemical properties, although the input was approximation based on interviews with farmers.
A gap of available N values between CF and M at around 40% of clay plus silt content also suggested that available N was increased by manure application. A significant correlation between TN input from manure and chemical fertilizer (Table 2.2) and soil
available N (r = 0.852, p < 0.01) can also verify that manure application increased the available N. Meanwhile, available N in M fields had a strong positive correlation (r = 0.835, p < 0.01) with soil TN (Fig. 2.6) unlike its relationship with clay plus silt content (Fig. 2.5).
These results implied that TN increased by manure application, which was suggested by a clear gap, contributed more to the increases in available N than TN increased by soil texture did (Fig. 2.1). A correlation between TN and available N is likely to be overestimated in the regression analysis using pooled data (Fig. 2.6).
From overall discussion, manure application increased TN, TP, Ex. K, K saturation degree and available N. However, these effects on soil chemical properties were possibly achieved by abundant amounts of manure application, which ranged from 40 to 200 ton ha−1 (Table 2.2). Excessive application of manure can cause groundwater and surface water pollution (Brandjes et al., 1996). Thus, nutrient balances in a paddy field need to be further analyzed to determine an appropriate application amount of manure.
2.4.4 Effects of fertilizer and manure application on yield
The yield of whole crop varied in the lower range of values of 9.9–12.2 ton ha−1 (mean in 2013: 11.8 ton ha−1; mean in 2014: 10.9 ton ha−1) in CF (Table 2.5). The yield range was similar to the range of 9.85–12.07 ton ha−1 (mean: 11.31 ton ha−1) obtained for Tachiaoba cultivar by Oya et al. (2014), whereas it was markedly lower than the 17.5 ton ha−1 reported by Sakai et al. (2008). Sakai et al. (2008) cultivated Tachiaoba under heavy fertilizer application of 160 kg N ha−1 in total, with 120 kg N ha−1 from basal application and 40 kg N ha−1 from topdressing. The total amount of N fertilizer application in CF—50–82 kg N ha−1, including 50–56 kg N ha−1 from basal application and 18–26 kg N ha−1 from topdressing (Table 2.2) was substantially lower than that in Sakai et al. (2008). The low N application amounts in this study were because farmers determined the amounts following