Received 18 December 2012. Accepted 28 February 2015. Corresponding author: S. Hayashi ([email protected], fax +81-11-8579300). This experiment was supported by Grants-in-Aid from the Ministry of Agriculture, Forestry and Fisheries of Japan (“Development of technologies for improvement of efficient feed production and usage based on the increase in the amount of self-supplied feed”).
Comparison of Two High-Yielding Rice Varieties, Kita-aoba and
Tachijobu, for Hokkaido, Northern Japan, and Effects of Swine
Compost Application on the Growth and Grain Yield of Tachijobu
Satoshi Hayashi
(NARO Hokkaido Agricultural Research Center, 1, Hitsujigaoka, Toyohira, Sapporo 062-8555, Japan)
Abstract: The grain yield of two high-yielding rice varieties, Kita-aoba and Tachijobu, was examined
in a field experiment by using swine compost at a rate of 0, 1 and 2 kg m
–2and chemical fertilizer
at a rate of 5.25, 7.35, and 10.5 g N m
–2in 2010, and 5.25 and 10.5 g N m
–2in 2011 (Exp. 1). The
grain yield of Tachijobu was also evaluated by applying compost at a rate of 0 or 2 kg m
–2and
chemical fertilizer at a rate of 5.25, 10.5, and 15.75 g N m
–2from 2011 to 2013 (Exp. 2). Tachijobu
had a lower grain yield than Kita-aoba under the same fertilizer management in Exp. 1 due to its
lower sink production efficiency, but it showed the highest grain yield of 1085 g m
–2at the highest
fertilizer level in Exp. 2. A significant interaction between compost application and nitrogen
fertilizer level was observed in grain yield and nitrogen uptake in Tachijobu in Exp. 2, and the
nitrogen uptake in Tachijobu reached its maximum at around 15 g m
–2at maturity. In addition, the
apparent nitrogen use efficiency of compost (NUE
compost) was higher at a lower nitrogen fertilizer
level. From the nitrogen uptake and NUE
compostat each fertilizer level, the optimum rates of
compost and fertilizer were discussed. The compost also increased the concentration of protein in
Tachijobu (significantly in 2013).
Key words: Fertilizer management, Forage rice, Manure. High-yielding forage rice is important as a substitute for imported, concentrated feed to improve forage self-sufficiency in Japan. In 2008, Kita-aoba (formerly called Hokkaishi308) was released as a high-yielding variety in Hokkaido (Shimizu et al., 2008), and Hayashi et al. (2012) reported that the yield potential of Kita-aoba was more
than 1000 g m–2. In 2010, Tachijobu was released as a
high-yielding variety in Hokkaido. Tachijobu matures later and is more tolerant to lodging, low temperatures, and blast than Kita-aoba, but its yielding performance needs to be studied.
High-yielding varieties require large amounts of nitrogen (Horie et al., 2005; Mae, 2011). Compost can be used as a source of nitrogen and other nutrients, and its effectiveness has been reported in many crops (Diacono and Montemurro, 2009). The combined use of compost and chemical fertilizers could help reduce the amount of chemical fertilizers used. Effective use of compost from farm-animal wastes is desirable, especially for forage rice, from the viewpoint of nutrient recycling. Another advantage of compost application is that it reduces the negative effects of low temperatures. High concentrations of plant nitrogen from panicle initiation to the young
microspore stage aggravate floral sterility due to low-temperature damage (Satake et al., 1987; Tatsuta, 1999. This floral sterility can be reduced by using compost (Amano and Moriwaki, 1984). In Hokkaido, the nitrogen fertilizer for rice, a staple food, has been recommended to
be reduced by 1.5 to 2 g m–2 (Department of Agriculture,
Hokkaido, 2010). However, there is no information on nitrogen concentrations for high-yielding rice varieties, which would have higher nitrogen fertilizer-use efficiency for biomass production than rice varieties used as a staple food (Taylaran et al., 2009).
Several types of compost from farm-animal wastes are available in Japan. Swine or poultry compost is more easily mineralized in soil and used by rice than cattle compost (Nishida et al., 2005; Nishida, 2011). However, mineralization of organic nitrogen in compost depends on the temperature (Nishida et al., 2008; Nishida, 2011), and nitrogen in compost may not be utilized efficiently in Hokkaido at low temperatures. In this study, we compared the yields of Tachijobu with Kita-aoba, and investigated the nitrogen use efficiency of swine compost for Tachijobu to estimate the suitable combination of compost and fertilizer rate for high grain yield.
Materials and Methods 1. Cultivation management
Two field experiments were conducted in a paddy field (Andosol) at the National Agriculture and Food Research Organization/Hokkaido Agricultural Research Center (NARO/HARC; Sapporo, Hokkaido, Japan; 43º0΄N, 141º25΄E).
(1) Exp. 1: Comparison of Kita-aoba and Tachijobu A field experiment was conducted in 2010 and 2011. We used a strip-split plot design, with three replications. The horizontal factor was variety (Kita-aoba and Tachijobu), and vertical factor was swine compost levels (0, 1, and 2 kg
m–2). The chemical properties of swine compost are listed
in Table 1. As the subplot factor, three basal chemical fertilizer levels (5.25, 10.5, and 15.75 g N m–2) were used in
2010, and two levels (5.25, and 10.5 g N m–2) in 2011. The
fertilizer contained 14:17:12% of N:P2O5:K2O (a mixture of
urea and ammonium, no control-release fertilizer was
included), and the amount of P2O5 and K2O paralleled
that of N. The size of each subplot was 3.5 × 4 m. The sowing dates were April 14 and 13, in 2010 and 2011, respectively, and the transplanting dates were May 20 and 19, respectively. Plants were transplanted using a transplanting machine. Planting density was 18.4 and 20.9 hills m–2
in 2010 and 2011, respectively. Standing water was maintained from the time the plants were transplanted to the end of August (mid-grain-filling stage), at a depth of approximately 5 cm.
(2) Exp. 2: Compost and fertilizer management for Tachijobu
A field experiment was conducted from 2011 to 2013. The experimental design was a split plot design, with three
replications. The main factor was swine compost
application (0 and 2 kg m–2). The compost application of 1
kg m–2 was omitted in Exp. 2 since the effect of compost on
rice growth was not large in Exp. 1. The chemical properties of swine compost are shown in Table 1. As a subplot factor, three basal nitrogen fertilizer levels were
used (5.25, 10.5, and 15.75 g N m–2
) all 3 years. In 2011, the
same fertilizer used in Exp. 1 (14:17:12% of N:P2O5:K2O)
was used, and the amount of P2O5 and K2O paralleled that
of N. In 2012 and 2013, only nitrogen (ammonia sulfate) was applied. The size of each subplot was 3.5 × 4 m. The dates of sowing and transplanting were the same as in Exp. 1 in 2011. The sowing dates were April 11 and 10, in 2012 and 2013, respectively, and the transplanting dates were May 21 and 23, respectively. Planting density was 20.2 and
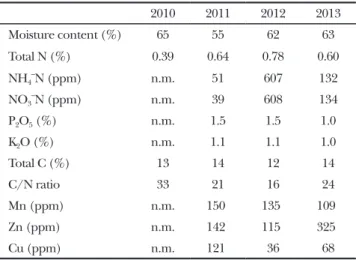
Table 1. Chemical properties of the swine compost applied from 2010 to 2013. 2010 2011 2012 2013 Moisture content (%) 65 55 62 63 Total N (%) 0.39 0.64 0.78 0.60 NH4–N (ppm) n.m. 51 607 132 NO3–N (ppm) n.m. 39 608 134 P2O5 (%) n.m. 1.5 1.5 1.0 K2O (%) n.m. 1.1 1.1 1.0 Total C (%) 13 14 12 14 C/N ratio 33 21 16 24 Mn (ppm) n.m. 150 135 109 Zn (ppm) n.m. 142 115 325 Cu (ppm) n.m. 121 36 68
Concentration is expressed as wet basis. n.m. indicates the property was not measured.
Table 2. Mean air temperature and solar radiation from 2010 to 2013, and the average values for 1981 to 2010.
2010 2011 2012 2013 1981 to 2010Average of Mean air temperature (ºC)
May 10.8 10.1 11.8 10.0 10.9 June 17.6 16.2 15.4 16.2 15.1 July 20.8 20.5 20.1 20.8 18.9 August 23.2 21.9 21.9 21.6 20.7 September 18.3 17.8 20.8 17.3 16.6 October 14.1 10.6 11.7 11.5 10.3 Average of May to October 17.5 16.2 16.9 16.2 15.4 Solar radiation (MJ m–2 day–1)
May 18.0 15.6 19.6 15.5 17.7 June 20.4 16.6 21.3 22.2 18.9 July 13.7 18.6 19.8 19.3 17.1 August 15.2 17.3 15.2 14.2 15.6 September 14.3 10.9 13.1 12.2 12.9 October 9.4 8.9 9.5 8.9 9.3 Average of May to October 15.2 14.7 16.4 15.3 15.3
Table 3. Heading date and harvest date across years and varieties.
Year Variety Heading date Harvest date
2010 Kita-aoba 27 July 24 September
Tachijobu 1 August 1 October
2011 Kita-aoba 1 August 29 September
Tachijobu 7 August 3 October
2012 Tachijobu 6 August 2 October
2013 Tachijobu 5 August 2 October
Exp. 1: 2010 and 2011.
21.6 hills m–2 in 2012 and 2013, respectively.
2. Measurements
Air temperature was measured at the meteorological station in NARO/HARC. Six hills of rice were taken from the ground level to determine shoot dry matter at heading stage (50% of the panicles showed heading). Nitrogen uptake at heading was also measured in 2012 and 2013. At maturity when 90% of the spikelets became yellow, lodging was scored on a scale of 0 (no lodging) to 5 (complete
lodging), and the plants in an area of 3 m2 were harvested
at ground level to determine shoot dry matter, gross
hulled-grain yield (moisture content, 15% w w–1; hereafter
referred to as “grain yield”), yield components (number of
panicles per area, number of spikelets per panicle, percentage of ripened grains, and weight of the ripened grain), and nitrogen uptake. Hulled grains thicker than 1.8 mm were regarded as ripened grains. Sink capacity, percentage of sink filled, sink production efficiency, and
apparent nitrogen-use efficiency of compost (NUEcompost)
was calculated using the following equations:
Sink capacity = (Spikelet number per area) × (Weight of a single grain thicker than 1.8 mm)
Percentage of sink filled = (Grain yield) / (Sink capacity) × 100
Sink production efficiency = (Sink capacity) / (Shoot dry matter at heading)
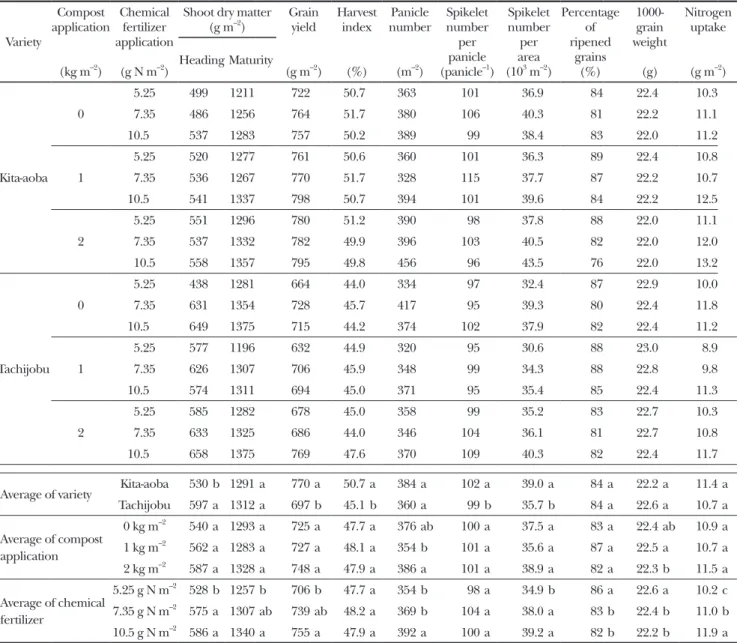
Table 4. Biomass production, grain yield, yield components, and nitrogen uptake in 2010 in Exp. 1. Variety Compost application (kg m–2) Chemical fertilizer application (g N m–2)
Shoot dry matter (g m–2) Grainyield (g m–2) Harvest index (%) Panicle number (m–2) Spikelet number per panicle (panicle–1) Spikelet number per area (103 m–2) Percentage of ripened grains (%) 1000-grain weight (g) Nitrogen uptake (g m–2) Heading Maturity Kita-aoba 0 5.25 499 1211 722 50.7 363 101 36.9 84 22.4 10.3 7.35 486 1256 764 51.7 380 106 40.3 81 22.2 11.1 10.5 537 1283 757 50.2 389 99 38.4 83 22.0 11.2 1 5.25 520 1277 761 50.6 360 101 36.3 89 22.4 10.8 7.35 536 1267 770 51.7 328 115 37.7 87 22.2 10.7 10.5 541 1337 798 50.7 394 101 39.6 84 22.2 12.5 2 5.25 551 1296 780 51.2 390 98 37.8 88 22.0 11.1 7.35 537 1332 782 49.9 396 103 40.5 82 22.0 12.0 10.5 558 1357 795 49.8 456 96 43.5 76 22.0 13.2 Tachijobu 0 5.25 438 1281 664 44.0 334 97 32.4 87 22.9 10.0 7.35 631 1354 728 45.7 417 95 39.3 80 22.4 11.8 10.5 649 1375 715 44.2 374 102 37.9 82 22.4 11.2 1 5.25 577 1196 632 44.9 320 95 30.6 88 23.0 8.9 7.35 626 1307 706 45.9 348 99 34.3 88 22.8 9.8 10.5 574 1311 694 45.0 371 95 35.4 85 22.4 11.3 2 5.25 585 1282 678 45.0 358 99 35.2 83 22.7 10.3 7.35 633 1325 686 44.0 346 104 36.1 81 22.7 10.8 10.5 658 1375 769 47.6 370 109 40.3 82 22.4 11.7
Average of variety Kita-aoba 530 b 1291 a 770 a 50.7 a 384 a 102 a 39.0 a 84 a 22.2 a 11.4 a
Tachijobu 597 a 1312 a 697 b 45.1 b 360 a 99 b 35.7 b 84 a 22.6 a 10.7 a Average of compost application 0 kg m–2 540 a 1293 a 725 a 47.7 a 376 ab 100 a 37.5 a 83 a 22.4 ab 10.9 a 1 kg m–2 562 a 1283 a 727 a 48.1 a 354 b 101 a 35.6 a 87 a 22.5 a 10.7 a 2 kg m–2 587 a 1328 a 748 a 47.9 a 386 a 101 a 38.9 a 82 a 22.3 b 11.5 a Average of chemical fertilizer 5.25 g N m–2 528 b 1257 b 706 b 47.7 a 354 b 98 a 34.9 b 86 a 22.6 a 10.2 c 7.35 g N m–2 575 a 1307 ab 739 ab 48.2 a 369 b 104 a 38.0 a 83 b 22.4 b 11.0 b 10.5 g N m–2 586 a 1340 a 755 a 47.9 a 392 a 100 a 39.2 a 82 b 22.2 b 11.9 a
Different alphabets indicate the significant effect of variety, compost application, or chemical fertilizer concentrations at the 5% level, according to the LSD test.
NUEcompost = ([Nitrogen uptake with compost application]
– [Nitrogen uptake without compost application]) / (Nitrogen content in applied compost) × 100
Analysis of variance (ANOVA) for the strip-split plot design (Exp. 1) and split plot design over years (Exp. 2) was conducted, using the method of Gomez and Gomez (1984). Fisher’s least significant difference (LSD) test and Tukey’s honestly significant difference (HSD) test was used for significant main effects and interactions detected by ANOVA, respectively. Statistical analysis was conducted by SYSTAT 13 for Windows (SYSTAT, Software Inc., Chicago, IL, USA).
Results
The mean air temperature during the cropping season was generally higher than the average value for 1981 to 2010 (Table 2). Especially, those in 2010 and 2012 were high, and the temperature in September in 2012 was higher than the average in August. Solar radiation in 2010 was low in July, but its average value from May to October was equal to the average of 30 years. In 2011, solar radiation was slightly lower than the average value, except in July and August. Solar radiation in 2012 was generally
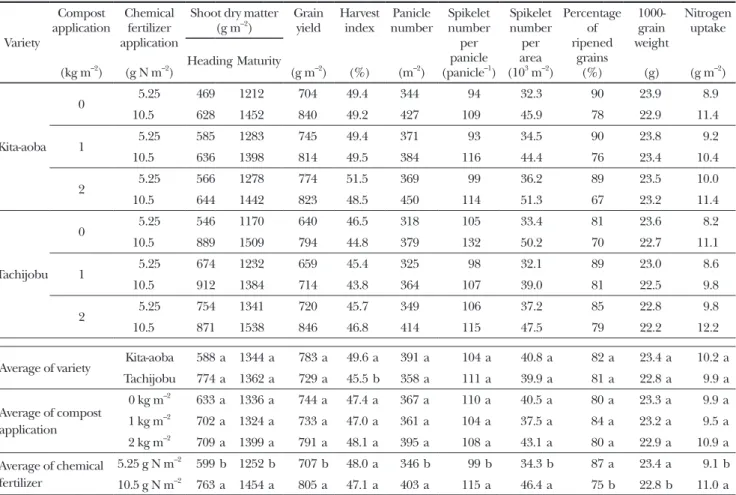
Table 5. Biomass production, grain yield, yield components, and nitrogen uptake in 2011 in Exp. 1. Variety Compost application (kg m–2) Chemical fertilizer application (g N m–2)
Shoot dry matter (g m–2) Grainyield (g m–2) Harvest index (%) Panicle number (m–2) Spikelet number per panicle (panicle–1) Spikelet number per area (103 m–2) Percentage of ripened grains (%) 1000-grain weight (g) Nitrogen uptake (g m–2) Heading Maturity Kita-aoba 0 5.25 469 1212 704 49.4 344 94 32.3 90 23.9 8.9 10.5 628 1452 840 49.2 427 109 45.9 78 22.9 11.4 1 5.25 585 1283 745 49.4 371 93 34.5 90 23.8 9.2 10.5 636 1398 814 49.5 384 116 44.4 76 23.4 10.4 2 5.25 566 1278 774 51.5 369 99 36.2 89 23.5 10.0 10.5 644 1442 823 48.5 450 114 51.3 67 23.2 11.4 Tachijobu 0 5.25 546 1170 640 46.5 318 105 33.4 81 23.6 8.2 10.5 889 1509 794 44.8 379 132 50.2 70 22.7 11.1 1 5.25 674 1232 659 45.4 325 98 32.1 89 23.0 8.6 10.5 912 1384 714 43.8 364 107 39.0 81 22.5 9.8 2 5.25 754 1341 720 45.7 349 106 37.2 85 22.8 9.8 10.5 871 1538 846 46.8 414 115 47.5 79 22.2 12.2
Average of variety Kita-aoba 588 a 1344 a 783 a 49.6 a 391 a 104 a 40.8 a 82 a 23.4 a 10.2 a
Tachijobu 774 a 1362 a 729 a 45.5 b 358 a 111 a 39.9 a 81 a 22.8 a 9.9 a Average of compost application 0 kg m–2 633 a 1336 a 744 a 47.4 a 367 a 110 a 40.5 a 80 a 23.3 a 9.9 a 1 kg m–2 702 a 1324 a 733 a 47.0 a 361 a 104 a 37.5 a 84 a 23.2 a 9.5 a 2 kg m–2 709 a 1399 a 791 a 48.1 a 395 a 108 a 43.1 a 80 a 22.9 a 10.9 a Average of chemical fertilizer 5.25 g N m–2 599 b 1252 b 707 b 48.0 a 346 b 99 b 34.3 b 87 a 23.4 a 9.1 b 10.5 g N m–2 763 a 1454 a 805 a 47.1 a 403 a 115 a 46.4 a 75 b 22.8 b 11.0 a
Different alphabets indicate the significant effect of variety, compost application, or chemical fertilizer concentrations at the 5% level, according to the LSD test.
higher than the average, and was the highest of the 4 years (2010 – 2013). Heading dates and harvest dates of Kita-aoba and Tachijobu in 2010 – 2013 are shown in Table 3. 1. Exp. 1: Comparison of Kita-aoba and Tachijobu
Although Kita-aoba showed severe lodging (score = 5.0) at the late grain-filling stage in all treatments, it produced a significantly higher grain yield than Tachijobu because of its larger spikelet number per area in 2010 (Table 4). The application of more chemical fertilizer resulted in higher nitrogen uptake, more shoot dry matter at maturity, and higher grain yield due to more panicles and spikelets per area.
In 2011, Kita-aoba tended to show higher grain yield than Tachijobu, but the difference was not significant (Table 5). The effect of compost on grain yield was not detected, but more fertilizer application increased shoot dry matter, grain yield, panicle or spikelet number, and nitrogen uptake. Lodging (score = 3.0) was observed in
Kita-aoba when 2 kg m–2 of swine compost and a high level
of chemical fertilizer were applied; however, a lodging score of 1.0 or more was not observed in the other treatments.
2. Exp. 2: Compost and fertilizer management for Tachijobu
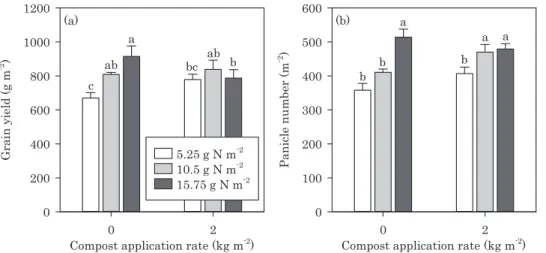
A significant interaction between compost and nitrogen fertilizer rate was detected in grain yield and panicle number in 2011 – 2013 (Fig. 3). Grain yield increased with nitrogen fertilizer in the plots without compost, but there was no difference among the three nitrogen fertilizer levels
applied with 2 kg m–2
of compost. The effect of nitrogen fertilizer on panicle number was also larger in the plots
Fig. 1. Relationship between shoot dry matter at heading and sink capacity (a), and sink production efficiency (b) in Exp. 1.
*** in (a) indicates linear regression was singnificant at P = 0.001 level. All levels of compost and nitrogen fertilizer were averaged in (b). Capped vertical bars indicate standard errors (n = 27 for 2010 and 18 for 2011). * indicates that the difference between varieties was significant at P = 0.05 level within a year.
and sink capacity showed that Kita-aoba produced sink more efficiently than Tachijobu (Fig. 1). At all compost and chemical nitrogen levels, Kita-aoba had better sink production efficiency than Tachijobu in both years, and it resulted in a significantly larger spikelet number per area in 2010. Tachijobu showed slightly more shoot dry matter at maturity than Kita-aoba at the same nitrogen uptake level in 2010, but Kita-aoba showed a higher grain yield than Tachijobu (Fig. 2).
Fig. 2. Relationship between nitrogen uptake at maturity and shoot dry matter (a) and grain yield (b) for Kita-aoba and Tachijobu in Exp. 1.
Linear or quadratic regressions were evaluated. ** and *** indicate that the regression was significant at P = 0.01 and 0.001, respectively.
without compost. This interaction in panicle number was reflected in spikelet number per area, showing a similar tendency (P = 0.103). The significant interaction with grain yield was also attributed to the biomass production during the grain-filling stage. Shoot dry matter at heading significantly increased with the application of nitrogen fertilizer (Fig. 4). Compost tended to increase shoot dry matter at heading. A significant interaction was observed between compost application and nitrogen fertilizer rate in the increment of biomass after heading. Biomass production after heading was higher in the plots with a higher rate of nitrogen fertilizer in the plots without compost, but nitrogen fertilizer did not affect biomass production in the plots with compost. There was an interaction between compost and chemical fertilizer rate in nitrogen uptake at maturity (Fig. 5). The effect of nitrogen fertilizer on nitrogen uptake was large in the plots without compost, but the effect of nitrogen fertilizer was small in the plots with compost. The nitrogen uptake
obtained in the plots with 10.5 g N m–2
fertilizer and 2 kg m–2
of compost was similar to that obtained in the plots
Fig. 3. Grain yield (a) and panicle number (b) of Tachijobu (average of 2011 to 2013) in Exp. 2.
Capped vertical bars indicate standard errors (n = 9). Different alphabets indicate significant difference at P = 0.05 level by Tukey’s HSD test.
Fig. 4. Relationship between shoot dry matter at heading and the increase of shoot dry matter during grain-filling stage.
Broken lines indicate the shoot dry matter at maturity (1200 to 1800 g m–2). Bold horizontal bar indicates Fisher’s LSD at P =
0.05 level for nitrogen fertilizer level in shoot dry matter at heading. Different alphabets beside the legends indicate significant difference at P = 0.05 level by Tukey’s HSD test for the increase of shoot dry matter during grain-filling stage.
Fig. 5. Nitrogen uptake at maturity (a) and nitrogen use efficiency of compost (b) of Tachijobu (average of 2011 to 2013) in Exp. 2.
Capped vertical bars indicate standard errors (n = 9). Different alphabets indicate significant difference at P = 0.05 level by Tukey’s HSD test for (a) and Fisher’s LSD test for (b).
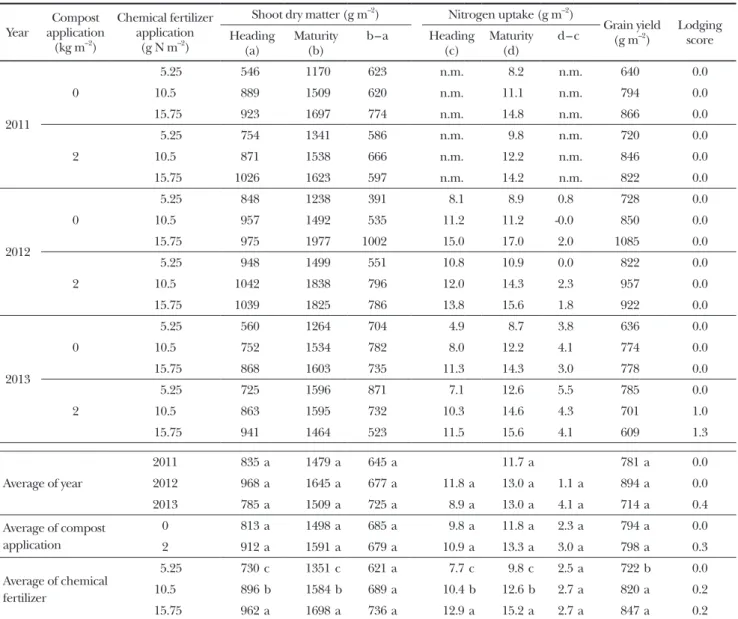
Table 6. Shoot dry matter, nitrogen uptake, grain yield and lodging score in Exp. 2. Year applicationCompost
(kg m–2)
Chemical fertilizer application
(g N m–2)
Shoot dry matter (g m–2) Nitrogen uptake (g m–2)
Grain yield
(g m–2) Lodgingscore
Heading
(a) Maturity(b) b–a Heading(c) Maturity(d) d–c
2011 0 5.25 546 1170 623 n.m. 8.2 n.m. 640 0.0 10.5 889 1509 620 n.m. 11.1 n.m. 794 0.0 15.75 923 1697 774 n.m. 14.8 n.m. 866 0.0 2 5.25 754 1341 586 n.m. 9.8 n.m. 720 0.0 10.5 871 1538 666 n.m. 12.2 n.m. 846 0.0 15.75 1026 1623 597 n.m. 14.2 n.m. 822 0.0 2012 0 5.25 848 1238 391 8.1 8.9 0.8 728 0.0 10.5 957 1492 535 11.2 11.2 -0.0 850 0.0 15.75 975 1977 1002 15.0 17.0 2.0 1085 0.0 2 5.25 948 1499 551 10.8 10.9 0.0 822 0.0 10.5 1042 1838 796 12.0 14.3 2.3 957 0.0 15.75 1039 1825 786 13.8 15.6 1.8 922 0.0 2013 0 5.25 560 1264 704 4.9 8.7 3.8 636 0.0 10.5 752 1534 782 8.0 12.2 4.1 774 0.0 15.75 868 1603 735 11.3 14.3 3.0 778 0.0 2 5.25 725 1596 871 7.1 12.6 5.5 785 0.0 10.5 863 1595 732 10.3 14.6 4.3 701 1.0 15.75 941 1464 523 11.5 15.6 4.1 609 1.3 Average of year 2011 835 a 1479 a 645 a 11.7 a 781 a 0.0 2012 968 a 1645 a 677 a 11.8 a 13.0 a 1.1 a 894 a 0.0 2013 785 a 1509 a 725 a 8.9 a 13.0 a 4.1 a 714 a 0.4 Average of compost application 0 813 a 1498 a 685 a 9.8 a 11.8 a 2.3 a 794 a 0.0 2 912 a 1591 a 679 a 10.9 a 13.3 a 3.0 a 798 a 0.3 Average of chemical fertilizer 5.25 730 c 1351 c 621 a 7.7 c 9.8 c 2.5 a 722 b 0.0 10.5 896 b 1584 b 689 a 10.4 b 12.6 b 2.7 a 820 a 0.2 15.75 962 a 1698 a 736 a 12.9 a 15.2 a 2.7 a 847 a 0.2
n.m. indicates not measured.
Different alphabets indicate the significant effect of variety, compost application, or chemical fertilizer concentrations at the 5% level, according to the LSD test.
spikelets per panicle. Application of nitrogen fertilizer significantly increased the concentration of protein in brown rice in all 3 years (Fig. 7). Although there was no significant difference in the effect of compost and the interaction between compost and nitrogen fertilizer in the average of 3 years, compost application resulted in significantly higher protein concentration in 2013. Compost tended to increase protein concentration also in 2011 (P = 0.092).
Discussion
Grain yield was significantly lower (Table 4, 2010) or tended to be lower (Table 5, 2011) in Tachijobu than in Kita-aoba under the same fertilizer management. Lower sink production efficiency in Tachijobu (Fig. 1) may be one cause of this slightly lower grain yield. Tachijobu with a
with 15.75 g N m–2
fertilizer without compost. The nitrogen
uptake obtained in the plots with 5.25 g N m–2 fertilizer
with compost was similar to that obtained with 10.5 g N m–2
fertilizer without compost. NUEcompost was around 0% in
the plots with 15.75 g N m–2 fertilizer, but increased in the
plots with 5.25 and 10.5 g Nm–2 fertilizer. Although
Tachijobu was a lodging-tolerant variety, lodging was observed in the plots with compost in 2013, with nitrogen
uptake of 15 to 16 g m–2
, and yield was low in those plots (Table 6). Excluding the plots with lodging, there was a linear regression between nitrogen uptake and grain yield
(Fig. 6). The grain yield was highest (1085 g m–2) in the
plots with 15.75 g N m–2 fertilizer without compost in 2012
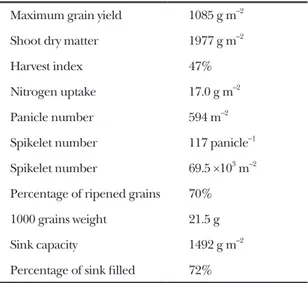
(Table 7). The high grain yield was attributed to large spikelet number per area, derived from the large number of panicles per area and large panicle size, i.e., many
Table 7. The highest grain yield and yield-related factors achieved in Exp. 2.
Maximum grain yield 1085 g m–2
Shoot dry matter 1977 g m–2
Harvest index 47%
Nitrogen uptake 17.0 g m–2
Panicle number 594 m–2
Spikelet number 117 panicle–1
Spikelet number 69.5 ×10³ m–2
Percentage of ripened grains 70% 1000 grains weight 21.5 g
Sink capacity 1492 g m–2
Percentage of sink filled 72%
The highest grain yield was achieved in 2012, with the fertilizer level of 15.75 g N m–2 without compost.
later heading date had more shoot dry matter than Kita-aoba at heading, as reported previously (Nakano et al. 2008; Nakano and Morita 2009). However, spikelet number per area was smaller in Tachijobu than in
Kita-Fig. 6. Relationship between nitrogen uptake at maturity and grain yield in Exp. 2.
–C and +C indicates plots without and with compost, respectively. Linear regression was drawn for plots without severe lodging. *** indicates the regression was significant at P = 0.001 level.
Fig. 7. The concentration of protein in brown rice of Tachijobu from 2011 to 2013 in Exp. 2.
Capped vertical bars indicate standard errors (n = 3). Bold vertical bars indicate Fisher’s LSD at P = 0.05 level for nitrogen fertilizer level or compost level.
aoba (significantly 2010 and tendency in 2011). This lower sink production efficiency could be due to the panicle number which tended to be smaller in Tachijobu than in Kita-aoba in both 2010 and 2011. Although the shoot dry
matter was highest at heading, less biomass was produced during the grain-filling stage in Tachijobu than in Kita-aoba (significantly in 2011 and not significantly in 2010), and shoot dry matter at maturity did not differ significantly between the two varieties.
However, the linear relationship between nitrogen uptake and grain yield of Tachijobu suggested that grain yield could be further increased by increasing nitrogen uptake. Actually, Tachijobu showed the highest grain yield
of 1085 g m–2
in the plot with 15.75 g N m–2
(Table 7), and showed a high yield potential with sufficient nitrogen application. This highest grain yield was similar to that of
Kita-aoba (1081 g m–2) reported previously (Hayashi et
al.,2012) in spite of the smaller number of spikelet per area and higher percentage of ripened grains in Tachijobu. The use of compost to replace chemical fertilizer will help reduce the fertilizer cost in forage rice, which is an important issue, especially for varieties like Tachijobu, which requires higher level of nitrogen uptake.
A significant interaction between compost application and nitrogen fertilizer level was observed in the grain yield of Tachijobu in Exp. 2 (Fig. 3). This was attributed to its panicle number and nitrogen uptake (Fig. 5) which showed similar interactions. Nitrogen uptake at the highest
nitrogen fertilizer level with compost was around 15 g m–2
, and did not significantly differ from that without compost application. This suggested that nitrogen uptake of
Tachijobu reached its maximum at around 15 g m–2. This
limitation in nitrogen uptake might be due to excessive growth at the highest nitrogen fertilizer level with compost. Although not significant, compost tended to increase shoot dry matter at heading, and that at the highest
nitrogen fertilizer level reached 1000 g m–2 (Fig. 4).
However, biomass production in the grain-filling stage was not increased. Another reason was that lodging occurred
after the heavy rain (70.5 mm day–1) during the
mid-grain-filling stage in 2013 in the plot with compost and high
nitrogen fertilizer rate (15.75 g N m–2
). Although Tachijobu is a lodging-tolerant variety, lodging might occur
when nitrogen uptake reaches 15 g m–2 (Fig. 6). These
results suggested that the combination of 2 kg m–2 of
compost and 10.5 g m–2 of nitrogen fertilizer was
appropriate in the combinations examined in the present study from the viewpoints of grain yield and nitrogen uptake. Compost also increased the concentration of protein in brown rice (Fig. 7, significantly in 2013). A high concentration of protein is desirable for forage rice as concentrated feed. This was in contrast to a previous report that compost had no effect on the concentration of protein (Saha et al. 2007).
NUEcompost was the highest (19%) at the lowest fertilizer
level (5.25 g N m–2) in this study, and 2 kg of compost
(0.68% of nitrogen, average of 3 years) could supply 2.5 g of nitrogen to rice (Fig. 5). Since the nitrogen uptake in
the plot with 5.25 N m–2
fertilizer was 8.6 g m–2
without
compost, application of approximately 5 kg m–2
of compost
with 5.25 g N m–2 fertilizer may increase the nitrogen
uptake to 15 g m–2. However, the effect of compost on rice
growth depends on the percentage of inorganic nitrogen. The concentration of inorganic nitrogen in the compost used in the present study greatly varied with the year (Table 1). This variation could be due to the maturity of compost (C/N ratio), and the inorganic nitrogen level was highest in 2012 which had a low compost C/N ratio. The quality of compost as a nitrogen source should be investigated prior to application. In addition, nitrogen from compost is generally utilized in a later growth period in rice (Nishida et al., 2008). Also in the present study, the rate of nitrogen uptake from compost tended to be higher in the
grain-filling stage 3.0 and 2.3 g m–2
, in the plots with compost and without compost, respectively, than at the heading
stage, 10.9 and 9.8 g m–2, respectively, the difference being
32 and 12%, respectively (Table 6). This result suggested that the increase of compost and reduction of chemical nitrogen could reduce the nitrogen supply in the earlier growth stage and affect the yield components determined earlier such as panicle number. The effects of residual nitrogen (discussed below), surplus minerals, and the accumulation of heavy metals should also be taken into consideration when applying more compost than the rate examined in the present study.
Compost was applied every year for 4 years (application starting from 2010, a year before the beginning of Exp. 2)
in Exp. 2, and NUEcompost was 5.6, 7.6 and 20.9% in 2011,
2012 and 2013, respectively, showing a tendency of increase with the year. Nitrogen uptake at maturity in plots with compost also tended to increase from 2011, especially
in the plot with 5.25 g N m–2, while that without compost
was relatively stable (Table 6). Total nitrogen in soil measured after the harvest in 2013 also tended to be higher in plots with compost (0.30%) than in those without compost (0.27%). Although not significant (P = 0.188 by ANOVA with 3 replications), these results suggested the residual effect of swine compost. Mineralization of organic nitrogen under low-temperature conditions is suppressed (Nishida et al., 2005; Nishida, 2011), and the residual effects of compost have been reported to be larger in an area with lower temperatures (Ueno and Yamamuro, 2001; Matsuyama et al., 2003; Nishida et al., 2008). These findings suggested that the amount of applied fertilizer could be reduced by long use of compost. The effect of long-term application requires further study. Although an excess of manganese, zinc, and copper in the soil sometimes occurs with swine compost application (Hsu and Lo, 2000), an excess of those elements was not observed in the present study (data not shown). However, the effect of long-term application on the accumulation of heavy metals should be carefully
investigated, together with the residual effect of nitrogen. Conclusions
Grain yield was significantly lower or tended to be lower in Tachijobu than in Kita-aoba under the same fertilizer management in Exp. 1. However, Tachijobu showed the
highest grain yield of 1085 g m–2 at the fertilizer level of
15.75 g N m–2
in Exp. 2. A significant interaction between compost application and nitrogen fertilizer level was observed in grain yield and nitrogen uptake of Tachijobu in Exp. 2, and the nitrogen uptake of Tachijobu reached
its maximum at around 15 g m–2 at maturity. NUE
compost was
higher at a lower nitrogen fertilizer level. From the
nitrogen uptake and NUEcompost at each fertilizer level, the
optimum rate of compost and fertilizer was discussed. Compost also increased the concentration of protein in Tachijobu.
References
Amano, T. and Moriwaki, R. 1984. Studies on cool injuries with special reference to cultural improvements in rice plants. III. The effect of compost application on cool temperature-induced sterility at the booting stage. Jpn. J. Crop Sci. 53: 7-11.
Department of Agriculture, Hokkaido. 2010. Hokkaido fertilizer recommendations 2010. Department of Agriculture, Hokkaido. Sapporo. 1-235**.
Diacono, M. and Montemurro, F. 2009. Long-term effects of organic amendments on soil fertility. A review. Agron. Sustain. Dev. 30: 401-422.
Gomez, K.A. and Gomez, A.A. 1984. Statistical procedures for agricultural research, 2nd ed. John Wiley & Sons, New York. 1-680. Hayashi, S., Ohshita, Y., Kimiwada, K., Tsuji, H., Ushiki, J., Miyaura, S.
and Shibuya, Y. 2012. Yielding performance of “Kita-aoba”, high-yielding rice variety for Hokkaido region, Northern Japan. Plant Prod. Sci. 15: 209-215.
Horie, T., Shiraiwa, T., Homma, K., Katsura, K., Maeda, S, and Yoshida, H. 2005. Can yields of lowland rice resume the increases that they showed in the 1980s? Plant Prod. Sci. 8: 259-274.
Hsu, J.H. and Lo, S.L. 2000. Characterization and extractability of copper, manganese and zinc in swine manure composts. J. Environ. Qual. 29: 447-453.
Mae, T. 2011. Nitrogen acquisition and its relation to growth and yield in recent high-yielding cultivars of rice (Oryza sativa L.) in Japan. Soil Sci. Plant Nutr. 57: 625-635.
Matsuyama, M., Ushio, A., Kuwana, T. and Yoshikura, J. 2003. Nitrogen uptake by rice plants from applied organic matters
during five years in pot experiments and reduction in the rate of nitrogen fertilizer application. Jpn. J. Soil Sci. Plant Nutr. 74: 533-537**.
Nakano, H., Morita, S., Hattori, I. and Sato, K. 2008. Effects of planting time and cultivar on dry matter yield and estimated total digestible nutrient content of forage rice in southwestern Japan. Field Crop. Res. 105: 116-123.
Nakano, H. and Morita, S. 2009. Effects of planting time and nitrogen application on dry matter yield of the forage rice cultivar Tachiaoba in southwestern Japan. Plant Prod. Sci. 12: 351-358. Nishida, M., Moriizumi, M. and Tsuchiya, K. 2005. Changes in the N
recovery process from 15N-labeled swine manure compost and rice
bran in direct-seeded rice by simultaneous application of cattle manure compost. Soil Sci. Plant Nutr. 51: 577-581.
Nishida, M., Sumida, H. and Kato, N. 2008. Fate of nitrogen derived from 15N-labeled cattle manure compost applied to a paddy field
in the cool climate region of Japan. Soil Sci. Plant Nutr. 54: 459-466. Nishida, M. 2011. Nitrogen dynamics of organic materials applied to
paddy fields: Direct evaluation using organic materials labeled with nitrogen-15. Jpn. Agric. Res. Q. 45: 31-38.
Saha, S., Pandey, A.K., Gopinath, K.A., Bhattacharaya, R., Kundu, S. and Gupta, H.S. 2007. Nutritional quality of organic rice grown on organic composts. Agron. Sustain. Dev. 27: 223-229.
Satake, T., Lee, S.Y., Koike, S. and Kariya, K. 1987. Male sterility caused by cooling treatment at the young microspore stage in rice plants. XXVII. Effect of water temperature and nitrogen application before the critical stage on the sterility induced by cooling at the critical stage. Jpn. J. Crop Sci. 56: 404-410.
Shimizu, H., Ando, I., Yokogami, N., Matsuba, S. and Kuroki, M. 2008. A new rice variety “Hokkai-shi308”. In National Agricultural Research Center for Hokkaido Region eds., New Research Results for Hokkaido Region in 2007. 8-12**.
Tatsuta, H. 1999. Influence of nitrogen application on anther length, anther width and number of engorged pollen grains as characters related to cooling injury in rice plants. Jpn. J. Crop Sci. 68: 187-193*. Taylaran, R.D., Ozawa, S., Miyamoto, N., Ookawa, T., Motobayashi, T.
and Hirasawa, T. 2009. Performance of a high-yielding modern rice cultivar Takanari and several old and new cultivars grown with and without chemical fertilizer in a submerged paddy soil. Plant Prod. Sci. 12: 365-380.
Ueno, H. and Yamamuro, S. 2001. Fate of nitrogen derived from
15N-labeled plant residues and composts in rice-planted paddy soil.
Soil Sci. Plant Nutr. 47: 747-754.
* In Japanese with English abstract. ** In Japanese.