降雨による土壌コロイドと溶存有機物の流出特性
Leaching Characteristics of Soil Colloids and Dissolved Organic Carbon During Irrigation
川本 健*
,
小松登志子**, Per MOLDRUP
***Ken KAWAMOTO, Toshiko KOMATSU, and Per MOLDRUP
Transport of pesticides, heavy metal, PAHs, radionuclide, and other strongly sorbing contaminants in soils is enhanced by colloid-facilitated transport. This study investigated mobilization and leaching of colloidal matter and dissolved organic carbon from two aggregated soils (Andisols) and a single grain soil (sand) during rainfall irrigation using column experiments. Results show that the cumulative colloid leaching from both aggregated and single-grained soils increased linearly with the square root of time at low EC effluents. This suggests that the colloid leaching is controlled by diffusion-limited kinetics. The mechanism of colloid detachment was also examined based on the relationship between the colloid concentration and the reciprocal of the square root of EC.
Keywords: Colloid, Dissolved Organic Carbon, Leaching, Soil Structure, Rainfall Irrigation
1.
はじめに土壌に存在する様々な物質がコロイドに吸着して土 壌内を移動する。コロイドによる物質輸送は土壌・地 下水汚染と密接に関連し,農薬,重金属,各種非水溶 性物質のコロイド吸着による土壌内輸送が数多く研究 されている1),2), 3)。
コロイドに吸着した汚染物質の輸送機構を解明する ためには,土壌内でのコロイドの生成・移動機構の解 明が不可欠である。しかし,これらの機構には
pH
や イオン強度といった土壌溶液の化学的性質や,降雨強 度や土壌構造といった物理的条件など,様々な要因が 複雑に影響を及ぼすことが知られ 4),その解明にはよ り一層の知見の蓄積が必要とされている。本研究では,団粒構造と単粒構造の異なる土壌構造を有する試料を 用いてカラム実験を行い,降雨時における土壌コロイ ドや溶存有機物の流出特性を調べることを目的とした。
なお,本報ではコロイドの流出特性についての結果 と考察のみを報告する。
2.
コロイド相の定義と分画本研究では,本下ら5)に準じて,コロイド相の定義・
分画を行った。彼らはコロイド粒子と溶存有機物の両 者に注目し,コロイド相を粒子径が
1
µm
以下の無機性*
埼玉大学 工学部 建設工学科Department of Civil & Environmental Engineering, Faculty of Engineering, Saitama University, 255 Shimo-Okubo, Sakura-ku, Saitama, Saitama, 338-8570, Japan
**
埼玉大学大学院 理工学研究科Graduate School of Science and Engineering, Saitama University, 255 Shimo-Okubo, Sakura-ku, Saitama, Saitama, 338-8570, Japan
*** Department of Life Sciences, Aalborg University,
Denmark.
コロイド(
Colloidal inorganic matter
),有機性コロイド(
Colloidal organic matter
),真の溶存有機物(Real dissolved organic carbon, RDOC
)の3
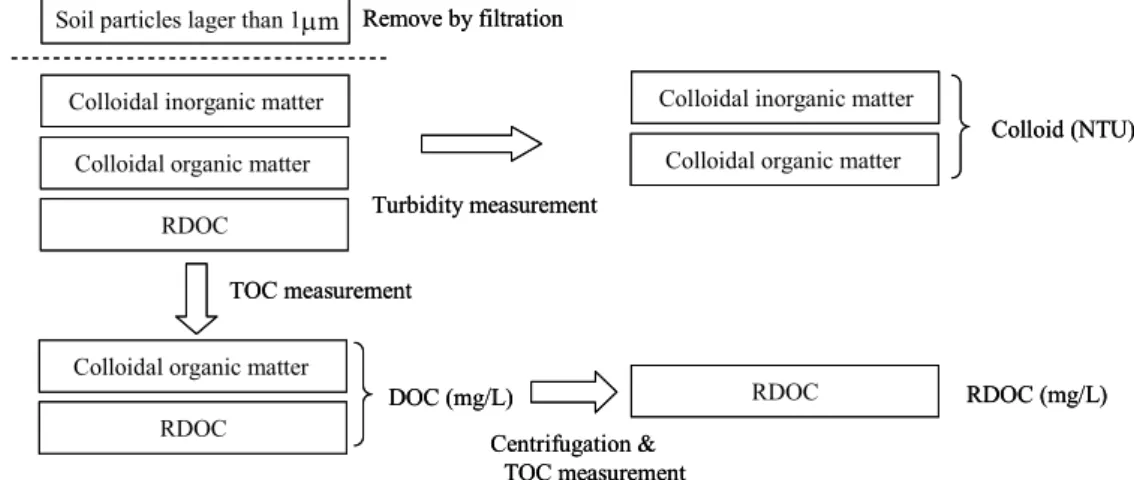
つのフラクション に分画した。試料水の測定手順および各フラクションの濃度の同
定法を
Fig. 1
に示した。孔径1
µm
のろ紙でろ過したろ液の濁度(
2100P
型濁度計, HACH
社製)よりコロイド 濃度を求め,TOC
計(TOC-5000, SHIMADZU
社製)よ り溶存有機物(Dissolved organic carbon, DOC
)濃度を 求めた。そして,ろ液を遠心分離することにより得ら れた上澄み液のTOC
濃度からRDOC
濃度を求めた。ここで,有機性コロイドと
RDOC
の分画は,20000g
の回転数で所定の時間遠心分離を行い,沈降するもの を有機性コロイド,沈降しないものをRDOC
とした。遠心分離時間は,立川ロームが
3
時間,福島ロームと 豊浦砂が8
分とした(試料については後述)。3.
試料およびカラム実験試料は東京都西東京市と福島県西郷村より採取した 黒ボク土(以下,立川ロームと福島ローム)と豊浦砂
の
3
種類の土壌試料を用いた。立川ロームは畑地,福 島ロームは林地より採取し,2mm
篩で篩別後の通過分 を試料に用いた。豊浦砂は,中性洗剤で洗浄後,蒸留 水を用いて十分にリンスしたものを用いた。試料の物理特性を
Table 1
に示した。Fig. 2
に両ロームの団粒分布,粒径分布曲線を示した。一般に,団粒分布と粒径分布曲線の差は団粒化の度合 いを反映し,その差が大きくなるほど団粒構造の発達 を示す。図より,立川ロームと福島ロームの両試料と も団粒構造を有し,福島ロームの方が立川ロームより
Colloidal inorganic matter Colloidal organic matter
RDOC
Remove by filtration Soil particles lager than 1µ
m
Colloidal inorganic matter Colloidal organic matter Turbidity measurement
Colloid (NTU)
Colloidal organic matter RDOC
TOC measurement
DOC (mg/L) RDOC RDOC (mg/L)
Centrifugation &
TOC measurement
Fig. 1 Experimental procedure for determining concentration of each colloid and DOC fraction.
Colloidal inorganic matter Colloidal inorganic matter Colloidal organic matter Colloidal organic matter
RDOC RDOC
Remove by filtration Soil particles lager than 1µ
m
Soil particles lager than 1µ
m
Colloidal inorganic matter Colloidal inorganic matter Colloidal organic matter Colloidal organic matter Turbidity measurement
Colloid (NTU)
Colloidal organic matter Colloidal organic matter
RDOC RDOC
TOC measurement
DOC (mg/L) RDOC RDOC RDOC (mg/L)
Centrifugation &
TOC measurement
Fig. 1 Experimental procedure for determining concentration of each colloid and DOC fraction.
0 20 40 60 80 100
0.001 0.01 0.1 1 10
Diameter (mm)
% P assi ng
Fig. 2 Aggregate size and particle size distributions for Tachikawa and Fukushima loam soils.
Aggregate (Fukushima) Aggregate
(Tachikawa) Particle (Fukushima)
Particle (Tachikawa)
0 20 40 60 80 100
0.001 0.01 0.1 1 10
Diameter (mm)
% P assi ng
Fig. 2 Aggregate size and particle size distributions for Tachikawa and Fukushima loam soils.
Aggregate (Fukushima) Aggregate
(Tachikawa) Particle (Fukushima)
Particle (Tachikawa)
Table 1 Soil physical characteristics.
Particle size distribution Soil Depth Soil mineral
density
Dry bulk density
Total porosity
Organic matter content of soil*
Initial water
content Clay Silt Sand
cm g/cm3 g/cm3 cm3 cm-3 % % %
Tachikawa loam 5-10 2.70 0.62 0.77 7.8 56.1 8.4 55.6 36.0 Fukushima loam 5-15 2.46 0.56 0.77 11.0 95.7 17.6 27.3 55.1
Toyoura sand - 2.64 1.58 0.40 0.0 0.0 0.0 0.0 100.0
* Organic matter content of soil was determined by dichromic acid method.
もその差が大きいことから,前者の方が団粒化の度合 いが大きいことが分かる。また,豊浦砂は
99.7%
質量が
0.105-0.21mm
篩に保持される均一な砂で,土壌構造は単粒構造となる。
カラム実験の装置を
Fig. 3
に示した。カラムは内径4.9cm
,高さ15cm
のアクリル製のカラムを用いた。試料高さを
10cm
とし,試料上下には供給・排出溶液が カラム断面に均一に広がるようにガラスビーズを1cm
高さに充填した。カラム実験では供給溶液として,人工雨水を用いた。
人工雨水は,自然の雨水の組成に近づけるため,
0.085
mM NaCl
+0.015mM CaCl
2の混合溶液を用いた。立川ロームは,
10
時間もしくは30
時間の連続降雨を降雨強度
80mm/hr
で与えた。福島ロームと豊浦砂は,降雨強度
20mm/hr
で39
,26
,26
時間の3
回に分けて 降雨イベントを与えた。各降雨イベントの時間間隔は24
時間とした。供給溶液は,pH=5.5-5.9
,EC=2.0-2.3 mS/m,
濁度=0.17-0.47 NTU
,DOC
とRDOC
はいずれも0 mg/L
であった。実験中,カラム下端からの排水溶液の採取を行い,排水溶液の
pH
,EC
,濁度,TOC
濃度(
DOC
,RDOC
測定)を測定した。4
.
結果および考察4.1
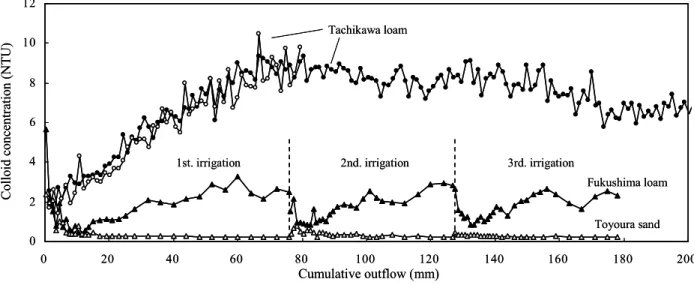
コロイドの流出特性コロイド濃度と累積排水量の関係を
Fig.3
に示した。立川ロームは排水にともない,コロイド濃度の上昇,
ほぼ一定値の継続,その後緩やかな低下を示した。こ れに対し,福島ロームと豊浦砂は,いずれの降雨イベ ントにおいても排水開始時に大きな値を示した後に低 下し,再び上昇して一定値を継続する変化を示した。
また,立川ロームの流出コロイド濃度は福島ロームに 比べ大きな値を示した。
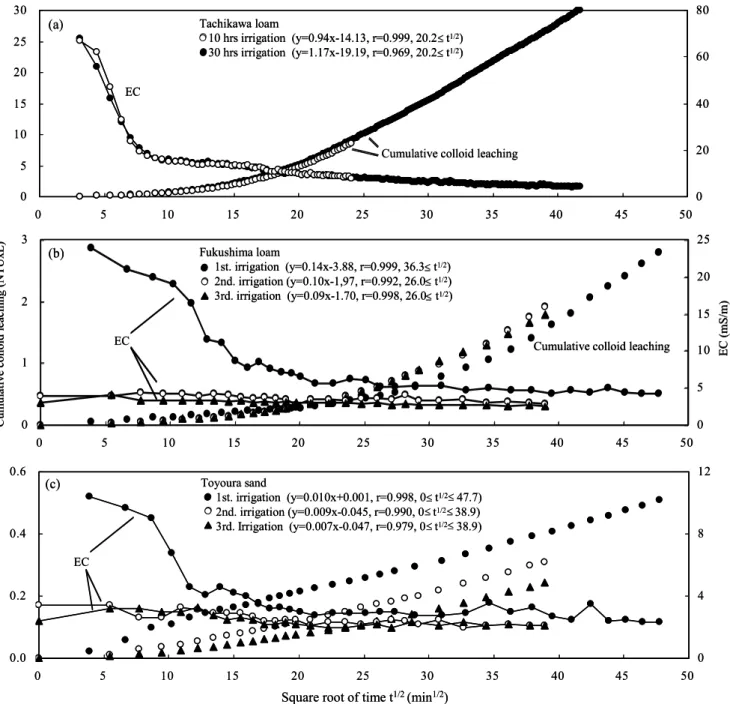
土壌からのコロイドの流出は拡散律速のプロセスに 従い,コロイドの累積流出量と時間の平方根
t
1/2に線形 の関係があることが報告されている5), 6), 7), 8)。Fig.5
に 本研究で得られたコロイドの累積流出量と時間の平方 根の関係を示した。また,同図の右縦軸には流出溶液 のEC
変化を示した。立川ロームと福島ロームは,排 水初期では直線性を示さないものの,排水中期から後 期にかけては良い直線性を示した(図中の回帰式,相Solution application by a peristaltic pump
Soil material
Stainless steel filter
(Pore size 1mm) Glass beads 10cm
1cm
1cm
Collection of drainage
Fig. 3 Experimental apparatus for leaching tests.
4.9cm
Glass beads
Solution application by a peristaltic pump
Soil material
Stainless steel filter
(Pore size 1mm) Glass beads 10cm
1cm
1cm
Collection of drainage
Fig. 3 Experimental apparatus for leaching tests.
4.9cm
Glass beads
0 2 4 6 8 10 12
0 20 40 60 80 100 120 140 160 180 200
Fig. 4 Colloid concentration as a function of cumulative outflow. Cumulative outflow (mm)
Collo id c onc en tra tio n (NT U )
1st. irrigation 2nd. irrigation 3rd. irrigation
Toyoura sand Tachikawa loam
Fukushima loam
0 2 4 6 8 10 12
0 20 40 60 80 100 120 140 160 180 200
Fig. 4 Colloid concentration as a function of cumulative outflow. Cumulative outflow (mm)
Collo id c onc en tra tio n (NT U )
1st. irrigation 2nd. irrigation 3rd. irrigation
Toyoura sand Tachikawa loam
Fukushima loam
関係数)。一方,豊浦砂は排水初期から直線性を示した。
団粒構造を有する立川ロームと福島ロームが排水初 期において直線性を示さない理由として流出溶液の
EC
変化が挙げられる。立川ローム(Fig. 5(a)
)を例に 説明すると,EC
は流出開始時にEC=68mS/m
を示し,流出継続にともない急激に低下し,直線性が開始する 時点(
t
1/2=20.2
)で9.3mS/m
となった。その後,緩やか に低下し,流出終了時(t
1/2=41.7
)に4.4mS/m
となった。一般に,土壌溶液の
EC
(もしくはイオン強度)の低下 にともないコロイドは土壌内を移動しやすくなること から,流出初期は高いEC
のため,コロイド粒子が凝集し,土壌からの流出が抑制されたものと考えられる。
逆に,排水中期から後期にかけては,低
EC
のためコ ロイド粒子が分散し,流出が促進されたものと考えら れ,この流出は拡散律速に従うものと考えられる。一方,単粒構造の豊浦砂は,流出溶液の
EC
は最大 で流出開始時の10.4mS/m
と低く,このため流出初期か らコロイド流出が拡散律速に従ったものと考えられる。4.2
コロイド濃度とEC
の関係前述の通り,土壌溶液のイオン強度の低下にともな いコロイドの流出量が大きくなる。これは,イオン強
0.0 0.2 0.4 0.6
0 5 10 15 20 25 30 35 40 45 50
0 4 8 12 0
5 10 15 20 25 30
0 5 10 15 20 25 30 35 40 45 50
0 20 40 60 80
0 1 2 3
0 5 10 15 20 25 30 35 40 45 50
0 5 10 15 20 25
Fig. 5 Cumulative colloid leaching as a function of square root of time. The linear regression equations and the coefficients of regression (r) for cumulative colloid leaching are given.
Square root of time t
1/2(min
1/2)
Cumulative colloid leaching
(a)
(b)
Toyoura sand
1st. irrigation (y=0.010x+0.001, r=0.998, 0 t1/2 47.7) 2nd. irrigation (y=0.009x-0.045, r=0.990, 0 t1/2 38.9) 3rd. Irrigation (y=0.007x-0.047, r=0.979, 0 t1/2 38.9)
≤
≤
≤
≤
≤
≤ Tachikawa loam
10 hrs irrigation (y=0.94x-14.13, r=0.999, 20.2 t1/2) 30 hrs irrigation (y=1.17x-19.19, r=0.969, 20.2 t≤≤ 1/2)
EC
Fukushima loam
1st. irrigation (y=0.14x-3.88, r=0.999, 36.3 t1/2) 2nd. irrigation (y=0.10x-1,97, r=0.992, 26.0 t1/2) 3rd. irrigation (y=0.09x-1.70, r=0.998, 26.0 t≤ 1/2)
≤
≤
Cumulative colloid leaching EC
Cumulative colloid leaching (NTUxL) EC (mS/m)
(c)
EC
0.0 0.2 0.4 0.6
0 5 10 15 20 25 30 35 40 45 50
0 4 8 12 0
5 10 15 20 25 30
0 5 10 15 20 25 30 35 40 45 50
0 20 40 60 80
0 1 2 3
0 5 10 15 20 25 30 35 40 45 50
0 5 10 15 20 25
Fig. 5 Cumulative colloid leaching as a function of square root of time. The linear regression equations and the coefficients of regression (r) for cumulative colloid leaching are given.
Square root of time t
1/2(min
1/2)
Cumulative colloid leaching
(a)
(b)
Toyoura sand
1st. irrigation (y=0.010x+0.001, r=0.998, 0 t1/2 47.7) 2nd. irrigation (y=0.009x-0.045, r=0.990, 0 t1/2 38.9) 3rd. Irrigation (y=0.007x-0.047, r=0.979, 0 t1/2 38.9)
≤ ≤
≤
≤
≤
≤ Tachikawa loam
10 hrs irrigation (y=0.94x-14.13, r=0.999, 20.2 t1/2) 30 hrs irrigation (y=1.17x-19.19, r=0.969, 20.2 t≤≤ 1/2)
EC
Fukushima loam
1st. irrigation (y=0.14x-3.88, r=0.999, 36.3 t1/2) 2nd. irrigation (y=0.10x-1,97, r=0.992, 26.0 t1/2) 3rd. irrigation (y=0.09x-1.70, r=0.998, 26.0 t≤ 1/2)
≤
≤
Cumulative colloid leaching EC
Cumulative colloid leaching (NTUxL) EC (mS/m)
(c)
EC
度の低下にともない電気二重層の層厚が増加し,コロ イド粒子間の反発力が増加することにより,コロイド 粒子が分散して流出しやすくなるためである 9)。この 時,電気二重層の層厚とイオン強度の平方根の逆数は 理論的に比例することから,コロイド濃度はイオン濃 度の平方根の逆数に比例して増加する。
Laegdsmand
ら8)は,イオン強度の代わりに
EC
を用いて,コロイド濃 度とEC
の平方根の逆数EC
-1/2の関係を調べ,流出溶液 のEC
が18.0mS/m
以上で0.08< EC
-1/2<0.25
の範囲にお いて両者が比例関係を有することを示した。Fig. 6
に本研究で得られたコロイド濃度とEC
の平方根の逆数
EC
-1/2の関係を示した。立川ローム(Fig. 6(a)
) では流出初期の累積流出量78mm
未満(t
1/2<23.9
)にお ける,EC>7.8mS/m
,0.23< EC
-1/2<0.36
のEC
の範囲に おいて直線性が見られ,電気二重層の層厚変化がコロ イド流出を左右しているものと考えられる。しかし,EC
-1/2>0.36
の低EC
では比例関係が見られず,コロイ ド流出が電気二重層の層厚変化以外の別のメカニズム に支配されるものと考えられる。一方,流出溶液の大 半が低EC
の範囲(EC
-1/2>0.36
)である福島ロームと豊浦砂(
Fig. 6(b)
)は,いずれの降雨イベントにおいても比例関係を示さず,電気二重層の層厚変化の影響は小 さいものと思われる。
前節において,立川ロームからのコロイド流出は,
高
EC
である流出初期は拡散律速に従わず,EC
が低下 した流出中期以降に拡散律速に従うことを示した。こ のことから,高EC
下における電気二重層の層厚変化 はコロイド流出を左右するものの,拡散律速型のコロ イド流出を与えないことが示唆される。逆に,低EC
下では,コロイド流出は電気二重層の層厚変化以外の メカニズムに支配されるものの,拡散律速型のコロイ ド流出となる。今後は,流出溶液の溶存有機物(
DOC
,RDOC
)の 流出挙動,流出メカニズムについて考察を行う予定で ある。謝辞
本研究は埼玉大学
21
世紀総合研究機構研究プロジェ クト,ならびにマツダ財団研究助成(2003-2005
年)の 補助を受けた。ここに謝意を表する。参考文献
1) McCarthy, J.F., and Zachara, J.M., Subsurface Transport of Contaminants, Environ. Sci. Technol, 23, 496-502, 1997.
2) Nyhan, J.W., Drennon, B.J., Abeele, W.V., Wheeler, M.L., Purtymun, W.D., Trujillo, G., Herrera, W.J., and Booth, J.W., Distribution of Plutonium and Americium Beneath a 33-Year-Old Liquid Waste Disposal Site, J.
Environmental Quality, 14, 501-9, 1985.
3) Kersting, A.B., Efurd, D.W., Finnegan, D.L., Rohop, D.J., Smith, D.K. and Thompson, J.L., Migration of plutonium in groundwater at the Nevada Test Site,
0 2 4 6 8 10 12
0.0 0.2 0.4 0.6 0.8
0 2 4 6 8 10 12
0.0 0.2 0.4 0.6 0.8
(a)
Tachikawa loam(b)
Toyoura sand1st. irrigation 2nd. irrigation 3rd. Irrigation Fukushima loam
1st. irrigation 2nd. irrigation 3rd. irrigation
10 hrs irrigation 30 hrs irrigation
(Cumulative outflow < 78mm) 30 hrs irrigation
(Cumulative outflow 78mm)≥
Fig. 6 Relationship between colloid concentration and the reciprocal of square root of EC.
(EC [mS/m])
-1/2Collo id c onc en tra tio n (NT U )
0 2 4 6 8 10 12
0.0 0.2 0.4 0.6 0.8
0 2 4 6 8 10 12
0.0 0.2 0.4 0.6 0.8
(a)
Tachikawa loam(b)
Toyoura sand1st. irrigation 2nd. irrigation 3rd. Irrigation Toyoura sand
1st. irrigation 2nd. irrigation 3rd. Irrigation Fukushima loam
1st. irrigation 2nd. irrigation 3rd. irrigation Fukushima loam
1st. irrigation 2nd. irrigation 3rd. irrigation
10 hrs irrigation 30 hrs irrigation
(Cumulative outflow < 78mm) 30 hrs irrigation
(Cumulative outflow 78mm)≥ 10 hrs irrigation
30 hrs irrigation
(Cumulative outflow < 78mm) 30 hrs irrigation
(Cumulative outflow 78mm)≥
Fig. 6 Relationship between colloid concentration and the reciprocal of square root of EC.
(EC [mS/m])
-1/2Collo id c onc en tra tio n (NT U )
Nature, 397, 56–59, 1999.
4) de Jonge, L.W., Kjaergaard, C., and Moldrup, P., Colloids and Colloid-Facilitated Transport of Contaminants in Soils: An Introduction, Vadose Zone Journal, 3, 321-325, 2004.
5)
本下晶晴,
小松登志子,
下所諭, Per Moldrup,
尾崎 則篤,
福島武彦,
降雨による表層土壌カラムから のコロイド粒子と溶存有機物の流出特性,
土木学 会論文集, 706, VII-23, 61-76, 2002.
6)
本下晶晴,
小松登志子, Per Moldrup,
尾崎則篤,
福 島武彦,
降雨時における土壌カラムからのコロイ ド粒子の流出挙動,
土木学会論文集, 678, VII-19, 111-122, 2001.
7) Jacobsen, O.H., Moldrup, P., Larsen, C., Konnerup, L., and Petersen, L.W., Particle transport in macropores of undisturbed soil columns, J. Hydrol., 196, 185-203, 1997.
8) Laedsmand, M., Villholth, K.G., Ullum, M., and Jensen, K.H., Processes of colloid mobilization and transport in macroporous soil monoliths, Geoderma, 93, 33-59, 1999.
9)
足立泰久,岩田進午編著,土のコロイド現象 土・水環境の物理化学と工学的基礎,学会出版センタ ー,