ビタミンは
• 不足すると欠乏症
•生体の代謝に必要な微量の有機
化合物
•体内で必要量を作れない
ビタミン
機能:
糖質、脂質、たんぱく質などの
代謝を円滑に行わせる:補酵素
ビタミン自身
エネルギー源や体の構成成分にはならない
ビタミンの歴史
•
1910年、鈴木梅太郎により抗脚気因子、オリザニンと名付けられた。•
1911年、ポーランド人カシミール・フンクによって、vital amine (生命活動に必須の アミン)から "vitamine" と名付けられた。これがビタミンB1(チアミン)。•
1913年エルマー・ヴァーナー・マッカラムが、バターまたは卵黄の脂肪の中にネズミ の成長に不可欠な成分があることを発見。1914年、その成分の抽出に成功。フンクが 抽出した成分と明らかに異なったため、油溶性A、水溶性Bとした。•
1920年ジャック・セシル・ドラモンドが柑橘系果物中の壊血病を予防する成分を抽 出。この成分はアミン (amine) の化合物ではなかったので、ビタミンの発音はそのま までスペルをvitaminに変更することを提案し、発見した壊血病を予防する成分を「ビ タミンC」と命名。•
その後、生命に必要な成分が見つかる度に、化学構造が判明し適当な名前が付くまでの 仮称として、D, E, F,... と順に名付けられた。•
ビタミンFなど、いくつかのビタミンは間違いであることや、ビタミンHなど、B群であ ることが判明し消滅した。ビタミンとビタミン様物質
水溶性ビタミン B群 B1: チアミン B2: リボフラビン、ビタミンGともい う B3: ナイアシン、ビタミンPPともいう B5: パントテン酸 B6: ピリドキサール、ピキドキサミ ン、ピリドキシン B7: ビオチン、ビタミンBw、ビタミン Hともいう B9: 葉酸、ビタミンBc、ビタミンMと もいう B12: シアノコバラミン、ヒドロキソ コバラミン C: アスコルビン酸 脂溶性ビタミン A: アクセルフロール、βカロチンなどの カロチノイドの一部 D: エルゴカルシフェロール、コレカル シフェロール E: トコフェロール、トコトリエノール K: フィロキノン、メナキノンの2つのナ フトキノン誘導体 ビタミン様物質 B4: アルギニン、シスチン B8: エルガデニル酸(Ergadenylic acid、アデニル酸) B10: 葉酸はじめ各種ビタミンB群の混 合物。ビタミンRともいった B11: 葉酸類似化合物。ビタミンSとも いった B13: オロト酸 B14: 葉酸またはリポ酸などの混合物 B15: パンガミン酸(ジメチルグリシン やトリメチルグリシンなど) B16: ビタミンU B17: アミグダリン BH: イノシトール BP: コリン BT: カルニチン BX: パラアミノ安息香酸(葉酸の部分構 造) F: リノール酸などの必須脂肪酸 I: 米糠の抽出物。かつてはビタミンB7と も呼ばれた。 J: カテコール、フラビンまたはコリン L1: アントラニル酸 L2: アデニルチオメチルペントース M: 葉酸 N: チオクト酸(α-リポ酸) O: カルニチン P: ケルセチン、ヘスペリジン、ルチンな どのフラボノイド Q: ユビキノン T: テゴチン V: ニコチンアミドアデニンジヌクレオ チド U: 塩化メチルメチオニンスルホニウムエネルギー産生と関連するビタミン パントテン酸 ビオチン B1(チアミン) ニコチンアミド・ニコチン酸 B2(リボフラビン) エネルギー産生と関連するビタミン
B6(ピリドキシン) B12(コバラミン) 葉酸( プテロイルグルタミン酸) アミノ酸・核酸の代謝に 関連するビタミン A(レチノール) D(コレカルシフェロール) E(α-トコフェロール) K(フィロキノン) 脂溶性ビタミン C(アスコルビン酸) 抗酸化作用と関連するビタミン
図6 三大栄養素とエネルギー生産経路の概要 ブドウ糖 アミノ酸 たんぱく質 尿素 O2 H2O NAD+ NADH NAD+ NADH FAD FADH2 FAD FADH2 NAD+ NADH NAD+ NADH FAD FADH2 ADP ATP ADP ATP 脂肪 炭水化物 アセチルCoA CO2 クエン酸 回路 酸化的 リン酸化 解糖系 β酸化 脂肪酸 CO2
人体を構成する元素
•炭素、水素、酸素、窒素で96%
•残りの4%を無機質と総称
無機質
体内のミネラルの構成比率 (%)
Ca 50.8 Na 2.9 Cl 3.7 Mg 1.1 Fe 0.2及び その他0.1 K 6.7 S 5.1 P 29.4貧血ではないが鉄が欠乏している女性の持久運動能力は
鉄を投与することによって向上する
Hinton PS et al. J Appl Physiol 88: 1103-11, 2000より作図
0 5 10 15 20 100 110 120 130 140 150 24 26 28 30 32 34 15 km走行タイム (分) ヘモグロビン (g/L) 血清フェリチン (μg/L) 前 後 対照群 鉄投与群 前 後 前 後 対照群 鉄投与群 前 後 前 後 対照群 鉄投与群 前 後 * *† *†
鉄の多い食べ物
•赤身の肉, 魚
•緑黄色野菜
•大豆食品
普段の食事で
鉄の供給量の多い食品
•
高野豆腐•
納豆•
小松菜•
ひじき•
うすあげ•
イカナゴ•
鶏もも肉•
厚揚げ•
豆腐•
牛もも肉•
がんもどき•
ほうれん草•
あさり•
牛挽肉•
あんぱん•
お多福豆•
プリン•
卵•
鯖•
食パン•
ご飯•
さんま•
中華麺•
食パン•
いかなご•
ひじき•
鶏もも肉•
牛もも肉•
卵•
ほうれん草•
小松菜•
うすあげ•
豆腐•
ご飯•
ソース•
味噌•
納豆男性
女性
Copyright @ 200 by the American College of Sports Medicine. Unauthorized reproduction of this article is prohibited.9
Effect of Exercise Training on Loss of Bone
Mineral Density during Lactation
CHERYL A. LOVELADY1, MELANIE J. BOPP1, HEATHER L. COLLERAN1, HEATHER K. MACKIE1, and LAURIE WIDEMAN2
1Department of Nutrition, University of North Carolina at Greensboro, Greensboro, NC; and 2Department
of Kinesiology, University of North Carolina at Greensboro, Greensboro, NC
ABSTRACT
LOVELADY, C. A., M. J. BOPP, H. L. COLLERAN, H. K. MACKIE, and L. WIDEMAN. Effect of Exercise Training on Loss of Bone Mineral Density during Lactation. Med. Sci. Sports Exerc., Vol. 41, No. 10, pp. 1902–1907, 2009. Purpose: During lactation, women transfer approximately 200 mg of calcium per day to breast milk. For 6 months, this is equivalent to 3%–9% of bone mineral density (BMD) loss at trabecular-rich sites. Bone mass usually returns to prepregnancy levels with cessation of lactation but not in all women. Therefore, the purpose of this study was to determine whether exercise slows bone loss from 4 to 20 wk postpartum (PP). Methods: At 4 wk PP, women were randomized to either an exercise group [EG, n = 10, weight bearing aerobic exercise (3 dIwkj1, 45 minIdj1) and 3 dIwkj1 of resistance exercise] or a control group (CG, n = 10, no exercise) for 16 wk. Body composition and BMD were measured by dual-energy x-ray absorptiometry at the lumbar spine (LS), hip, and total body. Maximal strength and predicted maximal oxygen consumption (V˙ O2max) were determined by 1-repetition maximum and submaximal treadmill test, respectively. Repeated-measures ANOVA was used to test for time and time by group differences. Results: EG lost significantly less LS BMD than CG (j4.8 T 0.6% vs j7.0 T 0.3%, P G 0.01). There were no significant differences in total body and hip BMD. Both groups lost fat mass (EG = j2.9 T 0.7 kg, CG = j1.8 T 0.4 kg); however, EG lost less lean body mass (j0.7 T 0.3 vs j1.6 T 0.3 kg, P = 0.05). Maximal strength increased by 34% to 221% for all exercises in EG, whereas CG changed j5.7% to 12%. Predicted V˙ O2max increased in both groups (EG = 11.4 T 2.0, CG = 6.9 T 1.7%). Conclusions: These results suggest that resistance and aerobic exercise may slow bone loss during lactation. Key Words: BONE MASS, RESISTANCE EXERCISE, BREASTFEEDING, BODY COMPOSITION
M
ore than 35 million American women either have or are at risk for osteoporosis (17). Many factors determine women’s risk for osteoporosis, such as diet, exercise, and smoking. Bone mineral losses during pregnancy and lactation may also affect women’s bone status as they enter menopause. Approximately 200 mg of calcium per day is lost from maternal bones for milk production during lactation (20). This transfer of calcium results in 3%–9% loss of bone mineral density (BMD) at trabecular-rich sites during a 6-month period (10). Loss of BMD during lactation is much greater than the average loss of 1%–2%Iyrj1 observed after menopause (10). BMD losses seem to be greatest in the first 5 months of lactation, with recovery to normal BMD levels once lactation ceases(10). Particularly problematic is that bone density does not return to prepregnant levels in all women, even after menses resumes (21). Susceptible women include those nursing multiple babies, adolescent mothers, and women in the later childbearing years who may not be able to regain lost bone mass before the onset of menopause (8). Lactation may be a contributing factor for postmenopausal osteoporosis in women whose bone density does not completely re-cover to prepregnancy levels upon weaning; however, results of studies are inconclusive (20). In fact, recent epi-demiological research suggests higher bone density in women who breastfed their infants compared with women who did not (18).
Normal bone remodeling occurs for a period of 4–8 months; however, during lactation, the remodeling is accelerated and occurs within 3–4 months (8). During lactation, high pro-lactin and low estrogen levels promote bone resorption. At 6 months postpartum, exclusively breastfeeding women have prolactin levels that remain elevated (7), which supports continued calcium losses from the bone to breast milk. Return of menses, with the accompanying increase in estrogen levels, has been shown to decrease bone losses during lactation (9,22).
Weight bearing exercise in nonpregnant, nonlactating women with normal estrogen status has been shown to in-crease BMD in the lumbar spine and femoral neck by
Address for correspondence: Cheryl A. Lovelady, Ph.D., M.P.H., R.D., Department of Nutrition, PO Box 26170, University of North Carolina at Greensboro, Greensboro, NC 27402-6170; E-mail: Cheryl_Lovelady@ uncg.edu.
Submitted for publication July 2008. Accepted for publication March 2009. 0195-9131/09/4110-1902/0
MEDICINE & SCIENCE IN SPORTS & EXERCISE!
Copyright " 2009 by the American College of Sports Medicine DOI: 10.1249/MSS.0b013e3181a5a68b
1902
BASIC
SCIENCES
Copyright @ 200 by the American College of Sports Medicine. Unauthorized reproduction of this article is prohibited.9
during the 16-wk intervention. Statistical significance was set at P e 0.05.
RESULTS
Twenty-four women were recruited and completed baseline measurements. Four women (n = 1 in CG and n = 3 in EG) did not complete the study because they were not able to exclusively breastfeed their infants throughout the 16-wk period. There were no significant differences in their baseline characteristics compared with the women who completed the study. The characteristics of participants were not significantly different between groups (Table 1). Women were not obese and were either non-Hispanic white (n = 19) or Asian (n = 1). We did not measure breast milk volume or composition. However, weight gain of infants was similar in both groups (EG = 2.7 T 0.2 vs CG = 2.9 T 0.2 kg). Eight women started hormonal birth control (progesterone-only pill or intrauterine device, n = 3 in CG and n = 5 in EG). Two women (one in each group) resumed menses during the study period. After the study, at approximately 1 yr postpartum, nine women reported weaning their infants from 24 to 48 wk (mean T SEM = 40 T 9 wk) postpartum and 11 were still breastfeeding.
Losses of lumbar spine BMD were significantly less in those in the EG compared with those in the CG (Table 2). Statistical power for the given effect size of mean change in lumbar spine BMD was 85%. Both groups lost total body and hip BMD, but the differences were not significant between groups.
No significant differences in cardiorespiratory fitness or muscular strength were observed between groups at baseline. Both groups experienced an increase in predicted V˙ O2max during the study period (Table 3). However, there was no significant difference in percent change between groups. The women in the EG increased muscular strength and endurance significantly more than those in the CG did in all exercises (Table 3). Women were able to complete an average of 83.4% (range = 60.4%–100%) of the aerobic training sessions and 94.2% (range = 81.2%–100%) of the resistance training sessions.
Total body mass lost was not significantly different between groups (Table 4). There was a trend for those in the EG to have lost significantly less LBM than those in the CG (P = 0.05). Percent body fat decreased in both groups during the intervention period, with the EG showing a greater change in percentage of body fat than the CG; however, this was not significant (P = 0.09).
Both groups decreased energy (kcal) intake over time; however, this was not significant between groups (Table 4). Protein, calcium, and vitamin D intakes did not significantly change over time or between groups.
DISCUSSION
These results suggest that 16 wk of resistance and aerobic exercises minimize losses of lumbar spine BMD during lac-tation. The lumbar spine is composed of highly metabolic trabecular bone, which has a much higher turnover rate, as compared with the whole body, and is more susceptible
TABLE 3. Muscular strength and endurance and cardiorespiratory fitness at baseline and end point and percent change after the intervention.
CG (n = 10) EG (n = 10)
Baseline End point % Change Baseline End point % Change Squats (lb) 66 T 4.6 74 T 6.5 12 T 3.5 59 T 3.1 85 T 4.3 46 T 8.0*† Bench press (lb) 43 T 4.3 44 T 5.0 1 T 1.4 37 T 1.5 59 T 2.3 63 T 10.0† Abdominal plank (s) 69 T 12.7 60 T 9.3 j3 T 11.8 61 T 16.1 116 T 20.3 203 T 78.8† Military press (lb) 35 T 2.9 36 T 2.4 5 T 5.2 33 T 1.5 44 T 2.2 34 T 6.3† Dead lift (lb) 66 T 4.6 71 T 6.9 7 T 4.7 57 T 3.0 92 T 3.6 63 T 4.1*† Push-ups (n) 11 T 2.1 14 T 2.3 66 T 51.0 10 T 2.0 26 T 3.0 221 T 62.6† High pulls (lb) 42 T 2.9 44 T 4.0 4 T 4.1 40 T 2.6 62 T 2.9 58 T 6.8† Dumbbell row (lb) 44 T 4.5 45 T 2.7 8 T 8.8 38 T 4.7 66 T 4.0 89 T 14.5† Wall sit (s) 36 T 4.6 38 T 9.0 j6 T 12.9 27 T 5.7 57 T 10.2 161 T 37.4† Crunches (n) 61 T 22.7 63 T 26.8 j2 T 8.0 51 T 11.5 106 T 28.7 128 T 26.1† Predicted V˙O2max (LIminj1) 2.21 T 0.2 2.24 T 0.2 1.2 T 2.0 2.13 T 0.1 2.24 T 0.1 5.2 T 1.7
Predicted V˙O2max (mLIkgj1Iminj1) 32.4 T 1.5 34.4 T 1.3 6.9 T 1.7 31.1 T 1.2 34.7 T 1.5 11.4 T 2.0*
Values are means T SEM.
* Significantly different over time, P G 0.05. † Significantly different from CG, P G 0.05.
TABLE 2. BMD at baseline and end point and percent change after the intervention.*
CG (n = 10) EG (n = 10)
Baseline End point % Change Baseline End point % Change Whole body BMD (gIcmj2) 1.07 T 0.03 1.06 T 0.03 j0.8 T 0.3 1.09 T 0.02 1.09 T 0.02 j0.6 T 0.4 Lumbar spine BMD (gIcmj2) 1.07 T 0.04 1.00 T 0.03 j7.02 T 0.6 1.05 T 0.04 1.00 T 0.04 j4.8 T 0.3† Total hip BMD (gIcmj2) 0.95 T 0.04 0.93 T 0.03 j2.2 T 0.9 0.96 T 0.03 0.93 T 0.03 j2.8 T 0.8
Values are means T SEM.
* Significantly different over time, P G 0.05. † Significantly different from CG, P G 0.01.
EXERCISE AND BONE DENSITY DURING LACTATION Medicine & Science in Sports & Exercised 1905
BASIC
772 HETLAND, HAARBO, AND CHRISTIANSEN
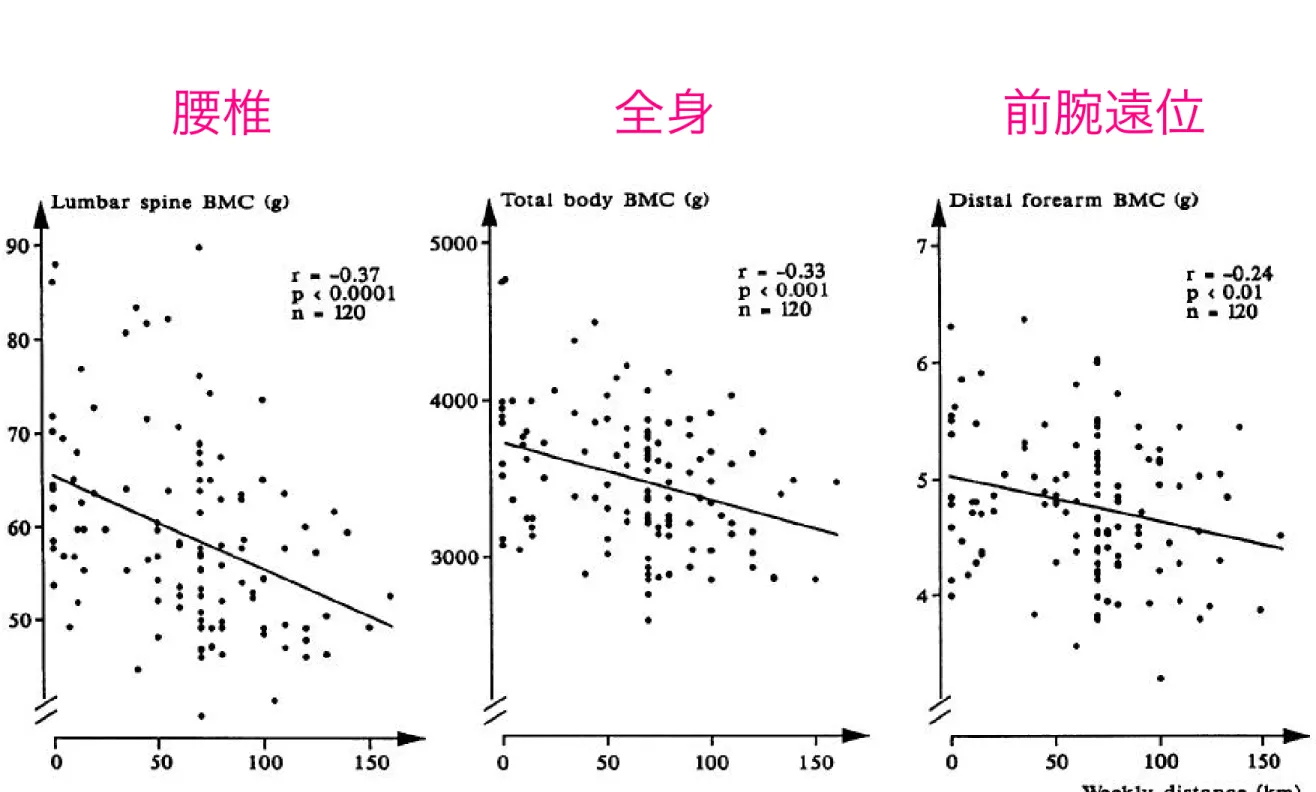
FIG. 1. Bone mineral content (BMC) in the lumbar spine, total body, and distal forearm as a function of the weekly distance run in 120 men. Lumbar spine BMC (B) t Total body BMC (g) 90 . 5000 I l .
4
Distal forearm BMC (g) 6 a .* l . . 5 I I I 1) 0 50 100 150 Weekly distance (km) JCE&M.1993 Vol77.No3TABLE 2. Various expressions of training status and bone mineral content in the proximal femur
Weekly distance (km) Cumulated distance (km) VOx max (mL/min/kg) Mat step at exercise test”
Trochanter major (8) -0.34’ -0.28b NS NS Ward’s triangle (8) -0.24’ -0.41” NS NS Intertrochanteric region (9) -0.20’ -0.20’ NS NS Femoral neck 68) NS -0.20’ NS NS Total (8) -0.24* -0.23’ NS NS Coefficients of correlation are given.
n P c 0.001. *P c 0.01.
'P < 0.05.
d Spearman’s test.
L BONE MASS . BONE TURNOVER
70 -I *** -I- *** *** * 1 * ** **
FIG. 2. Bone mineral content at various skeletal sites and biochemical
markers of bone metabolism in the elite runners. Values are given as the mean f SEM, expressed as a percentage of the mean values in 12
nonrunning controls of similar age. D-Pyr/cr, Urinary deoxypyridino- line corrected for urinary creatinine. Pyr/cr, Urinary pyridinoline corrected for urinary creatinine. Alk. phos., Serum alkaline phospha- tase. ***, PC 0.001; **, P < 0.02; *,P < 0.05.
was found between the performance at the exercise test (maximum step and VOz max) and the weekly distance run
(r = 0.54-0.56; P < 0.001). Stepwise multiple regression analysis was carried out to adjust for possible confounding effects in the relation between the weekly distance run and the bone mineral content of the different regions (Table 3). The weekly distance run remained significantly and nega- tively related to the bone mineral content in the lumbar spine and proximal femur (trochanter major and Wards triangle) and to the total body bone mineral content (-0.29 < r < -0.18; 0.001 < P < 0.03) when body mass index and age were added to the model. When body mass index was replaced by body height, similar results were found (not shown). When body mass index was replaced by body weight, the weekly distance run remained negatively corre- lated with the bone mineral content in the spine (partial r value = -0.14; P = 0.08) and the proximal femur (Wards triangle; partial r value = -0.22; P = 0.005; not shown). When bone mineral content was replaced by bone mineral density or other covariables were added, such as calcium intake, alcohol consumption, smoking, and time spent on nonrunning sports activities, the results of the backward regression analysis were similar.
The three groups of runners had normal concentrations of gonadotropins and sex hormones. No statistically significant relation was found between the sex hormonal status and
level of training, except for the free testosterone index, which
at Osa-Tai-Dai Lib on November 14, 2008 jcem.endojournals.org
Downloaded from
Hetland et al. J Clin Endocrin Metab 77: 770-5, 1993
全身
前腕遠位
骨ミネラル量と1週間あたりの走行距離には負の相関がある
772
HETLAND,
HAARBO, AND CHRISTIANSEN
FIG.
1. Bone mineral content (BMC) in the lumbar spine, total body, and distal forearm as a function of the weekly distance run in 120 men.
Lumbar spine BMC (B) t Total body BMC (g) 90 . 5000I
l.
4
Distal forearm BMC (g) 6 a .* l . . 5 I I I 1) 0 50 100 150Weekly distance (km)
JCE&M.1993 Vol77.No3TABLE
2. Various expressions of training status and bone mineral content in the proximal femur
Weekly distance (km)
Cumulated distance (km)
VOx max (mL/min/kg)
Mat step at exercise test”
Trochanter major (8) -0.34’ -0.28b
NS
NS
Ward’s triangle (8) -0.24’ -0.41”NS
NS
Intertrochanteric region (9) -0.20’ -0.20’NS
NS
Femoral neck 68) NS -0.20’NS
NS
Total (8) -0.24* -0.23’NS
NS
Coefficients of correlation are given.
n P c 0.001.
*P c 0.01.
'P < 0.05.
d Spearman’s test.
L
BONE MASS
.
BONE TURNOVER
70 -I *** -I- *** *** * 1 * ** **
FIG.
2. Bone mineral content at various skeletal sites and biochemical
markers of bone metabolism in the elite runners. Values are given as
the mean f
SEM,expressed as a percentage of the mean values in 12
nonrunning controls of similar age. D-Pyr/cr, Urinary deoxypyridino-
line corrected for urinary creatinine. Pyr/cr, Urinary pyridinoline
corrected for urinary creatinine. Alk. phos., Serum alkaline phospha-
tase. ***,
PC
0.001; **,
P < 0.02; *,P < 0.05.
was found between the performance at the exercise test
(maximum step and VOz max) and the weekly distance run
(r = 0.54-0.56; P < 0.001). Stepwise multiple regression
analysis was carried out to adjust for possible confounding
effects in the relation between the weekly distance run and
the bone mineral content of the different regions (Table 3).
The weekly distance run remained significantly and nega-
tively related to the bone mineral content in the lumbar spine
and proximal femur (trochanter major and Wards triangle)
and to the total body bone mineral content (-0.29 < r <
-0.18; 0.001 < P < 0.03) when body mass index and age
were added to the model. When body mass index was
replaced by body height, similar results were found (not
shown). When body mass index was replaced by body
weight, the weekly distance run remained negatively corre-
lated with the bone mineral content in the spine (partial r
value = -0.14;
P
= 0.08) and the proximal femur (Wards
triangle; partial r value =
-0.22; P = 0.005;
not shown).
When bone mineral content was replaced by bone mineral
density or other covariables were added, such as calcium
intake, alcohol consumption, smoking, and time spent on
nonrunning
sports activities, the results of the backward
regression analysis were similar.
The three groups of runners had normal concentrations of
gonadotropins and sex hormones. No statistically significant
relation was found between the sex hormonal status and
level of training, except for the free testosterone index, which
at Osa-Tai-Dai Lib on November 14, 2008 jcem.endojournals.org
Downloaded from
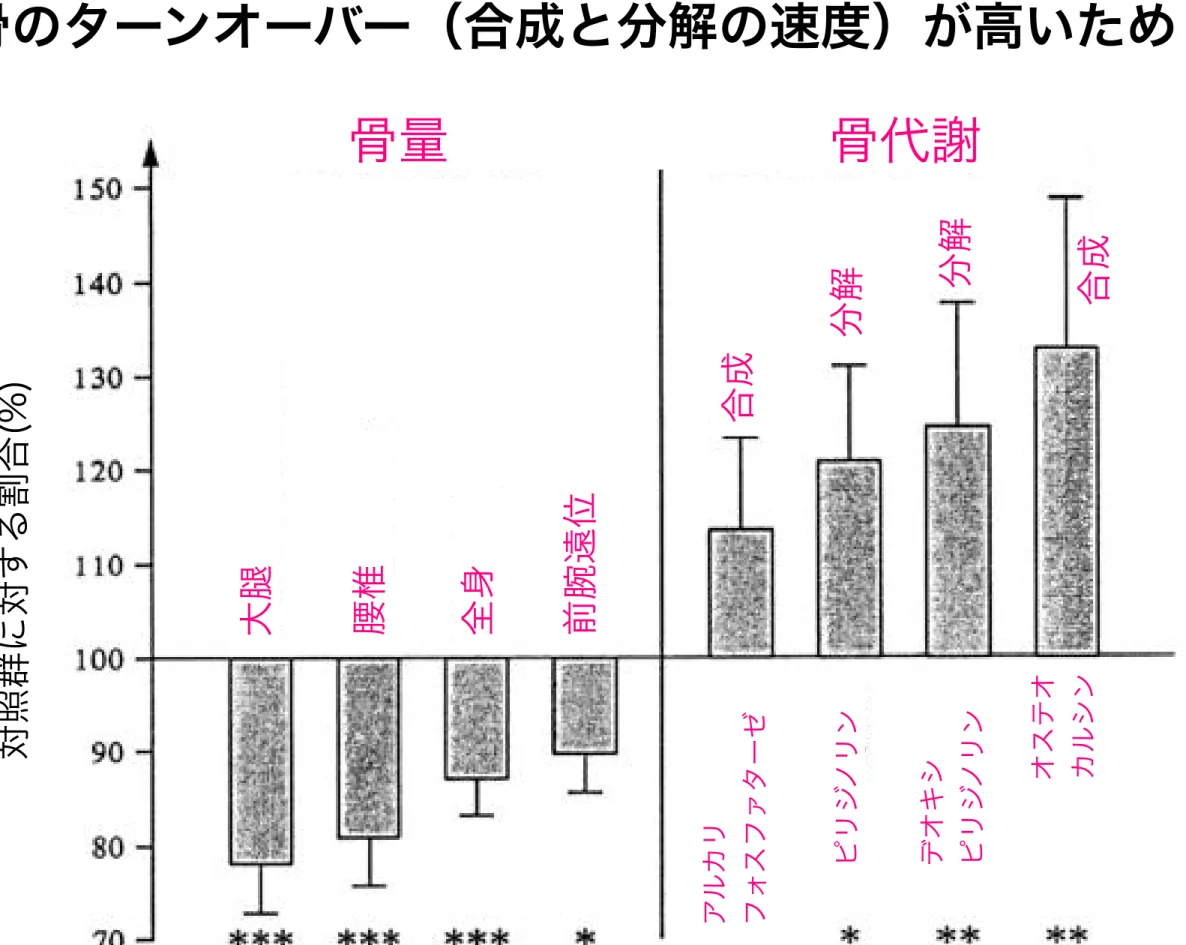
男子長距離ランナーで骨量が少ないのは
骨のターンオーバー(合成と分解の速度)が高いため
Hetland et al. J Clin Endocrin Metab 77: 770-5, 1993
骨量
骨代謝
合成 合成 分解 分解 対照群に対する割合(%) 大腿 腰椎 全身 前腕遠位 ア ル カリ フォ スファターゼ ピリジ ノリン デオキシ ピリジ ノリン オステオ カル シンミネラルウォーターの成分表示から
総登録数 545 件 www.aquatree.net/cgi/map/map.cgi?
Crystal
Geyser Evian
Sam Da
Soo ICE AGE Vittel Perrier Volvic
エネルギー 0 0 ns ns ns ns 0 タンパク質 0 0 ns ns ns ns 0 脂質 0 0 ns ns ns ns 0 糖質 0 0 ns ns ns ns 0 (mg/100mL) ナトリウム 1.13 0.5 0.53 ns 0.73 ns 0.94 カルシウム 0.64 7.8 0.29 0.041 9.10 ns 0.99 マグネシウム 0.54 2.4 0.21 0.0037 1.99 ns 0.61 カリウム 0.18 ns 0.21 0.006 ns ns 0.57 ns: 表示なし
ミネラルウォーターで
カルシウムの所要量を取るためには
カルシウムの
・濃度 9.1 mg/100 mL
・必要な量 650 mg/日
したがって、
7143 mL(約7リットル)飲む必要あり
●ミネラル比較表(資料提供/北海道消費者協会)
カルシウム
マグネシウム
カリウム
(mg/リットル)(mg/リットル) (mg/リットル)
A
24.3
4.1
1.5
B
24.1
5.1
0.5
C
5
1.8
0.8
D
9.4
4.6
0.5
E
11.1
0.4
0.7
札幌市の水道水
7.9
3.3
1.7
ボトルウォーター
ミネラルウォーターと水道水のミネラル
硬水と軟水
水の硬度
=カルシウム量 (mg/L) 2.5
+マグネシウム量(mg/L) 4
軟水
中軟水
硬水
超硬水
0
60
120
180
Crystal Geyser 38
Evian 291
Sam Da Soo 16
ICE AGE 1
Vittel 307
Volvic 49
女子アスリートの摂食障害頻度は一般女性よりも高い
神経性食欲不振症類似者の頻度 (日本、全国の体育系大学1000名:中国、881名) 種目の特徴 種目別 日本 中国 日本 技術系 8.4 1.5 中長距離走 20.7 持久系 20.3 3.3 新体操 16.7 審美系 11.6 3.0 チアリィーディング 11.5 球技系 5.1 3.0 ハンドボール 9.9 パワー系 5.3 0.9 体操 9.1 短距離走 8.7 一般女性 3.2 0.7 陸上跳躍 8.3 (%) ダンス 8 バレーボール 6.7 軟式テニス 6.5 バスケットボ−ル 5 ソフトボール 3.6 一般女性 3.2 (%)Okano et al. Jap J Phys Fitness Sports Med . 45: 419-428, 1996. Okano et al. Jap J Phys Fitness Sports Med . 47: 271-278, 1998.
無月経頻度 ①アスリート>一般学生
������������������②日本 > 中国
無月経の頻度
(日本、全国の体育系大学1000名:中国、881名)
種目の特徴
日本
中国
技術系
3.6
0.5
持久系
20.2
0.0
審美系
6.7
0.0
球技系
2.2
0.0
パワー系
2.6
0.4
一般女性
1.4
0.7
Okano et al. Jap J Phys Fitness Sports Med. 45: 419-428, 1996. Okano et al. Jap J Phys Fitness Sports Med. 47: 271-278, 1998.
表8 無月経の女子選手は骨塩密度とエストラジオール濃度が低い 表8 無月経の女子選手は骨塩密度とエストラジオール濃度が低い 表8 無月経の女子選手は骨塩密度とエストラジオール濃度が低い 無月経ランナー 正常月経ランナー 腰椎骨塩密度 (g/cm2) 1.12 0.04* 1.30 0.03 エストラジオール濃度 (pg/mL) 38.58 7.03* 106.99 9.8 摂取エネルギー(kcal/日) 1622.7 145.1 1965.1 98.4 カルシウム摂取量 (mg/日) 888 105 912 130 平均 標準誤差. * 正常月経ランナーに対して P < 0.01. Drinkwater BL et al. N Engl J Med 311: 277-281, 1984. 平均 標準誤差. * 正常月経ランナーに対して P < 0.01. Drinkwater BL et al. N Engl J Med 311: 277-281, 1984. 平均 標準誤差. * 正常月経ランナーに対して P < 0.01. Drinkwater BL et al. N Engl J Med 311: 277-281, 1984.
0 25 50 75 100 125 150 エネルギー たんぱ く質 脂質 炭水化物 カル シウ ム 鉄 A B1 B2 C 食物繊維 パン マーガリン コーヒー 1日の必要量に対する割合 (%) 一日当たりのエネルギー必要量が3500kcalの場合
各食品から摂れる栄養成分
0 25 50 75 100 125 150 エネルギー たんぱ く質 脂質 炭水化物 カル シウ ム 鉄 A B1 B2 C 食物繊維 パン 卵 牛乳 グレープフルーツジュース バナナ
各食品から摂れる栄養成分
0 25 50 75 100 125 150 エネルギー たんぱ く質 脂質 炭水化物 カル シウ ム 鉄 A B1 B2 C 食物繊維 パン マーガリン コーヒー 1日の必要量に対する割合 (%) 一日当たりのエネルギー必要量が3500kcalの場合0 25 50 75 100 125 150 エネルギー たんぱ く質 脂質 炭水化物 カル シウ ム 鉄 A B1 B2 C 食物繊維 めし 納豆
各食品から摂れる栄養成分
1日の必要量に対する割合 (%) 一日当たりのエネルギー必要量が3500kcalの場合0 25 50 75 100 125 150 エネルギー たんぱ く質 脂質 炭水化物 カル シウ ム 鉄 A B1 B2 C 食物繊維 めし 納豆 卵 牛乳 グレープフルーツジュース
各食品から摂れる栄養成分
0 25 50 75 100 125 150 エネルギー たんぱ く質 脂質 炭水化物 カル シウ ム 鉄 A B1 B2 C 食物繊維 めし 納豆 1日の必要量に対する割合 (%) 一日当たりのエネルギー必要量が3500kcalの場合意外と悪くない朝食
朝食 必要量 エネルギー, kcal 929 891 845 875 たんぱく質, g 37.3 30.6 33.4 32.8 脂 質, g 27.2 19.4 22.1 24.3 炭水化物, g 133.2 144.5 130.8 131.3 カルシウム, mg 486 319 329 225 鉄, mg 5.1 3.2 2.6 1.9 ビタミンA, μgRE 1522 186 190 188 ビタミンB1, mg 0.41 0.33 0.40 0.47 ビタミンB2, mg 0.88 0.89 0.71 0.53 ビタミンC, mg 109 108 121 25 食物繊維, g 12.2 4.3 5.1 8.8食育ヤングリーダー
支援助成事業(大阪府)
発育期に、
低エネルギー・低脂肪・
塩分控えめ?
発育期は、
しっかり動いて
しっかり食べるべきでは?
「脅迫の栄養学はいけない」
これを食べなければいけない
これを食べてはいけない
エネルゲンの研究・開発
抗酸化作用
フリーラジカルって何だ? 近藤元治、1991年、日本医学館
•
酸素は細胞にとって 「毒」である。•
体内で利用される酸素の 数%は反応性の高い酸素 (活性酸素種、フリーラ ジカル)になる。•
酸化ストレスは 活性酸 素種によって引き起こさ れる。•
生体内には防御系が存在 する。•
食成分に抗酸化作用のあ る物質がある(ビタミン C、E) フリーラジカルって何だ? 近藤元治、1991年、日本医学館フリーラジカルって何だ? 近藤元治、1991年、日本医学館
•スポーツ界では最大酸 素摂取量が多いほうが 良いとされている が・・・ •運動時には活性酸素種 が増加。 •過酸化脂質 (TBARS、チオバルビ ツール酸反応物質。 MDA、マロンジアル デヒド)と筋肉傷害に 関係?
•活性酸素種は生体防御に関与。
•運動で傷害を受けた組織の除去・修復過程で活性酸素種が発生する。
フリーラジカルって何だ? 近藤元治、1991年、日本医学館
酸素は細胞にとって毒
•酸化ストレス。活性酸素種・フリーラジカル •抗酸化酵素・成分(栄養素)/ビタミンC、E、βカロチン、ポリフェノール/食色 素だったβカロチンの抗酸化作用 に注目が •運動と活性酸素:最大酸素摂取量が多いほうが良いとされているが・・・/過酸化脂 質(TBARS)/筋肉傷害 •運動による酸化ストレスに対する抗酸化ビタミン(成分)の影響:Kanter/Sumida •「運動は体に悪い」という新書/体力医学会でシンポジウム/代謝量と寿命/ショウ ジョウバエ/冬眠する動物は長命?/少食vs多食/食事制限で寿命延長運動による活性酸素傷害に対する
抗酸化ビタミンの役割
運動
活性酸素
脂質、タンパク質、DNA
酵素系
SOD
Catalase
Glutathione
抗酸化栄養素
ビタミンE
ビタミンC
βカロテン
Kanter et al. J Appl Physiol 74: 956-969, 1993.
•
ビタミンE(α-トコフェロール) 592 mg
•
ビタミンC(アスコルビン酸) 1,000 mg
•
β-カロテン 30 mg
抗酸化ビタミン摂取で
安静時及び運動時の
脂質過酸化が低下する
Kanter et al. J Appl Physiol 74: 956-969, 1993.
抗酸化ビタミン群
プラセボ群
投与前
6週間後
投与前
6週間後
呼気中ペンタン
抗酸化ビタミン
研究で使用されている摂取量と
通常の食生活で摂取している量に差のある一例
Kanter et al.
1993
βカロテン (mg)
30
なし
なし
ビタミンC (mg)
1000
100
なし
ビタミンE (mg)
592
9
800
目安量
上限量
18 29歳男性
マルチビタミン 12種類 マルチビタミン 12種類 マルチミネラル 7種類 マルチミネラル 7種類 ビタミンB1 1.5mg ナトリウム 0.29mg ビタミンB2 1.7mg カルシウム 250mg ビタミンB6 2mg マグネシウム 125mg ビタミンB12 3μg 亜鉛 6mg ナイアシン 15mg 鉄 4mg パントテン酸 6mg 銅 0.6mg 葉酸 200μg セレン 50μg ビオチン 30μg クロム 20μg ビタミンC 300mg ビタミンA 2000IU ビタミンD 200IU ビタミンE 26.8mg
スポーツドリンク「エネルゲン」の研究開発
スポーツドリンク「エネルゲン」の研究開発
Free Radic Res. 1997;26:523-8.
Effect of endurance exercise on the tissue
8-hydroxy-deoxyguanosine content in dogs.
Okamura K et al.
The purpose of this study was to investigate the effect of endurance exercise on both the tissue and lymphocyte 8-hydroxy-deoxyguanosine (8-OHdG)
content. Six dogs ran on a treadmill for 7 hours. Another six dogs were assigned to a sedentary control group. The exercised dogs were sacrificed immediately after exercise and the counterpart of the sedentary group was also sacrificed at the same time. The brain, lung, liver, spleen, kidney,
jejunum, colon, diaphragm, heart, splenius muscle, and the medial and lateral portion of gastrocnemius muscle samples were then collected.
Lymphocytes were sampled before and after exercise in the exercised dogs. The 8-OHdG content of lymphocyte DNA was found to significantly decrease after exercise (0.57 ± 0.19 vs 0.33 ± 0.10/deoxyguanosine (dG) x 105, P <
0.05). The colon was the only tissue which showed a significant decrease in the content (0.83 ± 0.24 vs 0.54 ± 0.15/dG x 105, P < 0.05). No tissue
except for the colon showed any significant changes after exercise. These results therefore indicate that, immediately after endurance exercise, an augmented repair mechanism might thus play a role in the decrease of
8-OHdG in the lymphocytes and the colon, while the 8-8-OHdG generation might be counterbalanced by its repair in other tissues.
Biochem Mol Biol Int. 1997;42:601-9.
No influence of a single bout of exercise on
urinary excretion of
8-hydroxy-deoxyguanosine in humans.
Sumida S et al.
We investigated the effect of a single bout of intensive exercise on the
excretion of 8-hydroxy-deoxyguanosine in the 24 h urine from healthy non-smokers. We studied three exercise tests in Experiment 1; which consisted of incremental exercise to exhaustion on a treadmill in eleven male long
distance runners. Experiment 2; which comprised incremental exercise until reaching exhaustion on a bicycle ergometer in six male untrained subjects. Experiment 3; which consisted of a 20 km run by eleven male long distance runners. No differences in the urinary 8-hydroxy-deoxyguanosine excretion
were observed from days 1 to 3 after each respective exercise regimen. However, significant increases in the plasma creatine kinase activity were observed at 24 h or 48 h after exercise, except for Experiment 2. Our
results thus suggest that the oxidative stress during a single bout of intensive exercise does not result in an accumulation of oxidative DNA damage.
Free Radic Res. 1997;26:507-14.
Effect of repeated exercise on urinary
8-hydroxy-deoxyguanosine excretion in humans.
Okamura K et al
The purpose of this study was to investigate the effect of repeated exercise on oxidative damage to DNA in 10 well trained long distance runners who
participated in an 8-day training camp. The average running distance during the camp was 30 +/- 3 km/day. The amount of urinary
8-hydroxy-deoxyguanosine (8-OHdG) excretion was used to estimate the oxidative DNA damage. Urine samples were collected for both a 3-day control period as well as throughout the camp. Blood samples were drawn after overnight fasting both before and after the camp. Urinary 8-OHdG excretion was significantly increased during the camp compared to the control period (265.7 ± 75.5 vs. 335.6 ± 107.4 pmol/kg/day, P < 0.05). The content of 8-OHdG in the
lymphocyte DNA on the day after finishing the camp did not differ from that before the camp. Plasma TBARS, LDH, CK, CK-MB, and myoglobin significantly rose after the camp (P < 0.05). The plasma beta-carotene levels tended to rise after the camp, while the plasma alpha-tocopherol levels increased significantly after the camp (P < 0.05). These results indicate that repeated exercise
augments oxidative stress and the DNA is also injured by exercise-induced reactive oxygen species. However, the oxidative damage to DNA is not
accumulated by consecutive exercise, although it is sustained as long as the exercise is repeated.
スポーツドリンク「エネルゲン」の研究開発
Free Radic Res. 1997;27:607-18. Effect of a single bout of exercise and beta-carotene supplementation on the urinary excretion of 8-hydroxy-deoxyguanosine in humans.
Sumida S et al.
We investigated the effects of acute exhaustive exercise and beta-carotene
supplementation on urinary 8-hydroxy-deoxyguanosine (8-OHdG) excretion in healthy nonsmoking men. Fourteen untrained male (19-22 years old) volunteers participated in a double blind design. The subjects were randomly assigned to either the beta-carotene
or placebo supplement group. Eight subjects were given 30 mg of beta-carotene per day
for 1 month, while six subjects were given a placebo for the same period. All subjects
performed incremental exercise to exhaustion on a bicycle ergometer both before and after the 1-month beta-carotene supplementation period. The blood lactate and
pyruvate concentrations significantly increased immediately after exercise in both groups. The baseline plasma beta-carotene concentration was significantly 17-fold higher after beta-carotene supplementation. The plasma beta-carotene decreased
immediately after both trials of exercise, suggesting that beta-carotene may contribute to the protection of the increasing oxidative stress during exercise. Both plasma
hypoxanthine and xanthine increased immediately after exercise before and after supplementation. This thus suggests that both trials of exercise might enhance the
oxidative stress. The 24-h urinary excretion of 8-OHdG was unchanged for 3 days after
exercise before and after supplementation in both groups. However, the baseline urinary
excretion of 8-OHdG before exercise tended to be lower after beta-carotene
supplementation. These results thus suggest that a single bout of incremental exercise
does not induce the oxidative DNA damage, while beta-carotene supplementation may attenuate it.
スポーツドリンク「エネルゲン」の研究開発