Author(s)
Okumura, Jun Ernesto
Citation
Kyoto University (京都大学)
Issue Date
2014-03-24
URL
http://dx.doi.org/10.14989/doctor.k18079
Right
Type
Thesis or Dissertation
Textversion
ETD
The Type Ia supernovae rate with
Subaru/XMM-Newton Deep Survey
すばる
/XMM-
ニュートン・ディープサーベイを用いた
Ia
型超新星発生頻度の研究
A dissertation submitted in partial satisfaction of
the requirement for the degree of
Doctor of Philosophy
in
Astronomy
by
Jun Ernesto Okumura
奥村 純
Department of Astronomy, Graduate School of Science
Kyoto University
Abstract
The Type Ia supernovae rate with Subaru/XMM-Newton
Deep Survey
Jun E. Okumura
Type Ia supernova (SN Ia) is an explosion of a white dwarf (WD) which exceeded the Chandrasekhar mass through accumulating material from a companion star in a binary sys-tem. From early time, SN Ia has been well-known for its homogenious brigtness and light curve shape. Particurally, the relation between a light curve width and a peak brightness provides an opportunity to use SN Ia as a distance indicator, which enable us to investigate the expansion history of the Universe. Besides its usage as a cosmological tool, SN Ia is also important as a producer of iron-peak elements, a kinetic-energy sources in galaxy evolution, and an endpoint of binary evolution. Although its importance in astrophysics, the progen-itor systems of SN Ia are yet solved. Two major scenarios are proposed: single-degenerate model, which a single WD accretes material from non-degenerated companion through Roch-lobe overflow, and double-degenerate model, which two WDs which form a binary merge. Although many recent studies have been constraining progenitor systems for individual ob-jects, the needs for statistical studies (delay time distribution, environmental dependence) is increasing to link observation and theoretical understanding on the binary evolution and the explosion. In this context, high-redshift supernova survey is one of the key issue for investigating young population and the evolution of SN Ia.
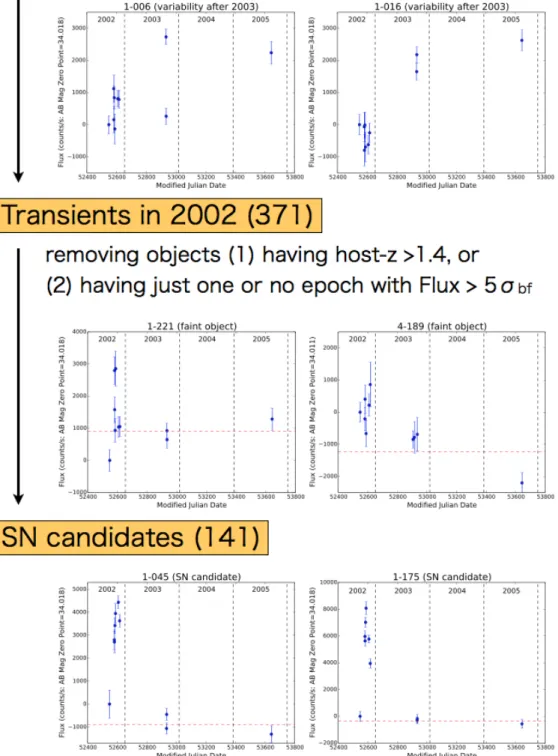
This thesis presents measurements of the rates of high-redshift Type Ia supernovae using data from the Subaru/XMM-Newton Deep Survey (SXDS). We use the data from repeat deep imaging observations with Suprime-Cam on the Subaru Telescope, and detected 1040 variable objects over 0.918 deg2 in the Subaru/XMM-Newton Deep Field. Then 141 super-nova candidates are selected by requiring variability timescale less than one year, and at least two epochs showing 5σb variability. To construct a SN Ia sample from SN candidates,
SN II like objects are discriminated first, through light curve fitting in i0-band. The second component of sample refinement is the removal of SN Ib/c contamination. The author used a portion of sample whose color information is available to estimate possibe contamination from SNe Ib/c. Finally, out of the 1040 variable objects, 39 objects over the redshift range 0.2 < z < 1.4 are classified as SNe Ia. Since the sample refinement is crucial factor for estimating the rates, the properties of SN Ia sample and possible contamination of other transients such like core-collapse SNe and AGNs are carefully examined.
To convert observed number of SN Ia to occurence rates, one needs to estimate the control time (i.e., effective visibility time). The control time depends both on the observation parameters (cadence, limiting flux) and on the supernova modeling (birightness distribution, evolution modeling, dust effect). In this phase, the uncertainty caused by dust extinction and possible evolution of SN Ia parameters are estimated.
Finally, the volometric rates of SN Ia are calculated as following equation: brv(z1< z < z2) = NIa(z1 < z < z2) ∫z2 z1 CT (z) 1+z Θ 4πV (z)dz ,
followed by systematic error) in the unit of 10−4yr−1Mpc−3 at < z >= 0.44, 0.80, and 1.14. We find that the SN Ia rate continues to increase up to z∼ 0.8 and may then flatten at higher redshift. The rates can be fitted by a simple power law, rV(z) = r0(1 + z)α
with r0 = 0.20+0.52−0.16(stat.)+0.26−0.07(syst.)×10−4yr−1Mpc−3, and α = 2.04+1.84−1.96(stat.)+2.11−0.86(syst.).
These results are consistent with measurements by other authours, and are among the most distant SN Ia rate measurements to date.
As to the uncertainty, the statistical error dominates in the lowest redshift bin (0.2 ≤
z < 0.4) due to the small number statistics. In addition, the number of SN Ia in this range is easily affected by core-collapse SNe contaminations, which results in large error. In the middle redshift bin, the rich sample in the range leads to the precise measurement of rate. The effect of systematics is samaller compared with other two bins. In the highest redshift bin, the effect of evolution and dust are large since the control time is sensitive in higher redshift. Nevertheless many uncertainties are included in the rate calculation, the resulted rate is precise comparable with other measurements using different instruments and techniques. Note that this result is derived from single-band light curve fitting and small number of color sample.
The significance of this thesis is that the rates approache to the high redshift regime (z > 1.0) and showed that the technique introduced in this work is effective in the survey such as SXDS. Second, this work will be useful for upcoming large systematic transient survey in the next decade. In particular, Hyper Suprime-Cam (HSC) Survey in Subaru Telescope, is expected to detect about 300 SNe Ia with good quality in the redshift range of 0.2 < z < 1.8. Coupled with analysis used in this work, HSC survey will produce one of the most precise measurement of SN Ia rates up to z∼ 2. This thesis will contribute to the future statistical SN studies.
Keywords:
Acknowledgments
First of all, I would like to thank Tomonori Totani for leading me to the fields in astronomy, in particular high-energy astrophysics and observational cosmology, and initiating my researches in these fields. I have spend an additional year in the bachelor course to join his research group, but that was not a wrong choise. The exact guides and kind advices of Prof. Totani always have been helped my researches. In addition, I thank him for providing a lot of opportunities to study abroad. It was a fortunate situation that I could introduce my works in a number of international conferences and workshopes from early stage. I have learned much from Prof. Totani during my doctoral course and honestly, appreciate for five-years successful collaboration. I also would like to thank to Yutaka Ihara and Prof. Mamoru Doi. This work is based on their initial analysis. In particular, Prof. Doi has introduced me to the Supernova Cosmology Project (SCP) group and his international connections was quite helpful for me. Many results obteined in this thesis were never obtained without the invaluable assistance of the Subaru Telescope staff and the support from Tomoki Morokuma and Naoki Yasuda, who provided me the photometry data of SXDS. They taught me the procedure of image analsys and had many discussion regarding photometric calibration.
This work has been completed due to the international collaboration with SCP group. In particular, Greg Aldering and Chris Lidman have supported me in completing this thesis. Most of the scientific discussion were done with them and I would like to thank them for lots of useful comments and kind considerations. I also appreciate Saul Perlmutter and Anthony Spadafora for accepting me to stay in the Lawrence Berkeley National Laboratory (LBNL) many times. These visits were unforgettable experiences for me. I could have discussions with many top-class scientists and it was also grateful for me that I could spend time with my families living in San Fransisco. In addition, I was honorable for me to work with Prof. Saul Perlmutter. I heard the news of his recieving Nobel Prize in Physics 2011 just before visiting the LBNL, and I remember the discussions we had during the stay very well. I would like to thank the SCP collaboration members, Kyle Barbary, Gerson Goldhaber, Eric Hsiao, Nao Suzuki, Lifan Wang, Kyle Dawson, Reynald Pain, Naohiro Takanashi, and Isobel Hook, for the successful collaboration. During my research in LBNL, David Rubin, Josh Meyers, Yakob Nordin, Clare Saunders, Xiaosheng Huang, Hannah Kakhouri were so kind to me. We had many discussions and chats everyday in the same office.
Regarding studing supernovae as my field, I have been helped from supernova researchers in Japan. I had many useful discussions with Masaomi Tanaka, Nozomu Tominaga, Keiichi Maeda, Takashi Moriya, Masayuki Yamanaka, Takaya Nozawa, Kohki Konishi, Hanindyo Kuncarayakti, Yasuomi Kamiya, Koh Takahashi in weekly seminar. In particular, discussions with Masaomi Tanaka was fruitful for me. I remember that he gave me lots of advices when I was feeling anxious in proceeding to the doctoral course. I would like to express my gratitude to my friend Takashi Moriya. Being in the same grade, I really enjoyed studing supernovae with him. In terms of international conferences, I was happy to spend time with researchers all over the world. I met with Or Graur, Steve Rodney, Nicki Mennekens, Ashley Ruiter, Silvia Toonen, Joke Claeys, Alex Chiotellis, Jelle de Plaa, Wolfgang Kerzendorf, Mikkel Nielsen, Maria Pruzhinskaya, and Timothy Brandt, who are my good friends. I also would like to thank Prof. Ken’ichi Nomoto for useful comments and Prof. Dan Maoz for inviting me to
the workshop at the Lorentz Center.
During five years of research life as a doctoral student, I had many nice colleagues to work with. I thank group members of Prof. Totani: Ken’ichiro Nakazato, Norita Kawanaka, Takeshi Oda, Masakazu Kobayashi, Yuu Niino, Yoshiyuki Inoue, Masanao Sumiyoshi, Ryu Makiya, Takashi Ishikawa, Motonari Tonegawa, Hiroyuki Okada. Especially, I enjoyed talking with Yoshiyuki Inoue about many topics and his adivices were quite helpful. I spent most of my graduate school days at Kyoto University. I thank Kazuo Hiroi, Shun Takeuchi, Shota Furumagi, Tatsuhito Yoshikawa, Takaya Tamura, Akimasa Kataoka, Junpei Tanaka, Yuki Hashimoto, Kohei Ichikawa, Megumi Shidatsu, Andrew Hillier, Kazuya Matsubayashi, Tetsu Anan, Jin Matsumoto, Kiyoto Yabe, Yuuki Moritani, Kaori Kawate, Hiroko Watanabe, and Hiroaki Isobe for a fun time. I also thank the seminar members in the AP seminar, namely, Yudai Suwa, Makoto Takamoto, Kazumi Kashiyama, Kohei Inayoshi, Kenta Hotokezaka, Soichiro Isoyama, Koutarou Kyutoku, and Kazuyuki Sugimura for giving me opportunities to introduce my research to groups in other department. I would like to show my gratitude to Keiko Ohara for her crucial support to my research activities. I spent my last year as a graduate student in the University of Tokyo. During the stay in Tokyo, Shin Mineshige was supporting my research as teaching advisor in Kyoto University. I could spend fun time in Tokyo thanks to Kazuhiro Maeda, Mélanie Godart, Kei Fukue, Takafumi Sonori, Shinogo Shinogi, Goto Ryosuke, Hamid Hamidani, and Ryou Ohsawa.
I had joined many activities during my student life. These activities, though they are not directly related to the science, made my life enjoyable and motivated me to keep working on science. I would like to appreciate my friends in Kyoto University Student Orchestra, Kumon Kokusai Gakuen Blassband Club, Contenporary Art Studies, and Kyoto International Stu-dent Film & Video Festival. I also thank to the member of Kansai Cluster: Takuya Kuratsu, Shohei Kobayashi, Hiromi Suzuki, Akihiro Ohta, Yoshihiro Tanigawa, Tomoyasu Okada, and Takuya Kitagawa. We had a variety of studing seminar ragarding Philosophy, Architecture, Art, Infosocionomics Society, and many other fields. I am confident that these activities gave me diversified perspectives and ways of thinking, which were useful in Astrophysics as well.
I would like to express my sincere gratitude to my parents, Koichi Okumura and Martha Lidia Zeleyandía Cisneros. My interest in the Universe was originated from my young days with my parents. My father brought me to Germany to observe the solar eclipse in 1999, and my mother always has been showing understanding to study Astrophysics. They also gave me a healthy body and finacial supports which are crucial for doing research. I thank to my diligent sister, Akemi. I am proud to be a brother of you. My family in San Fransisco were supportive to me when I was visiting LBNL. Thank you very much Gregorio Zelayandía, Reina, Sonia, Jorge, Daniel, Lucie, and Xochitl. In addition, I appreciate Yoko Marisol Shinohara, for being so kind to me and making me feel positive. I sincerely thank to my soulmates, whose kindness and affectionate words have always encouraged me. I feel so grateful that I could have such magnificent relationships, nice family, friends, and many others who have supported my life.
Finally, I would like to express my sincere appreciation to Aoba Uematsu for being with me throughout my tough years in the doctoral course. She has always cheering me up in spite of her busy bussiness as an illustrator. This thesis has never been accomplished without her support and smile.
This work was supported in part with scientific research grants from the Ministry of Education, Science, Culture, and Sports, Science and Technology (MEXT) of Japan,and by the grant-in-aid for the Global COE Program “The Next Generation of Physics, Spun from Universality and Emergenc” from MEXT. The author has been financially supported by the Japan Society for the Promotion of Science (JSPS) through the JSPS Research Fellowship. This work was also supported in part by the Director, Office of Science, Office of High Energy and Nuclear Physics and the Office of Advanced Scientific Computing Research, of the U.S. Department of Energy (DOE) under Contract Nos. DE-FG02-92ER40704, DE-AC02-05CH11231, DE-FG02-06ER06-04, and DE-AC02-05CH11231.
Contents
1 Introduction 1
1.1 Supernovae . . . 1
1.2 Type Ia Supernova . . . 3
1.3 Delay time distribution. . . 4
1.3.1 theoretical DTDs . . . 4
1.3.2 observational DTDs . . . 4
1.4 High-z SN Ia rate . . . 5
1.5 The Purpose of This Thesis . . . 9
2 Review on Supernovae 11 2.1 Core-Collapse Supernova. . . 11
2.2 Type Ia Supernova (Thermonuclear Supernova) . . . 12
2.2.1 Progenitor. . . 12
2.2.2 Homogeneity and Diversity . . . 14
2.2.3 Evolutional path to SN Ia: Single-Degenerate or Double-Degenerate . 16 2.2.4 The explosion models . . . 21
2.2.5 As a cosmological tool . . . 23
2.3 Progenitors problems of Type Ia Supernova . . . 25
2.3.1 Surviving companion . . . 25
2.3.2 Hydrogen signature. . . 26
2.3.3 Radio and X-ray emission from CSM interaction . . . 27
2.3.4 blue-shifted Na I D absorption . . . 27
2.3.5 Searching possible candidates . . . 27
3 Observations and Sample Selection 29 3.1 Subaru XMM-Newton Deep Survey . . . 29
3.2 Imaging observations . . . 29
3.3 Spectroscopic observations . . . 30
3.4 SN candidate selection . . . 31
3.5 Host galaxy redshifts . . . 33
4 Sample Refinement 37 4.1 Overview of the sample refinement . . . 37
4.2 Discriminating Type II SNe . . . 37
4.3 Discriminating AGN . . . 42
4.5 Properties of SN Ia candidates . . . 44
4.6 The estimated number of observed SN Ia. . . 47
5 Rate Calculation 51 5.1 Control time . . . 52
5.1.1 Simulated light curves of Ia . . . 52
5.1.2 Dust modeling . . . 54
5.1.3 Simulated light curves of II . . . 57
5.2 Control time calculation . . . 57
6 Typing Completeness and Contamination 61 6.1 Estimating typing completeness . . . 61
6.2 Estimating the misclassification ratio . . . 61
6.3 SN Ib/c contamination . . . 66
6.4 Results and systematic error estimation . . . 67
7 Discussion and Application to the Future Survey 73 7.1 Discussion . . . 73
7.1.1 SN Ia rate function . . . 73
7.1.2 Comparison with previous SN rate studies . . . 73
7.2 Application to the Future Survey . . . 79
7.2.1 Hyper Suprime-Cam Transient Survey . . . 79
7.2.2 SN Ia rate studies in HSC . . . 79
7.2.3 Other plannes transient surveys . . . 79
8 Summary 85
A The results of light curvefitting 87
The Type Ia supernovae rate with
Subaru/XMM-Newton Deep Survey
I never could have done what I have done without the habits of punctuality, order, and diligence, without the determination to concentrate myself on one subject at a time.
Charles Dickens (1812 - 1870)
1
Introduction
1.1
Supernovae
A supernova (SN) is an extremely luminous explosion of the star, witch appears suddenly in the celestial sphere. This event has been recorded from ancient history. For example, chinese astronomers has described an appearance of a “guest star” occured in 185 A.D., which is though to be indeed a SN event (Stephenson & Green 2002,Zhao et al. 2006). Tycho Brahe and Johannes Kepler are the remarkable figures for their throughout naked-eye observation; they observed SN 1572 and SN 1604, respectively, and left the most accurate and complete sets of measurement before the telescope era (Brahe 1573, Kepler 1606). In the early 20th century, it become apparent that a supernova is extremely brighter event compared with a
common nova, a sudden brightening of a star (Baade & Zwicky 1934).
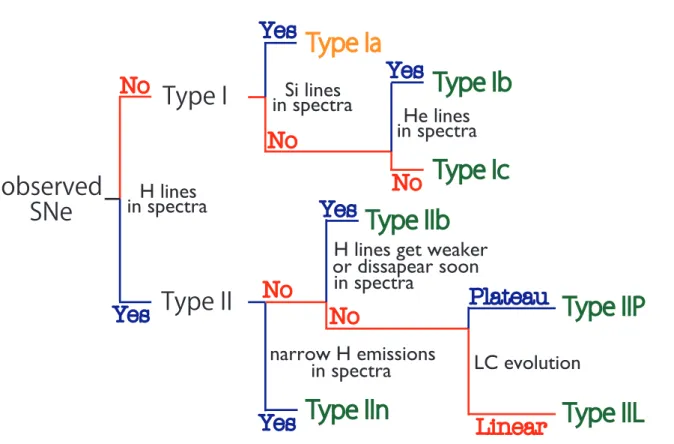
SNe are classified into some subclasses according to their observational feature (e.g. spectrum, light curve shape). The overview of the classification scheme is shown in Fig-ure 1.1 (see also Filippenko 1997 for a detailed review). First, SNe are divided into two categolies from the presense of hydrogen in the optical spectra (first remarks has done by Minkowski 1941). “Type II SNe” (SNe II) are defined by the presense of hydrogen and they show a wide variety of photometric and spectroscopic properties. “Type I SNe” (SNe I) are characterised by hidrogen-deficient and rather homogenious spectra. Among SNe I, three subclasses are known: those whose spectra show strong Si II (Type Ia), prominnent He I (Type Ib), or neither Si II nor He I (Type Ic). SNe II, despite a wide variety of properties, are roughly devided into two groups: those with linearly decaying light curve, SNe II-L, and those showing long-lasting (a few months) plateau, SNe II-P (Minkowski 1964,Barbon et al. 1979,Doggett & Branch 1985). Furthermore, SNe II show-ing relatively narrow emission lines are called SNe IIn, which indicate a presense of dense circumstellar materials (Figure 2.2). It is also known that there are some SNe which are classified as a SN II and later resembles rather a SN Ib, showing links between SNe II and
observed
SNe
H lines
Yes
No
Type I
Type II
in spectra
No
Yes
Type IIn
narrow H emissions
in spectra
H lines get weaker
or dissapear soon
Yes
Type IIb
No
LC evolution
Linear
Plateau
Type IIP
Type IIL
Si lines
in spectra
Type Ia
Yes
No
He lines
in spectra
Yes
No
Type Ib
Type Ic
in spectra
Figure 1.1: Observational classification scheme of SNe (from Moriya 2013). SNe Ia (orange) are thermonuclear explosions (see Section2.2) of WDs and SNe of the other types (green) are explosions of massive stars (see Section 2.1). ‘Linear’ LC evolution used in Type IIL means the linear evolution in time-magnitude plane (Figure2.2).
1.2. Type Ia Supernova 3
SNe Ib/c. This subclass was first proposed byWoosley et al. 1987 from the similar prelim-inary model for SN 1987A, and later, throghout studies on an unusual supernova SN 1993 revealed that this object is actually classified as SN IIb.
1.2
Type Ia Supernova
Among many subclasses of SNe, SN Ia plays important roles in Astrophysics. They are remarkable objects as cosomological distance indicators, having provided the first direct evi-dence of the accelarating cosmic expansion (see section2.2.5). This cosmic acceleration was first reported by two independent supernova observation teams: the Supernova Cosmology Project (SCP) (Perlmutter et al. 1999) and the High-Z SN Search Team (Riess et al. 1998). Since then, many large SN surveys have been carried out to measure the cosmological parame-ters accurately (e.g.,Knop et al. 2003,Tonry et al. 2003,Astier et al. 2006,Riess et al. 2007, Wood-Vasey et al. 2007, Kowalski et al. 2008, Hicken et al. 2009, Amanullah et al. 2010, Sullivan et al. 2011,Suzuki et al. 2012).
Although SNe Ia are effective as standard candles, their progenitors are yet to be con-clusively identified (see section 2.3). It is widely believed that the progenitor of a SN Ia is a binary system containing a C+O white dwarf (WD), and recently the compact nature of the exploding star has been confirmed (Nugent et al. 2011, Bloom et al. 2012; see also 2.2.1). There are two widely discussed scenarios for the progenitor, the single degenerate (SD) scenario and the double degenerate (DD) scenario. In the SD scenario, a C+O WD accretes gas from a companion star in a binary system (see section 2.2.3.1). Its mass in-creases up to the Chandrasekhar limit where it explodes as an SN Ia (e.g., Nomoto 1982, Hachisu et al. 1996, Nomoto et al. 1997). If SNe Ia from the SD scenario exist, the com-panion star survives in the supernova remnant after the SN Ia explosion. Various methods have been used to search for such companion stars, but to date no clear detection has been made (e.g., Ruiz-Lapuente et al. 2004, Ihara et al. 2007, González Hernández et al. 2012, Kerzendorf et al. 2009, Schaefer & Pagnotta 2012, Nugent et al. 2011, Bloom et al. 2012, Brown et al. 2012,Chomiuk et al. 2012,Margutti et al. 2012). Other constraints on the SD scenario had been obtained from X-ray and radio observations, which showed no clear evi-dence of an interaction between the ejecta and the circumstellar material (CSM) surrounding the SNe (e.g. Panagia et al. 2006,Hancock et al. 2011,Chomiuk et al. 2012). Though these observations disfavor non-degenerate donors, some SN Ia spectra show narrow time vary-ing and/or blue-shifted Na I D absorption features possibly associated with a SD donor star (e.g. Patat et al. 2007, Simon et al. 2009, Blondin et al. 2009, Stritzinger et al. 2010, Sternberg et al. 2011, Maguire et al. 2013). These features are also investigated in the con-text of DD scenario (Shen et al. 2013,Raskin & Kasen 2013).
In the DD scenario, a merger of two C+O WDs with a combined mass exceeding the Chandrasekhar mass leads to an SN Ia explosion (e.g.,Iben & Tutukov 1984,Webbink 1984; see section2.2.3.2). Searches have been carried out to detect DD binaries that could be SN Ia progenitors, but strong limits have not yet been reached due to small number statistics (e.g., Koester et al. 2005,Geier et al. 2007).
1.3
Delay time distribution
One promissing way to test the detailed progenitor components is “delay time distribution (DTD)”. SNe Ia explode with a “delay time” between binary system formation and subse-quent SN explosion. This delay time is one of the primary methods for understanding the progenitor scenario of SNe Ia. If we compare theoretical and observational DTDs, this provide opportunities to investigate the components of SN Ia progenitors.
1.3.1 theoretical DTDs
Theoretical DTDs are predicted through binaly population synthesis (BPS) simulation, which is Monte Carlo simulation based on parametrised binary evolution models. As shown in Figure 1.3, derived DTDs from SD and DD models differ in many points. In DD model, the dilay time is essentially determined by the separation of binary, especially in the long delay time range above ∼ 1Gyr. Since two WDs merge through angular momentum loss by gravitational-wave radiation, the timescale of merger is proportional to the separation (a) to the 4th power (see Equation2.7). If the separation distribution is fiven by fsep(a)∝ aα, the
DTD (fsep(t)) should be expressed as
fDT D(t) = dN dt ∝ fsep(a) da dt ∝ t −(3−α)/4. (1.1)
For the separation distribution, it iw a good aproximation to assume α∼ −1 for WDs binaries (e.g. Toonen et al. 2012). As a consequence, the DTD for DD model perform as fDT D ∝ t−1.
All the BPS calculation agrees with a t−1 DTD for DD channel, ranging from short delay time to Hubble time (see Figure1.3).
In the other hand, SD models varies according to authors. This is caused due to the complicated treatment and various parametrization of binary evolution physics (especially, the common envelope phase). Since the timescale of final mass-accretion phase (∼ 1−10Myr, assuming typical accretion rate ˙M ∼ 3 × 10⁻⁷M yr−1), is much smaller than the evolution timescale of the secondary (∼ 1Gyr), the lifetime of the secondary is the dominat factor in the DTD. Taking the small mass range of the secondary for successfull SD system into the account, the resulted DTD will concentrate between a few-hundred Myr and 1-2Gyr. In the larger delay time (≤ 10Gyr), corresponding to a low-mass secondary system, SD channel fails to produce enough SNe Ia due to the low-efficient mass-transfer from non-degenerate donor. In addition, since parametrazations of binary evolution such as mass transfer and common envelope are complicated, BPS calculation produce various DTD shapes.
1.3.2 observational DTDs
From observational side, it has been generally known that more star-forming, or more massive galaxies host more SN Ia (Cappellaro et al. 1999, Mannucci et al. 2005, Mannucci et al. 2006, Sullivan et al. 2006). These results suggest that more SNe Ia arise from younger stellar population (i.e., decreasing DTD function). In the observational point of view, one can recover DTD from SN Ia rates and star-formation histories (SFHs). For example, if the galaxy with age t have a SFH as ψ(t), current SN Ia rate of the galaxy can
1.4. High-z SN Ia rate 5
be expressed as summation of contributions from different time t0 (Figure1.2):
RIa(t) =
∫ t
0
ψ(t0)fDT D(t− t0)dt0. (1.2)
Hence, DTD recovery can be archieved by estimating SN Ia rate and assuming SFH. The pioneering result was Totani et al. 2008. They measured the DTD based on the stellar age estimate of each galaxy in a sample of passively evolving galaxies from Subaru/XMM-Newton Deep Survey (SXDS1), finding that the time distribution could be described by a featureless power law going as fDT D(t)∝ t−1.08±0.15 over t = 0.1−10 Gyr. Other studies using different
methods also show consistency with a t−1 trend (seeMaoz & Mannucci 2012, for a review). The comparison between observation and theoretical prediction of DTDs are shown in Figure 1.3. As noted, t−1 DTDs strongly suggest DD models. SD models concentrate in certain range, and fail to explain a power-law function for wide delay time range (but also see Hachisu et al. 2008for an attempt to explain observed DTDs in SD channels). However, in spite of good agreements with DD models, observed DTDs tend to be higher than predicted. The absolute values of DTDs varies in a facter of 3− 10 among observations and still needs further investigations. The normalization problem may come from the dependence of IMF on galaxy mass, or the assumption of BPS calculations that total masses of WDs should be larger than the Chandrasekhar limit, Mch. Actually, if all double WDs binaries become
SN Ia, time-integrated rate of∼ 0.8×10⁻³M −1matches with observational SN Ia production efficiency, 10−3M −1 (Toonen et al. 2012).
Figure 1.2: Schematic picture of SN Ia rate and DTD.
1.4
High-z SN Ia rate
Though more detailed investigations are expected in both DTD observations and theoretical BPS calculations, the approach from SN Ia rates is shedding light on progenitor populations. Besides the progenitor issues, SN Ia rates is also important in the contexts of Fe production history, kinetic-energy sources in galaxy evolution, and endpoints of stellar binary evolution.
10-1 100 101
Delay Time
[Gyr]10-7 10-6 10-5 10-4 10-3 10-2 10-1 100
SN
Ia
rat
e
[10 − 10 yr − 1 M − 1 ⊙ ]DD models
SXDS passive galaxies(Totani+08) SDSS-II galaxies (Maoz+12) Galaxy clusters (Maoz+10) LOSS-SDSS galaxies (Maoz+11) Magellanic SNRs (Maoz+10) SDSS spectra (Graur+13) Field galaxies (Graur+14)10-1 100 101
Delay Time
[Gyr]10-7 10-6 10-5 10-4 10-3 10-2 10-1 100
SN
Ia
rat
e
[10 − 10 yr − 1 M − 1 ⊙ ]SD models
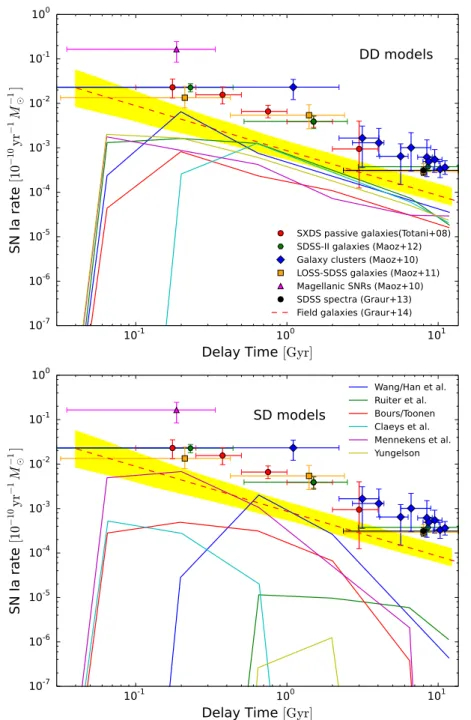
Wang/Han et al. Ruiter et al. Bours/Toonen Claeys et al. Mennekens et al. YungelsonFigure 1.3: Comparison of observed DTD and theoretical BPS simulations. Up-per panel show the results of DD models and lower panel shows SD models. Solid lines represents theoretical DTDs summarized by Nelemans et al. 2013, which all mod-els have the same physical parameters. Several observed DTDs are plotted in both panels: red points by Totani et al. 2008, green points by Maoz et al. 2012b, blue
dia-monds by Maoz & Badenes 2010, orange square by Maoz et al. 2011, magenta triangle by Maoz & Badenes 2010, and black point by Graur & Maoz 2013. The red dashed line is the power-law fit derived by field SN Ia rates, and yellow hashed region represents corresponding 1σ error (Graur et al. 2013). All observed DTDs suggest t−1 power-law, which coincide with theoretical DD models in shapes (but also show somewhat offset), whereas theoretical SD predictions concentrate in certain delay time.
1.4. High-z SN Ia rate 7
SN Ia rate is one of the cutting edge issues, and several systematic surveys such as SDSS Su-pernova Survey2(Frieman et al. 2008,Sako et al. 2008) or Supernova Legacy Survey (SNLS3) are unveiling the nature of SN Ia rates. Recently,Perrett et al. 2012has measured the SN Ia rate over the redshift range 0.1 ≤ z ≤ 1.1 using 286 spectroscopically confirmed and & 400 photometrically identified SNe Ia from SNLS, which is one of the most precise estimation of SN Ia rate in z ≤ 1. Figure 1.4 shows the compilation of recent studies. Nevertheless good number of SNe Ia are studied in z≤ 1, high-z rates are highly unclear due to the magnitude limit of transient surveys. Since the depth to reach high-z and the area to increase sample number is a tradeoff factor, high-z studies always face the small number statistics.
High-z SN Ia rates have been measured in several surveys. Dahlen et al. 2008 obtained the first SN Ia rate measurement beyond z of 1, based on the Great Observatories Origins Deep Survey (GOODS) survey. They used 56 high-redshift SNe Ia, the majority of which were spectroscopically confirmed. Interestingly, they find that the SN Ia rate decreases be-yond z∼ 1.6, contradicting the expectation from the delay time distribution measurements ofTotani et al. 2008. However, the rate in the highest redshift bin (z& 1.4) has a large un-certainty due to small number statistics. The detection efficiency at z > 1.4 rapidly decreases with redshift as the observed bands shift farther into the rest-frame UV. Other high-z rate measurements have been reported in the literature. Graur et al. 2011derived the SN Ia rate up to z∼ 2.0 using 150 SNe from a SN survey in the Subaru Deep Field (SDF), and found that the SN Ia rate levels off at 1.0 < z < 2.0. Their SN classification method is based on a single epoch in the R, i0,and z0 bands, provided inPoznanski et al. 2007b. Barbary et al. 2012 de-rived the SN Ia rate up to z∼ 1.6 using ∼ 20 SNe Ia from the Hubble Space Telescope Cluster Supernova Survey, finding a rate that is broadly consistent with previous measurements but with large uncertainties. The behavior of SN Ia rates at high redshifts is not clear yet and is a key issue in SN Ia studies.
In this context, high-z SN Ia rates (z > 1) play an important role in investigating the DTD, especially for the short delay time regime. If SNe Ia with short delay times dominate SN Ia populations, the cosmic SN Ia rate evolution should closely trace that of the cosmic star formation, and thus high-z SN Ia rates provide information about the short delay time population.
2
http://www.sdss.org/supernova/aboutsprnova.html
0.0 0.5 1.0 1.5 2.0 redshift 0.1 1 10 SN Ia R at e [10 − 4 yr − 1 Mp c − 3 ] Li+'11 Dahlen+'08 Neil+'06 Dilday+'10 Graur+'11 Barbary+'12 Perret+'12 Graur+'13
Figure 1.4: The recent measurements of SN Ia rates. Above z∼ 1, the behavior of rates are still unclear.
1.5. The Purpose of This Thesis 9
1.5
The Purpose of This Thesis
SNe Ia have been played important rool in astrophysics; especially, the role as “standard candle” is remarkable. However, some misteries, in particular progenitor models of SNe Ia still remain as a controversial problem. One promissing aproach to study the progenitor is the SN Ia rates as a function of the delay time (i.e., delay time distribution). Compared with binary population synthesis calculations, observational DTD provide us an opportunity to estimate the evolution history and the fraction of each progenitor models. Thus, SN Ia rates at high-redshift is considered important to investigate DTD, especially for the short delay time. In addition, high-redshift SNe Ia provide lots of information on the evolution and enviromental dependence of SN Ia, which is not clear yet. In the next decade, the significance of investigating high-redshift SNe will keep growing.
In this thesis, we report the mesurement of SN Ia rate to high redshift using the Subaru/XMM-Newton Deep Survey (SXDS) data set. The survey area is large (∼1 deg2) enough to obtain many SNe Ia. With the repeat imaging observations we are able to construct high-quality SN light curves. 39 SNe Ia have been obtained in the range 0.2. z . 1.4 using a classification method that relies primarily on light-curve fitting and photometric redshifts. Spectroscopic identifications, source colors, host galaxy redshifts, and X-ray data are used when available to remove contamination or to improve statistical contamination corrections. The thesis is organized as follows. In chapter 2, a review on supernovae, in particular recent discussions on the progenitor of SN Ia, is summarized. Then the detailed observation used for this study is introduced in chapter3. In chapter4and chapter5, sample refinements and rate calculation are described. The base analysis of the thesis is done in these two chapter. In chapter6, the uncertainties in rate measurements are examined carefully, and discussion follows in chapter 7. Finally, this work is summarized in chapter8.
Throughout the thesis, we adopt the cosmological parameters H0 = 70 km s−1 Mpc−1,
Principles for the Development of a Complete Mind: Study the science of art. Study the art of science. Develop your senses — especially learn how to see. Realize that everything connects to everything else.
Leonardo da Vinci (1452 - 1519)
2
Review on Supernovae
In this chapter, discussions on SNe are briefly summarized. In section 2.1 and section 2.2, the details of core-collapse supernova and Type Ia supernova are introduced. In particular, section 2.2 is comprised of seven subsections, summarizing current understanding on SN Ia (homogeneity, evolution pathway, progenitors, explosion mechanism, application to the cos-mology). Since the progenitor problem is the most interest here, it is separately introduced in section2.3.
2.1
Core-Collapse Supernova
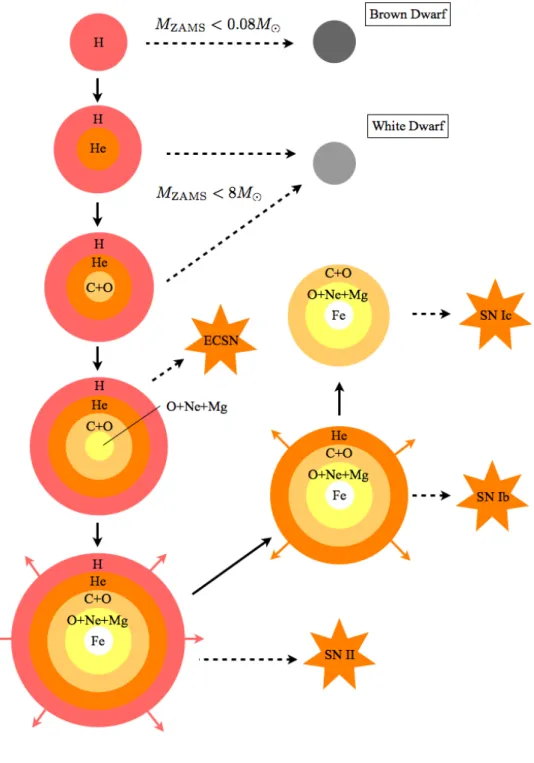
Superenova related to the explosion of the massive star are grouped as core-collapse Super-nova (CC SN). This class includes SN IIP, IIL, IIb, IIn, Ib, and Ic. Though the explosion machanism and the evolution pathway to these SNe are not fully understood, there is a gen-eral picture of core-collapse explosions. When a star evolves, H is converted into He through nuclear burning. If He core exceed a critical mass (0.3M ), He is gnited and C and O are created. In the same way, the core continues its nuclear fusion creating heavier elements. The star with its zero age main sequence (ZAMS) mass greater than∼ 8M but not heavy enough to make Fe (. 10M ), electron capture occurs after the density of the core become around 4× 10⁹g cm−3 (e.g. Nomoto 1987). Since the star at this sage is supported by degeneracy pressure of the core, sudden decrease of electrons lead to the collapse of the core. This may cause an electron-capture SN (ECSN) event. If ZAMS mass is heavier than∼ 10M , nuclear fusion continues until Fe production. As Fe is the most stable nuclei, Fe is accumulated in the core without further burning and the temperature continues to increase. Consequently, at the critical temperature, Fe core is photodisintegrated.
56Fe −→ 134He + 4n− 124.4[MeV] (2.1)
This collapse occurs at a star with 10M . MZAM S . 130M . Difference among CC SN
subclasses is determined by the structure of the star at the explosion point. If outer layer contain enough H, the explosion is observed as SN II. The difference between SN IIL and SN IIP is controversial. Generally, the amount of H layer is thought to determine the two distinct type of SN II. More massive star will experience mass loss due to its large luminosity, blowing away the H layer. This kind of star will explode as SN Ib, and if the remaining He layer is swept away, such a star will explode as SN Ic (see Figure 2.1). As to the mass loss, binarity may contribute to the strip of H emvelope (e.g. Yoon et al. 2010). SN IIn is a subtype of SN II which shows strong narrow emission (Figure2.2). This emission is thought to come from the existence of cirmumstellar media (CSM).
2.2
Type Ia Supernova (Thermonuclear Supernova)
2.2.1 Progenitor
From the observational point of view, SN Ia is characterized by its absence of hydrogen emission lines and the presence of a blueshifted Si II absorption line (λ6355 near-maximum lignt). The first feature means that the atmosphere of the explosing star contains at most 0.1M hydrogen, and the second feature indicate that some nuclear processes take place, whose products are ejected in the explosion. Combining the fact that peak velocities exceed 20,000 km s−1, it is feasible that the explosion is the fusion about 1M carbon and oxgen into Fe group elemets and intermediate mass elements (IMEs) such as Si and Ca. This insight follows the first discovery by Hoyle & Fowler 1960 that an electron-degenerate stellar core might trigger an explosion, and the idea that produced radioactive 56Ni may power light curves of SNe (Truran et al. 1967, Colgate & McKee 1969). 56Ni decay to 56Co with a half time of 6.075 days and then decays further to 56Fe with a half-time of 77.23 days, which naturally explain the decline rate of lightcurve of SN Ia.
56Ni−−−−−−−→6.075d 56Co−−−−−−−→77.23d 56Fe (2.3)
We can also connect the peak luminosity and the amount of56Ni (MNi), by simple calculation
known as the Arnett law (Arnett 1982,Arnett et al. 1985,Branch & Tammann 1992):
Lmax= (6.45e −tr 8.8d + 1.45e111.3d−tr ) ( MNi M ) × 1043erg s−1 (2.4)
where tr is the rise time of the bolometric light curve. The dominance of Fe II lines after
about 2 week from the maximum also supports this progenitor model. For these reasons, there is wide consensus that SN Ia is a thrmonuclear explosion of a Chandrasekhar-mass C+O white dwarf. A white dwarf (WD) is a compact stellar remnant composed mostly of electron-degenerate matter, which is formed at the final evolutionary phase of stars whose mass is not high enought to become a neutron star. A WD, since it is a degenerate star, has the maximum mass that can support itself by electron generacy pressure. This limit is called the Chandrasekhar limit after Subramanyan Chandrasekhar, who carried out the accurate
2.2. Type Ia Supernova (Thermonuclear Supernova) 13
0 20 40 60 80 100 120 140
rest day from maximum
0 1 2 3 4 5 6 rel ati ve m ag nit ud e V-11 V-13 SN1999em (IIP) SN1980K (IIL) 4000 4500 5000 5500 6000 6500 7000 wavelength λ [Å] 0 5 10 15 20 25 30 35 Fl ux Fλ [10 − 15erg · s − 1·cm − 2·Å − 1 ] SN199S (IIn) SN1999gi (IIP)
Figure 2.2: Left: The comparison of light curves of SN IIP and SN IIL. The green data is the photometry of SN 1999em from Elmhamdi et al. 2003, and the blue data is that of SN 1980K fromButa 1982. Right:The comparison between spectra of normal SN II, SN 1999gi (Leonard et al. 2002), and typical SN IIn, SN 1998S (Lentz et al. 2001,Fransson et al. 2005). The figure was constructed from The CfA Supernova Data Archive4.
calculation of the limit (Chandrasekhar 1931). It is about 1.4M for a C+O WD. If we stand for this simple progenitor model, the homogenious observational features of SN Ia are quite naturally explained. Recently, remarkable conclusion was made by Nugent et al. 2011, Bloom et al. 2012. They analysed very early time observation of SN 2011fe, which occured at nearby galaxy M101 (6.4 Mpc), and concluded that this SN Ia is acutually an explosion of compact star with radius smaller than 0.1R . Using the similar technique,Zheng et al. 2013 derived a constraint of R0< 0.25R for nearby SN 2013dy at NGC 7250 (13.7 Mpc).
2.2.2 Homogeneity and Diversity
SN Ia is known for its homogenious properties such as peak magnitudes, spectra, and light curve shapes, but exhibiting only small differences (Branch 1998). Until early 1990s, it was believed that approximately 85% of SNe Ia belong to “normal” (or “Branch normal”) SNe Ia according to the classification byBranch et al. 1993. Generally, SNe Ia rise to its maximum with small dispersion:
MB ∼ −19.05 ± 0.38 + 5 log(H0/65), (2.5)
where H0 is the Hubble constant in the unit of [km s−1Mpc−1] (Hamuy et al. 1996).
Furthermore, SNe Ia are known to have a prominent relation between their decline rates and brightness, indicating that the brightness of SNe Ia is arrangeable in a one-parameter se-quence. Fainter explosions are redder and have a faster decline light curve, whereas Brighter events have a slower decline light curve. This correlation, known as “Phillips relation” (Fig-ure 2.3), have two major method of parametrization: the decline rate in magnitude from maximum light to 15 days after (∆m15: Phillips 1993, Hamuy et al. 1996) and the simple
2.2. Type Ia Supernova (Thermonuclear Supernova) 15
good “standard candle”, the astrophysical object whose luminosity can be calibrated. Thanks to the Phillips relation, the dispersion of peak brightness is reduced significantly.
However, recent observations also shows that peculiar subtypes, very luminous or sub-luminous SNe Ia, can hold∼30% of all SNe Ia (Li et al. 2011b). Here we sammarize current understanding of those subtypes and peculiarities.
Branch normal SN Ia:
This class was first defined as SNe Ia whose optical spectra resemble those of SNe 1981B, 1989B, 1992A and 1972E rather than those of the peculiar SNe 1991T or 1991bg (Branch et al. 1993). More specifically, conspicuous absorption features near λ6150 (Si II) and near λ3750 (Ca II) are seen around maximum light with some other IMEs features, and a few weeks later Fe II features become apparent around λλ4000-5000. The majority of SN Ia belong to this class.
91bg-like SN Ia:
Some SNe Ia such like SN 1991bg, 1992K, 1999by, and 2005bl form a subluminous class of SN Ia which some of them may violate the Phillips relation (Figure 2.3). B-band peak absolute magnitudes are around MB ∼ −17, roughly one magnitude fainter than “normal”
SNe Ia. Light curves of 91bg-like object decline unusually quickly, also showing no second maximum in I-band, which is common feature of normal SN Ia light curve. As to spectra, the most striking peculiarity of SN 1991bg is the presence of a broad absorption feature around
λλ4150-4400 produced by a blend of Ti II, accompanied by a deep absorption near λ5000.
The abundance of IMEs is higher than normal group, also showing low expansion velocities. In addition, little iron and the evidence for unburnt C and O are characteristics for these SNe Ia. Inferred amount of 56Ni is very low (e.g. ∼ 0.07M for SN 1991bg). According to Li et al. 2011b, these subluminous class accounts for about 15% of all SNe Ia.
02cx-like SN Ia (Iax):
These unusually subluminous object, grouped as “SNe Iax”, have recently garnered consider-able interest within the community (see Foley et al. 2013 and reference therein). SNe Iax is spectroscopicaly calacterized by their lower maximum-light velocities (2000 ≤ |v| ≤ 8000km s−1; even lower than 91bg-like object). Maximum light spectra resemble those of the luminous SN Ia 1991T (see the next paragraph), with blue continua and absorption from higher-ionization species consistent with a hot photosphere. At late-time, spectra are domi-nated by narrow permitted Fe II lines. Interestingly, this class favors late-type galaxies and no SNe Iax is discovered in elliptical galaxies, indicative of a preference of their environments. In addition, this class harbor some extreme members. SN 2008ha and SN 2010ae are unusu-ally faint objects (∼ −14 mag) and the estimated amounts of56Ni are about 0.001−0.01M . In SN 2008ha case, it is suggest that the most plausible explanation was a failed deflagration of a WD (Foley et al. 2009, Foley et al. 2010). Li et al. 2011b estimated that SNe Iax con-tribute ∼ 5% of all SNe Ia, however, with their underluminous nature, it is suspected that the volumetric fraction of SNe Iax can even reach 30+21−15% (Foley et al. 2013).
SN 1991T is a well-known prototype of luminous SNe Ia. At near maximum light of pectrum of SN 1991T is strikingly peculiar in having unusually weak lines of Si II, S II, and Ca II. Also prominent features of Fe III can be seen. One week later, this object has developed all the usuall Si II, S II, and Ca II features. Three weeks after the maximum, spectra become almost normal. This class contributes∼ 9% of all SNe Ia (Li et al. 2011b).
superluminous SN Ia:
Recently, some superluminous SNe Ia have reported, putting them well above the Phillips relation. With their maximum luminosity (brighter than ∼ −20 mag), these events have brought a mystely about their progenitor. For example, SN 2009dc is the brightest SN Ia so far, which reached MV = −19.9 even assuming null extinction in the host galaxy
(Yamanaka et al. 2009). Combined with the fact that the explosion is nearly spherically symmetric (small polarization < 0.3% was estimated by Tanaka et al. 2010), SN 2009dc re-quires 1.6± 0.4M of56Ni (assuming A
V = 0.29 mag), challenging the Chandrasekhar mass
WD explosion model. SN 2009dc can be a result of the explosion of two WDs whose total mass exceeds Chandrasekhar limit, but alternative scenario byHachinger et al. 2012suggests that an rapid rotating 2M WD can explain the observation. Explosion models of these su-perluminous (super-Chandrasekhar) explosions are still under controversial discussions.
2.2.3 Evolutional path to SN Ia: Single-Degenerate or Double-Degenerate
Although there is a concensus that SN Ia is an explosion of a Chandrasekhar-mass WD, the evolution path to the explosion is yet unsolved. Even more, some alternative theoretical mod-els suggest that a WD can explode with sub-Chandrasekhar masses or super-Chandrasekhar masses. We also have to explain how these subclasses of SN Ia are formed. So far, the ex-planation of these deviation can be made from both binary evolution theory and explosion mechanisms. Here we briefly summarize known evolutional paths to SN Ia explosion.
First of all, since single WD cannot reach a critical mass alone, mass accretion from other star, witch form binary system together, is needed. Current understang is that a companion star is a non-degenerated star such like red giant (RG) and main-sequence (MS) star, or degenerated WD. The former process is called “single degenerated (SD) senario” and the latter is called “double degenerated (DD) senario” (see the schematic figure in Figure 2.4). 2.2.3.1 Single Degenerate Model
Hydrogen-burning donors:
SD model were thought to be the most promising SN Ia progenitor model in the past, since these system accutually exist in the Nature, observed as reccurent novae. If a binary composed of two stars with different masses is created, the heavier star evolve faster than the other, and finally evolve to a C+O WD when the MZAMSis within a certain mass range. This range
can be infered from the mass enough to fuse helium in the core of the star, but not heavier than the mass which carbon fusion occurs (i.e. 0.5M . MZAMS. 8M ). This stage is also
known for unstable mass trasfer to the secondary (lighter star). When the primary become
2.2. Type Ia Supernova (Thermonuclear Supernova) 17
0.5
1.0
1.5
2.0
2.5
∆m
15(B
)−21
−20
−19
−18
−17
−16
−15
−14
−13
Ab
so
lut
e M
ag
nit
ud
e
M
B
09dc 07if 03fg
10ae
08ha
07qd
02cx
05hk
91bg
CfA3 SNe
91bg-like (subluminous)
superluminous
02cx-like (Iax)
Phillips Relation
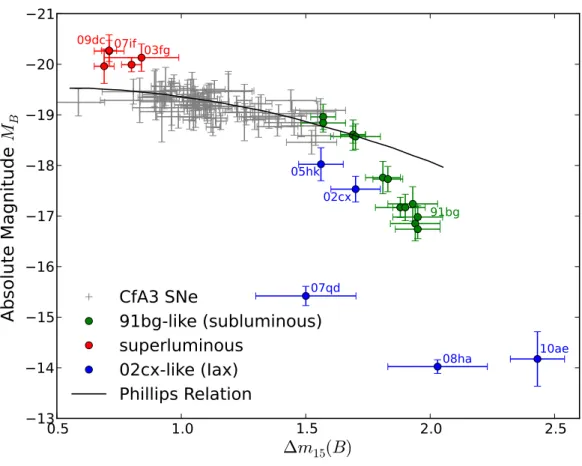
Figure 2.3: Absolute magnitude MB vs. decline rate ∆m15 diagram for SNe Ia. Gray
data are from a subsample of the CfA3 SNe Ia5 (Hicken et al. 2009). For peculiar subtypes, green data represent “subluminous (SN1991bg-like)” SNe Ia (Taubenberger et al. 2008), red data represent “superluminous” SNe Ia (Taubenberger et al. 2011), and SNe Iax (SN 2010ae: Stritzinger et al. 2013, SN 2005hk: Phillips et al. 2007, SN 2002cx: Li et al. 2003, Phillips et al. 2007, SN 2007qd: McClelland et al. 2010, and SN 2008ha: Foley et al. 2009). Black line shows a correlation for normal SNe Ia. All magnitudes are corrected to H0 = 70
km s−1 Mpc−1 cosmology, and ∆m15 of CfA3 sample are derived using conversion eqution
from SALT2 fitter parameter (x1, equivalent with stretch factor) as ∆m15= 1.09−0.161x1+
2.2. Type Ia Supernova (Thermonuclear Supernova) 19
the asymptonic giant branch (AGB) star, hydrogen-rich envelope expands, and transfer its mass to the secondary through the “Roche-lobe”, a teardrop-shaped space defined by the region which material is bound to the secondary by gravity. Mass transfer from an evolved AGB star is dynamically unstable, and create a “common envelope”, which finally disapear by recieving momentum from the orbiting star. As a result, the orbital separation shrink by tenth times, leaving a C+O WD (core of the primary) and non-degenerate secondary (likely still on the main sequence). Then the secondary starts to evolve with a delay. At some later stage, the secondary fills its Roche-lobe, and mass transfer to the primary should occur. This time, the mass transfer is stable and the primary WD can accumulate its mass to the Chandrasekhar limit. This track was first discussed by Whelan & Iben 1973,Nomoto 1982, Iben & Tutukov 1984,Paczynski 1985(seeRuiter et al. 2009and reference therein for recent models).
Whether these system lead to the thermonuclear explosion depends highly on the ac-cretion rate from the secondary. Figure 2.5 illustrate this situation. In a lower accretion rate ( ˙M ≤ 10−7), accreted hydrogen-rich material accumulate on the WD gradually. When the hydrogen-rich envelope on the WD reaches a critial mass, hydrogen ignites to trigger a
nova eruption, or hydrogen shell flash. According to classical nova observations, nova ejecta
contain white dwarf matter, i.e., carbon and oxygen for C+O WDs and oxygen, neon, and magnesium for O-Ne-Mg WDs (e.g. Prialnik 1986, Kovetz & Prialnik 1994). This lead to the consequence that classical novae cannot accumulate enough mass, but rather are eroded gradually after many cycles of nova outbursts.
Next, in a higher accretion rates, accreted material will be heated to the temperature enough to burn H and He stably, which converted materials (i.e., carbon and oxygen) are ac-cumulated on the WD. Recurrent novae, whose eruption repeat in timescals of a decade to a century, are possible candidates of this track. Observationally, recurrent nova do not show heavy elements such as carbon, oxygen, and neon enriched in ejecta, and short recurrence periods are plausible to make massibe WDs close to the Chanrasekhar limit (Starrfield et al. 1985,Starrfield et al. 1988,Livio & Truran 1992,della Valle & Livio 1996). Finally, in the case that the accreteion exceeds the consumption of hydrogen and helium,
˙ M > ˙Mcr∼ 7.5 × 10⁻⁷ ( MWD M − 0.4 ) M yr−1 (2.6)
unburned material ( ˙M − ˙Mcr) expands around WD and cause strong wind. Though
consequences of this track is still unclear, a series of papers Hachisu et al. 1996, Hachisu et al. 1999b,Hachisu et al. 1999adiscuss the effect that the wind stabilizes the mass transfer and limit the accretion rate suitable for mass accumulation to the WD.
Helium-burning donors: It is also possible that a WD accretes mass from helium-burning
stars. Solheim & Yungelson 2005showed that such systems like AM CVn may contribute to the SNe Ia population. The most characteristic feature for this group, since the secondary has rather larger ZAMS masses, is that the timescale to the explosion is faster than fiducial SD model (e.g. Ruiter et al. 2009,Iben et al. 1987,Wang et al. 2009a). Though these events are rare, it may be important sources to explain SN Ia with short evolutional timescales. These explosions are grouped as the acronym HeRS by some authors.
0.7 0.8 0.9 1.0 1.1 1.2 1.3 1.4 MWD [M⊙] −12 −11 −10 −9 −8 −7 −6 −5 −4 log ˙ M [M ⊙ yr − 1 ] log(∆MH/M⊙) =−3.5 −4.0 −4.5 −5.0 −5.5 −6.0 −6.5 ˙MEH ˙Mcr ˙Mstd H-shell Flash (Nova)
Optially Thick Wind (Accretion Wind)
Figure 2.5: Response of white dwarfs to mass accretion is illustrated in the white dwarf mass and the mass accretion rate plane (reconstructed from Figure 9 ofNomoto 1982). M˙EH
is the Eddington critical rate for hydrogen, ˙Mstd is the accretion rate which is necessary for
steady hydrogen burning, and ˙Mcr is the cretetical accretion rate that is comparable to the
hydrogen consumption rate approximated as Equation 2.6. The value ∆MH is the mass of
the accreted hydrogen-rich envelope at the ignition of hydrogen. In lower ˙M , WD experiences
nova eruptions rather than accumulating mass, and orange hached region allow the stable hydrogen-burning, which lead WD to the Chandrasekhar limit. In higher M , unburned˙
material expands and cause strong wind. If we adopt the model of Hachisu & Kato 2001, accretion rate range allowed for SN Ia progenitor will expands to the higher end (thus ˙MEH
2.2. Type Ia Supernova (Thermonuclear Supernova) 21
2.2.3.2 Double Degenerate Model
Another promissing progenitor of SN Ia is double-degenerate model, proposed in classical studies of Iben & Tutukov 1984, Webbink 1984. If the mass transfer from the secondary through its Roche-lobe is unstable, the second common envelope takes place, leaving the primary C+O WD and the secondary C+O or He WD system (e.g. Ruiter et al. 2009). A detached WDs binary will eventually reach contact due to angular momentum loss from the emission of gravitational radiation. Then the less-massive WD finally accrete onto the primary WD, leading to a SN Ia explosion when the total mass exceed the Chandrasekhar mass (Tutukov & Yungelson 1979). According to the general relativity, the decline rate of the binary separation, a, can be expressed as below (in the case that the orbit is circular):
˙a a = 2 ( ˙ J J ) gw =−64 5 G3 c5 M1M2(M1+ M2) a4 ∝ a−4, (2.7)
where J is the angular momentum of the binary, and M1 and M2 are masses of the primary
and the secondary, respectively.
Nevertheless this model explain the absence of hydrogen and the mass accumulation to the Chandrasekhar limit, it has been critisied by some aspects. First, according to the argument of Saio & Nomoto 1985, the accretion from the seconary WD whould not lead to central burning but rather burning in the outer layers of the primary WD, where the density is low. The outcome is that C+O WD transform into an O-Ne-Mg WD, but not a SN Ia explotion. This WD is thought to finally collapse to form a neutron star (accretion-induced collapse; AIC), since electron captures become impoartant at high central densities of the O-Ne-Mg WD (Miyaji et al. 1980). Mergers of massive WDs with a close mass ratio may avoid AIC (“violent merger”). Secondry, population synthesis calculations show that even if all C+O WDs with Mtot≤ MCh become SN Ia, the estimated birthrates are facor of a few lower than
observed SN Ia rates (e.g. van Kerkwijk et al. 2010, Badenes & Maoz 2012). Some event with Mtot< MCh may contribute to SN Ia population (see section1.3).
Recently, though there are still controvercial discussions, DD model is thought to be the major pathway to SN Ia population. Remarkable signatures are SN Ia rates, and absence of circum-stellar material and surviving secondary. All these observation constraints are introduced in section2.3.
2.2.4 The explosion models
2.2.4.1 Ignition and explosion mechanism
Although the explosion physics is not clearly understood, theoretical stuedies are try-ing to provide reasonable models for SN Ia explosion (see Hillebrandt & Niemeyer 2000, Hillebrandt et al. 2013 for review). If the accreting WD reach to the Chandrasekhar limit, the energy budget near the core is governed by plasmon neutrino cooling and compressional heating. At later stage, higher temperature near the core cause convective carbon burn-ing period (known as “simmerburn-ing phase”) for ∼ 1000 yrs. If the temperature become high
enough that the timescale for thermonuclear burning (τb) becomes much smaller than the
timescale of convection (τc), the propagation of combustion waves starts. The reacutive
Eu-ler equations allows two mode of combustion waves: one is called “deflagration”, subsonic wave that burn carbon and oxgen to IMEs, and the other is called “detonation”, super-sonic wave which produce iron-peak elements. Combined with the observation signatures of typical SN Ia, the explosion cannot be explained by pure-detonation nor pure-deflagration model. Therefore, the consensus is that typical SN Ia starts to explode with subsonic de-flagration, and then transisiton to the supersonic detonation occurs at some critical points (so-called “delayed-detonation model”). These waves propagate whole WD, and will explode as SN Ia. Some numerical simulations succeed in reproducding reasonable SN Ia spectrum (e.g. Röpke 2007, Woosley 2007, Woosley et al. 2009, Poludnenko et al. 2011), at the same time, some uncertainties (e.g. the way the deflagration ignites) makes it hard to realize SN Ia in simulations.
Alternative models are recently favored in the context of birthrates. One is called
sub-Chandrasekhar-mass double detonations. According to this model, a C+O WD accretes mass
from helium donor (either degenerated WD or non-degenerated star), creating thin He layer onto WD. After He layer grow enough massive to ignite He material, a detonation in the layer starts. This shock propagates into the C+O core, and finally the core experiences second detonation (“edge-lit detonation”) even if WD does not reach Mch. Recent studies (e.g.
ref) indicate that this model can reproduce normal SN Ia, however, it produce significant amount of Ti in the outer layers, which is inconsistent with normal SN Ia. This model would explain the feature of subluminous 91bg-like SN Ia. As to double-degenerate merger scemario (“violent merger”), the entire treatment of merger and explosion was hard to archieve in the past computational resources. However, recent studies report that normal SN Ia is acctually produced in the merger simulations (e.g. 207).
All these models yet have ups and downs, and further investigation and observational constraints are expected in the future.
2.2.4.2 After the explosion
After the explosion provides kinetic energy and unbind WD, the photosphere of SN Ia ex-pands. Gamma rays produced by radioactive decay of 56Ni (see Equation 2.4) hold major-ity of optical lights. The optical spectra is well characterized by black-body radiation of photosphere and absorption lines of IMEs. As the SN expands, the light-emitting region (photosphere) recedes and finally reach to the phase that the energy deposition rate become comparable with radiation, that is, the peak of light curve. Then the light curve starts to decline, and as photosphere unveil inner part of SN, Fe starts to characterize the spectra. In infrared, light curves for normal SN Ia show the secondary maximum after about 40 days. This is due to the ionization evolution of the iron-peak elements in the ejecta (Kasen 2006). After hundreds of days, the decline of light curve is equivalent with the decay of 56Co, and spectra are dominated by emission lines from iron-peak elements. Free expansion of the ejecta continues, sweeping out circumstellar and interstellar gas, and eventually, after tens to hundred years, a shell of shocked gas cause strong X-ray emission (“Sedov phase”). Those objects are called “Supernova remmant”.
2.2. Type Ia Supernova (Thermonuclear Supernova) 23
2.2.5 As a cosmological tool
After the discovery of the expantion of the universe, its expansion history is one of the key issue in current physics. SN Ia, as a good distance indicator, has been contributed to unveil the geometry of the universe (seeHowell 2011 for a review).
In non-Euclidean space such as expanding universe, the distance defined by the luminosity of the object with redshift z, DL(z), depends on the cosmological parameters:
DL(z) = (1 + z) ∫ z 0 c dz0 H0 √ (1− Ωtot)(1 + z0)2+ (1 + z0)3ΩM + Ωrad(1 + z0)4+ ΩΛ , (2.8) where ΩM, Ωrad, and ΩΛ, are the energy densities of matter, radiation, and dark energy.
Considering the small fraction of radiation (Ωrad ∼ 10−4) and assuming the flat universe
(Ωtot = 1), “distance modulus”, the difference between the apparent magnitude and the
absolute magnitude of the object, can be expressed as a function of ΩM and ΩΛ.
µ(z) = m− M = 5 log10 ( DL(z) Mpc ) + 25 = 5 log10 {∫ z 0 c dz0 H0 √ (1 + z0)3Ω M + ΩΛ } + 5 log10(1 + z) + 25 (2.9)
Since z and m can be obtained by observation, one is able to constrain cosmological param-eters by estimating the absolute magnitude, M . This is the basic idea of supernova cosmology. Actually, M can be estimated using well-known light curve shape-versus-luminosity relation (Phillips relation, see section2.2.2). Most common formalism is explessed with stretch factor (s) and color of SN Ia (c).
µ(z) = mB− MB+ α(s− 1) − βc, (2.10)
where α and β are the slopes of the relations, and mB and MB is the apparent/absolute
magnitudes. Recently, alternative measurement for standarizing SN Ia luminosity is proposed. Bailey et al. 2009 andBlondin et al. 2011 showed that some flux ratios (e.g. R642nm/443nm) can reduce the scatter in the luminosity calibration. Various techniques are used to determine the absolute magnitude, and many light curve fitter were developped so far (e.g. SALT2 by Guy et al. 2007; SNANA by Kessler et al. 2009b ; MLCS2k2 by Jha et al. 2007; SiFTO by Conley et al. 2008).
The expansion history of the universe is often characterised by the equation of state, w, which can be constrained by cosmologial parameters. If we take a arbitrary length scale in the universe, a, the universe evolves according to dominant components as
ρ∝ a−3(1+w)= a−3 (w = 0; normal matter) a−4 (w = 13; relativistic component)
1 (w =−1; corresponding to Enstein’s cosmological constant, Λ) (2.11)
In the late 1990s, two independent supernova observation teams: the Supernova Cosmology Project (SCP) (Perlmutter et al. 1999) and the High-Z SN Search Team (Riess et al. 1998)
found the strong evidence of nonzero ΩΛ, which suggest the accelerating cosmic expansion.
Since then, many large SN surveys have been carried out to measure the cosmological parameters (e.g., Knop et al. 2003, Tonry et al. 2003, Astier et al. 2006, Riess et al. 2007, Wood-Vasey et al. 2007, Kowalski et al. 2008, Hicken et al. 2009, Amanullah et al. 2010, Sullivan et al. 2011, and Suzuki et al. 2012). Now there is a general concensus that this universe is dominated by dark energy (ΩΛ∼ 70%), which perfoms as a w ∼ −1 component.
Although the first results by SCP and High-Z Team were using just tenth of SNe Ia, thanks to many strategic surveys, the number of cosmological SN Ia sample is dramatically increasing to hundreds. Now the statistical error is subdominant in the estimation of w, meaning that the reduction of the systematics is highly needed. Several dominant systematics can be summarized as below.
Calibration
The primary systematic uncertainties afecting SNe Ia depends on survey, but there is a general agreement that the largest component is calibration. This include the measurement of standard stars (flux reference), the measurement of zero points (e.g. Kessler et al. 2009a), K-correction (e.g. Hsiao et al. 2007), calibration to the historic Landolt phyotometric system used for nearby historical supernova. These factors will be reduced if precise mearurements of standard stars are carried out and low-redshift samples observed in Landolt system are replaced with well-calibrated ones.
Reddening
When estimating the absolute brightness, reddening effect should be corrected properly. As a general trend, redder SNe Ia are fainter. However, it is not clearly understand how much of the effect is due to the intrinsic color-luminosity relation, or to the dust extinction. It is also controversial that that the slope of color-luminosity relation, β (= RB = RV − 1),
prefer small value compared to Milky Way dust (RB = 4.1). In most cases, the values of
β come within the range of β ∼ 2.5 − 3.5 (e.g.Elias-Rosa et al. 2006, Krisciunas et al. 2006, Krisciunas et al. 2007,Elias-Rosa et al. 2008,Folatelli et al. 2010). Some studies show that the value of β differs when devided to separate groups. For example, smaller β is prefered by SNe Ia with lower ejecta velocity (Wang et al. 2009b), smaller collor excess E(B− V ) (Nobili & Goobar 2008, but contradicting withFolatelli et al. 2010), and those SNe Ia at low star-formation rate hosts (Sullivan et al. 2010). Whereas the conclusion cannot be made yet, one way to avoid this problem is infrared observation, which the effect of dust is minimized (e.g. Krisciunas et al. 2004,Wood-Vasey et al. 2008).
Restframe U-band
In optical bands, the light from SNe Ia at higher redshift correspond to shorter wavelength at rest-frame. The weakpoint of this shift in wavelength is that SN Ia has a great deal of scatter in rest-frame U-band (e.g. Ellis et al. 2008). The uncertainty might arise from intrinsic dispersion or pool calibration in U-band. However, this systematics can be reduced by constructing a well-calibrated sample in low-redshift.
2.3. Progenitors problems of Type Ia Supernova 25
It is known that the luminosity and the color of SN Ia have correlation be-tween the host properties such as star-formation rate, stellar mass, and metallic-ity (e.g. Hamuy et al. 1996, Howell 2001, Sullivan et al. 2006, Gallagher et al. 2008, Howell et al. 2009, Sullivan et al. 2010). The problem here is that the residual in cosmo-logical fit, i.e., Hubble residual, still show some dependence on the host properties. This may suggest that we need another correction term in Equation 2.10. For example, theoretical studies indicate that SNe Ia at low-metal environment become fainter, because high matallic-ity WD yeld stable58Ni rather than radioactive56Ni (Timmes et al. 2003). If the metallicity effect explain the host dependence, host mass or host metallicity will be the third correction factor. However, it is yet not sure where these dependences come from. Alternative explana-tion is that the bias arised from progenitor age. This scenario may have a role because young progenitor comes from massive star, or the density structure of WD changes with time (ref). To summarize, supernova cosmology is restricted by several uncertainties. The largest one is calibration, but the situation will be better in the future. Other systematics of concern are reddening, intrinsic dispersion in rest-frame U-band, host bias and progenitor. This thesis is related to the progenitor issue, which is still unclear and can be investigated by statistical studies. In the next section, the current constraints on progenitor are introduced.
2.3
Progenitors problems of Type Ia Supernova
In spite of its importance of SNe Ia, their progenitors are yet to be conclusively identi-fied. Various approaches to constrain the progenitor systems have been examined so far (see Maoz et al. 2013 for a review). The observational results are not yet conclusive, but recent studies appears to show that DD models may explain most of, if not all, SNe Ia. Generally speaking, SD models are expected to leave evidences for the surviving companion and cir-cumstellar materials around the system, which cannot be seen in most of observations. In the other hand, DD models will pass these constraints. SN 20011fe, the nearest normal SN Ia event in 25 years occured at M101 (6.4 Mpc), was one of the best case to test the progeni-tor because it was discovered very early and extremely well studied. Some other individual events are shedding lights on progenitor questions. Other approaches are based on statisti-cal studies, i.e. the occurence rates of SN Ia. Among them, the distribution of the delayt time (DTD) is a promissing way to test the detailed progenitor components. In this section, some major discussions around progenitor problem are introduced, and the rate studies are separately described in section1.3.
2.3.1 Surviving companion
In a SD scenario, the secondary star (donar) will survive the explosion of the primary WD, identifiable by its anomalous features such as velocity, rotation, and temperature (e.g. Marietta et al. 2000,Pan et al. 2013). Thus, if these survivor are detected, it will be a
smok-ing gun of SD progenitors. Various remnants were investigated, however, no clear evidence
of survivor is reported.