1 Title Page
Characteristics of emission from laser-induced plasma of metallic compounds in gaseous condition: the effects of gas pressure and laser pulse energy
Zhen Zhen Wang1, 3, Yoshihiro Deguchi3,*, Ren Wei Liu2, 3, Jun Jie Yan1, Ji Ping Liu2
1State Key Laboratory of Multiphase Flow in Power Engineering, Xi’an Jiaotong University, Xi’an 710049, China
2Moe Key Laboratory of Thermo-Fluid Science and Engineering, Xi’an Jiaotong University, Xi'an 710049, China
3Graduate School of Advanced Technology and Science, Tokushima University, Tokushima 770-8501, Japan
Corresponding author: Yoshihiro Deguchi
Graduate School of Advanced Technology and Science, Tokushima University
TEL: (+81)-88-656-7375
FAX: (+81)-88-656-9082
Email address:[email protected]
Postal address: 2-1, Minamijyosanjima, Tokushima 770-8506 Japan
This is an Accepted Manuscript of an article published by Taylor & Francis in Spectroscopy Letters on 11/04/2016, available online: http://www.tandfonline.com/10.1080/00387010.2016.1173064.
2 Abstract
Low pressure laser-induced breakdown spectroscopy was employed to measure mercury, strontium, and cesium under different conditions. Mercury was measured in detail to discuss the effects of pressure, laser pulse energy, delay time, and buffer gas. The continuum emission from plasma reduced dramatically to enhance signal to background ratio due to the change of influence of electron impact ionization process when reducing pressure and decreasing laser pulse energy to some extent. The comparison of mercuric chloride and mercury, as well as strontium and cesium measurements, demonstrates the enhancement of detection ability for trace species measurement using low pressure laser-induced breakdown spectroscopy.
Keywords: Trace species; Laser-induced breakdown spectroscopy; Low pressure; Plasma generation process
3 1. Introduction
Various contaminations releasing from industry, traffic, domestic waste and so on, pollute the soil, water, and atmosphere, resulting in the serious influences on the environment and human health. For example, the thermal power plant is of the most important electric power supply. However, one of the problems in the coal power plants is atmospheric pollutant emission, such as sulfur dioxide (SO2), nitrogen oxide (NOx), mercury (Hg) and its compounds, etc. Nuclear power, as a proven means to supply the growing demand of clean energy in energy future, is obviously depending on the basis of safe and rational utilization. Radioactive substances in nuclear power plant, such as iodine (I), strontium (Sr), cesium (Cs), uranium (U), plutonium (Pu) and so on containing in nuclear fuel itself, fission products, and activation products, should be paid much more attention. As is well known, in Japan after the Fukushima nuclear power plant accident, there are several serious pollutions for environment and human not only in the surrounding area of the nuclear power plant but also in the outlying regions [1]. Therefore, the detection of the heavy metals, radioactive elements and other species existing in complex substances is imperative.
Several researches about the measurement of trace species have been studied, such as Hg, Cs, lead (Pb) and cadmium (Cd) in different fields of soil, water and air using spectrometric, electrochemical methods and other conventional techniques [2-7]. Due to the low concentration of these species, it is essential to enrich and separate the samples for analyses, which usually take long time. In some applications, the satisfactory results cannot be obtained using these methods due to the restriction of detection limit. Laser diagnostics including laser-induced breakdown spectroscopy (LIBS), laser-induced fluorescence (LIF), time-of-flight mass spectrometry (TOFMS), etc. have been employed to measure the trace species with the features of fast
4
response, real-time and non-contact [8-10]. LIBS, an analytical detection technique based on atomic emission spectroscopy to measure elemental compositions, has been applied in various fields, including combustion [11-17], industry [18-21] and human [22,23], and others [24-26], especially in the harsh environment. LIBS has the capability to be used as a continuous-emission monitor for toxic metals, such as Hg, Cd, Pb, beryllium (Be) and chromium (Cr) with the improvement of sampling methodology and signal processing [27,28].
The utilization of LIBS technique has been extensively studied in different phase conditions, i.e. solid, liquid, and gas materials [29-31], which shows different laser-induced plasma processes. The wide pressure dependence and various atmospheric compositions have been studied to understand the LIBS phenomena [31]. The enhancement of detection limit is one challenge for gas phase materials using LIBS. The experiments have been mainly applied to directly observe the post-breakdown processes. However, a new method to change the influence of LIBS plasma generation process is necessary to enhance the detection limit. The method of low pressure laser-induced plasma was studied using nanosecond and picosecond lasers [32]. The stable and longer plasma was induced under reduced pressure conditions. The detection limit was enhanced using low pressure and short pulse width breakdown. The laser-induced plasma process was also discussed in Hg and iodine measurements using laser breakdown time-of-flight mass spectrometry (LB-TOFMS) [33]. According to these studies, there are several interferences with target signal in LIBS process, including continuum emission from plasma, coexisting molecular and atomic emissions, noise of detectors, etc. At high pressure around 100 kPa, the main interference is the continuum emission from plasma produced by the bremsstrahlung process. Its intensity depends on several factors such as electron number density, electron temperature, and so on. At low pressure around a few kPa, the coexisting molecular and atomic emissions become
5
the main interference that appear from the products of plasma generation process, which depend on the measurement materials.
The influence of continuum emission from plasma decreases dramatically at low pressure. In this study, Hg, Sr and Cs were measured using low pressure LIBS to demonstrate its detection characteristics for trace species measurement. Effects of pressure, laser pulse energy, delay time, buffer gas, and chemical forms of target atoms were also discussed to show the features of emission from laser-induced plasma of metallic compounds in gaseous condition in this study.
2. Experimental apparatus
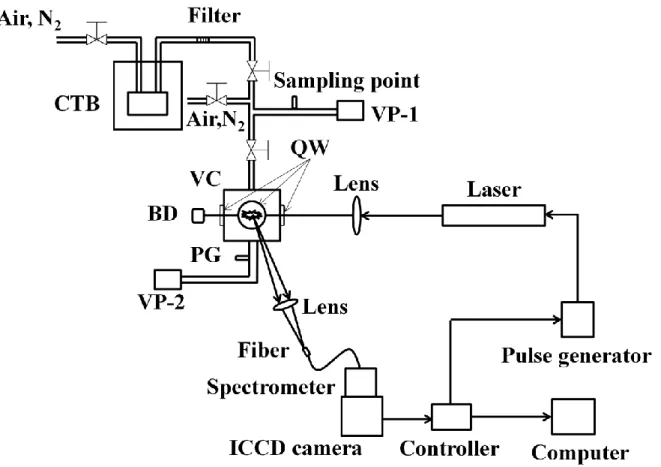
The schematic diagram of LIBS experimental apparatus employed in this study is shown in Fig. 1, fundamentally consisting of laser, lenses, detectors, measurement chamber, etc. The nanosecond laser (Quanta-Ray, Santa Clara, US; Pro-230, 6-12 ns, 10 Hz, beam diameter: 9 mm) was operated at 1064 nm. The output laser beam was focused into the chamber using the focal lens with 80 mm focal length. The measurement chamber was a vacuum cell with top input and bottom output, four quartz windows around the chamber. The internal volume of this chamber was about 200 cm3. The plasma emission was focused onto the optical fiber through another window of the chamber, which was perpendicular to the laser beam direction. The focal length of focal lens between the chamber and fiber was 60 mm. Emission signals were detected by the combination of a spectrometer (JASCO, Tokyo, Japan; CT-10S), an Intensified Charge Coupled Device (ICCD camera) (Princeton Instruments Inc. , New Jersey, US; Model ITEA/CCD-576-S/RB-E), and auxiliary equipment. F-number of the spectrometer was 2.8 in this study. The gratings of spectrometer employed consisted of 900 l/nm, 1500 l/nm, 1800 l/nm and 3600 l/nm according to various measured species with the resolutions of 0.207 nm/pixel, 0.12 nm/pixel,
6
0.104 nm/pixel and 0.047 nm/pixel, respectively. The gate width in this study was set to 30 μs for different trace species measurements.
The trace species generally forming the molecules with other elements coexist in various mixtures, such as the exhaust in industries. In this study, several samples employed consisted of Hg, mercuric chloride (HgCl2) (Kojundo Chemical Laboratory Co., Saitama, Japan; HgCl2), Decamethylstrontocene (Sr[C5(CH3)5]2) (Kojundo Chemical Laboratory Co. Sr(C5Me5)2), and 2,2,6,6-tetramethyl-3,5-heptanedionato cesium (Cs(C11H19O2)) (Kojundo Chemical Laboratory Co. Cs dpm). Hg sample was present in liquid form. The samples of HgCl2, Sr[C5(CH3)5]2, Cs(C11H19O2) employed were granular in ambient temperature and pressure condition. The aim of this study is to detect the emission characteristics from laser-induced gas plasma. The containers of different samples were placed in a constant-temperature bath. The gaseous mixtures of Hg, HgCl2, Sr[C5(CH3)5]2, Cs(C11H19O2) with buffer gases of air or nitrogen molecule (N2) were fed into the measurement chamber from the constant-temperature bath according to its vaporizing pressure(VP). The temperatures of Hg, HgCl2, Sr[C5(CH3)5]2 and Cs(C11H19O2) in the constant-temperature bath were 370 K(VP: 30 Pa), 370 K(VP: 10 Pa), 420 K(VP: 2.2 Pa) and 470 K respectively. A metallic filter was installed after the constant temperature bath to maintain the gaseous input of samples. The concentration of each sample was controlled by changing the flowrate of dilution air or N2. In order to maintain the uniform concentration of the measured species, that is, the measurement system at the same temperature, the pipes and the measurement chamber were also heated using the heaters. As a comparison between LIBS measurement and conventional method, mercury concentration was determined using the mercury gas detector tube (Komyo Rikagaku Kogyo K.K., Kanagawa, Japan; No.
7
142S), which can detect the atomic gas Hg concentration, by sampling from the gas outlet, as shown in Fig. 1.
3. Results and Discussion
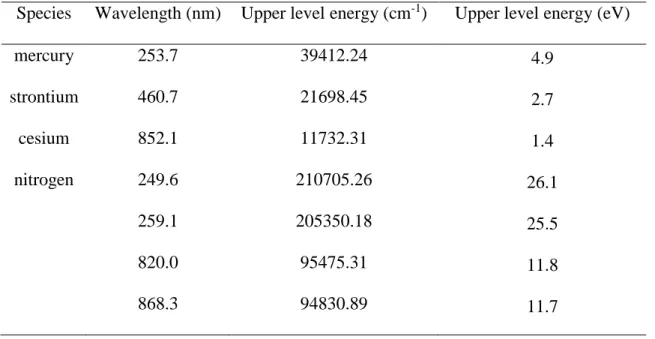
Hg, HgCl2, Sr[C5(CH3)5]2, and Cs(C11H19O2) were measured under different conditions, such as pressure, delay time, laser pulse energy and buffer gas. Table 1 lists the wavelength and upper-level energy of each element measured in this study. In order to determine the effects of pressure, laser pulse energy and buffer gas, atomic Hg was measured under different conditions to discuss the plasma generation process and emission characteristics. Low pressure laser-induced plasma of atomic Hg and molecular HgCl2 was compared. The plasma generation process and emission characteristics were also evaluated using LIBS signals of Sr and Cs under high pressure and reduced pressure conditions to demonstrate its feasibility of low pressure LIBS for trace species detection.
3.1 Plasma generation process under different conditions
3.1.1 Pressure effect on the emission signals
The atomic Hg in the buffer gas of N2 was measured under different conditions. Fig.2(a) shows Hg spectra at high pressure of 40 kPa. When reducing the pressure at 6.6 kPa, the measurement result of Hg spectra is shown in Fig.2(b). Hg signal under low pressure condition is quite clear without any interference. At high pressure, the intensity of continuum emission was very strong compared with that at low pressure. During laser-induced gas plasma there are two major processes including multi-photon ionization and electron impact ionization. The multi-photon ionization is a dominant ionization mechanism for Hg according to the results of Hg measurement using LB-TOFMS [33]. When the plasma is produced at high pressure, the electron
8
impact ionization becomes the dominant process for the plasma generation. The violent collision among the different particles, such as electron, ion and neutral, increases the influence of continuum emission related to the plasma temperature. The influence of electron impact ionization process following the multi-photon ionization process was changed by reducing the pressure in the plasma generation process, which is called cold plasma due to the reduced temperature of plasma. The influence of continuum emission decreases dramatically.
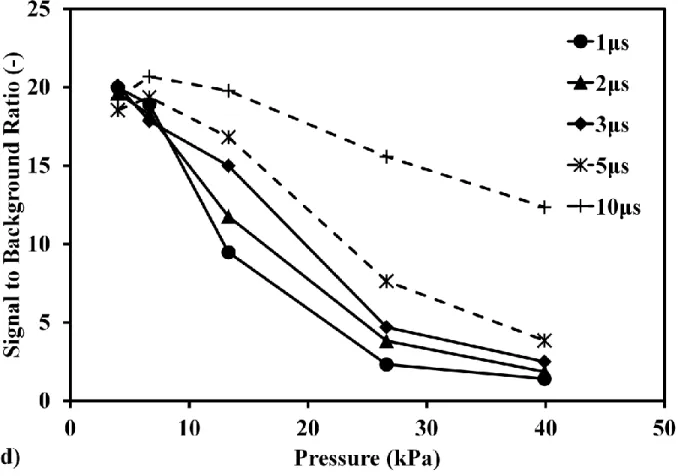
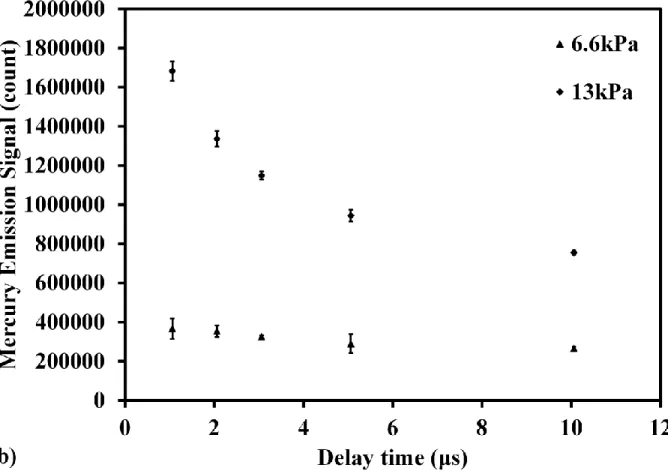
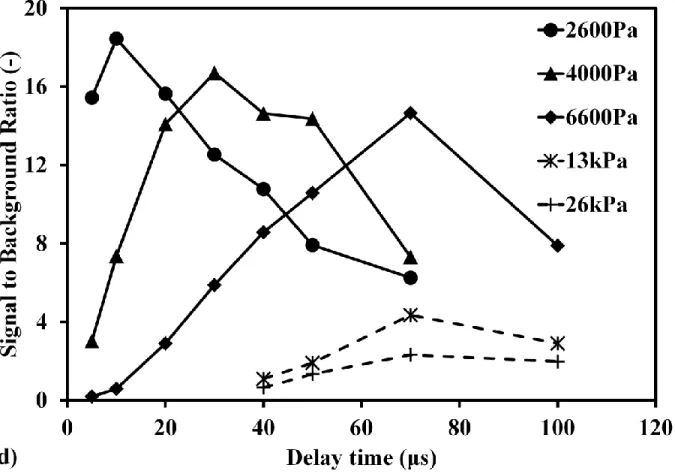
In order to evaluate the detection ability using low pressure LIBS, the influence of continuum emission around Hg signal at 253.7 nm was considered as the background to discuss the signal to background ratio, as Fig.2(a) shows. Fig.2(c) shows the pressure dependence of Hg signal intensity in different delay time. The error bar was denoted using the standard deviation of three times measurements for the stability of signal under low pressure condition. When the pressure increased, the intensities of Hg signal and background both increased. On the other hand, with the increase of delay time, Hg signal and background intensities decreased. Hg signal intensity became saturated at high pressure under the current experimental conditions. In order to evaluate the detection ability, the pressure dependence of Hg signal to background ratio in different delay time was illustrated in Fig.2(d). When increasing the pressure, the signal to background ratio decreased obviously. Because the increase rates of background intensity depending on pressure were larger than that of Hg signal. The signal to background ratio increased when increasing the delay time at the same pressure. In Fig.2(d), it can be seen that the signal to background ratio becomes independent on the delay time under lower pressure condition, such as 4 kPa, due to the very low background intensity. These results suggest that the LIBS detection ability can be improved by reducing the pressure.
9
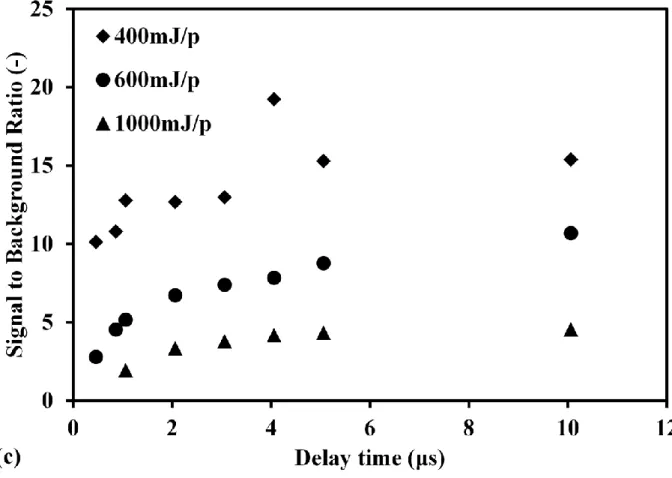
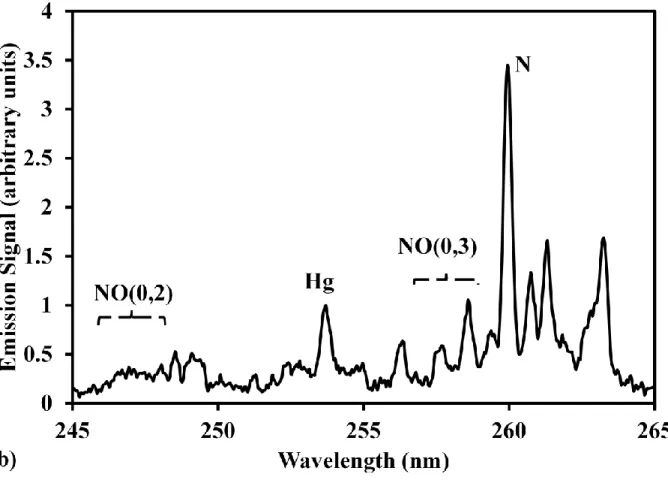
The plasma generation process is affected when reducing the pressure. Another influencing factor for signal to background ratio is the laser pulse energy. Fig.3(a) and Fig.3(b) show the measurement results of atomic Hg with low Hg concentration using different laser pulse energy at pressure of 2.6 kPa. In the high laser pulse energy of 1000 mJ/p, there are several obvious signal lines except for Hg signal at 253.7 nm. In these measurements, N2 was employed as the buffer gas. The upper-level energies of nitrogen (N) emissions are usually higher than that of Hg, as listed in Table 1. When the laser pulse energy was high, N2 was dissociated efficiently and several N lines and continuum emissions can be detected. Fig.3(b) also shows the increasing influence of continuum emission from plasma compared with Fig.3(a) using low laser pulse energy. Under the same condition, the laser operated in high pulse energy induced the plasma containing much more particles, such as the electrons and ions, resulting in the violent collision of different particles in the plasma compared with that using low laser pulse energy. Fig.3(c) shows the delay time dependence of signal to background ratio at pressure of 2.6 kPa using different laser pulse energy. In each laser pulse energy, the increasing delay time led to the increase of Hg signal to background ratio. When increasing the laser pulse energy, the signal to background ratio decreased in each delay time. Hg can be ionized efficiently by the multi-photon ionization process [33] and the early stage of electron impact ionization process. Subsequently, the background signals increased much faster than that of Hg signal when the laser pulse energy increased due to the influence of electron impact ionization. Therefore, the signal to background ratio decreased with the increase of laser pulse energy. However, the laser pulse energy cannot decrease unlimitedly because of the breakdown threshold of laser-induced plasma. The appropriate laser pulse energy for different species can be determined considering various factors, such as pressure.
10 3.1.3 Buffer gas effect on the plasma process
Hg was measured in buffer gas of N2 to discuss the plasma generation process under different conditions. The buffer gas effect on the laser-induced plasma process was also clarified here. N2 and air were employed as the buffer gas in the case of atomic Hg measurement. Fig.4(a) and Fig.4(b) show Hg spectra in N2 and air at low pressure of 2.6 kPa. Hg signal intensity was rather high compared with continuum emission and emission from coexisting N2. Hg signal in Fig.4(a) is very clear without any influence of continuum emission and coexisting N2 effect. Employing air as the buffer gas, several signal lines, such as N and NO emissions, can be detected, which were the influence on Hg signal, as shown in Fig.4(b). The NO emissions were formed during the plasma generation and cooling process of N2 and O2 in air [15,32]. The intensity of Hg signal became weak due to the presence of O2. Therefore the signal to background ratio reduced rapidly compared with that in the buffer gas of N2. Hg emission at 253.7 nm is selectively quenched by oxygen species, such as O2 and NO, formed by atoms recombination during the plasma decay process. A systematic study of Hg emission in laser-induced plasma and the interactions of Hg with oxygen species has been studied [34].
The gaseous mixture of Hg in buffer gas with different Hg concentration was measured using low pressure LIBS. The concentration dependence of Hg signal intensity shows the linear growth [15]. Therefore, Hg detection limit of 600 shots (1 minute) was estimated in the buffer gas of N2 and it was calculated by evaluating the ratio of the slope of Hg calibration curve (m) to background noise (standard deviation: σ) around 253.7 nm. The detection limit of nanosecond breakdown was 3.5 ppb (3σ/m) at 6.6 kPa [35]. Low pressure laser-induced plasma process was also employed to measure Hg in the buffer gas of air under various conditions, which is shown in elsewhere [15,32]. The detection limit of nanosecond breakdown was 450 ppb (3σ/m) at 0.7 kPa.
11
The signal to background ratio became worse in air due to the quenching of Hg signal in O2 and the background was also affected by the coexisting molecular and atomic emissions.
3.2 Low pressure plasma of mercury and mercuric chloride
The detection ability of trace species has been improved using low pressure LIBS. The applicability of this method was also evaluated by the comparison of atomic Hg and molecular HgCl2 measurements. HgCl2 has been measured under different conditions including pressure, delay time, laser pulse energy and buffer gas. Fig.5 shows the comparison of delay time dependence of Hg signal intensity at different pressure between Hg and HgCl2 measurements. The absolute mercury signal intensity was different between Hg and HgCl2 measurements under the same condition due to the different concentration of measured species. When increasing the pressure, Hg signal intensity increased in both cases. However, the increasing rate of Hg signal intensity was different due to the different breakdown features of atom and molecule. The collision at higher pressure can produce more electrons and ions, which led to the increase of Hg signal intensity especially for molecular HgCl2. Delay time dependence of Hg signal intensity in different laser pulse energy also demonstrated the consistent results between Hg and HgCl2 measurements. The increase of laser pulse energy illustrated the same characteristic as the increase of pressure, which also shows the different breakdown features of Hg and HgCl2. The signal intensity from HgCl2 showed heavier pressure and laser pulse energy dependences than that of Hg due to its molecular breakdown process. HgCl2 was also measured in the buffer gases of N2 and air under the same condition. Hg signal was very clear without the influence of continuum emission and the coexisting materials in N2. Conversely, when employing air as the buffer gas, Hg signal submerged in the background because of the quenching of Hg signal in O2. It is consistent with atomic Hg measurement results in Fig.4.
12 3.3 Low pressure plasma of strontium and cesium
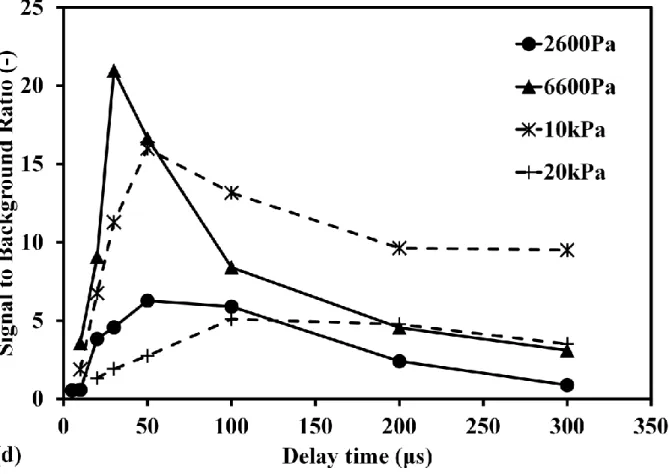
Sr[C5(CH3)5]2 and Cs(C11H19O2) were also measured using this method to discuss the detection features of Sr and Cs. Laser pulse energy was set to 1000 mJ/p for these complex molecules. Fig.6(a) and Fig.6(b) show Sr spectra at high pressure of 26 kPa and low pressure of 2.6 kPa, respectively. Sr signal submerged in the background under high pressure condition. When reducing the pressure, the clear Sr signal can be distinguished, as shown in Fig.6(b). Fig.6(c) shows the pressure dependence of Sr signal to background ratio in different delay time. The background was evaluated around Sr signal at 460.7 nm. When the pressure is high, it is difficult to distinguish Sr signal, especially in short delay time. Long delay time can be applied at high pressure. Therefore, the signals were measured in long delay time over 40 μs in the high pressure range more than 10 kPa. The delay time dependence of Sr signal to background ratio at different pressure is shown in Fig.6(d). The signal to background ratio increased first and then decreased at different pressure. In the low pressure range less than 10 kPa, the signal to background ratio was much better than that at high pressure. According to these results, the maximum signal to background ratio alters at each pressure. This phenomenon attributes to the different plasma generation process at various pressure and Sr emission lifetime (Sr upper-level energy). In the same delay time, an increase in pressure led to the increase of influence of continuum emission on Sr signal.
The measurement results of Cs at high pressure of 20 kPa and low pressure of 6.6 kPa are shown in Fig.7(a) and Fig.7(b), which is consistent with the measurement results of Hg and Sr. Fig.7(c) shows the pressure dependence of Cs signal to background ratio in different delay time. The background was evaluated around Cs signal at 852.1 nm. In high pressure range more than 6 kPa, the signal to background ratio decreases when increasing the pressure. Fig.7(d) shows the delay
13
time dependence of Cs signal to background ratio at different pressure. The signal to background ratio increases and then decreases when increasing the delay time. When the pressure is very low, such as 2.6 kPa, the signal to background ratio also becomes worse. The delay time dependences of signal to background ratio of Hg, Sr and Cs were not completely consistent, especially under lower pressure conditions. This phenomenon occurred because of the different upper-level energy. Therefore, the detection ability can be enhanced using low pressure laser-induced plasma and there is the optimal pressure according to each target atom.
According to the measurement results of Hg, Sr and Cs, the signal to background ratio increased under reduced pressure conditions. At high pressure, the delay time can be longer to increase the signal to background ratio. The optimal pressure and delay time for different atoms related to the upper-level energy, as listed in Table 1. When the upper-level energy was lower, such as Cs, this pressure was higher compared with that of Hg with higher upper-level energy. The atoms and molecules were easier to be excited, which transferred from upper-level energy to low-level energy. The optimal pressure for lower upper-level energy, therefore, increased concerning the signal intensity and signal to background ratio. The optimal pressure for Cs measurement was 6.6 kPa in delay time of 30 μs, as shown in Fig.7(d). In the case of Sr measurement, this pressure was 2.6 kPa in delay time of 10 μs, as shown in Fig.6(d). As for Hg measurement under the current conditions in this study, the pressure was the lower the better in different delay time. The main reason for this phenomenon is the different upper-level energy of each measured atom. Therefore, Cs signal at 852.1 nm with the lowest upper-level energy can be detected at higher pressure and in the longer delay time compared with that of Hg and Sr measurements. When the delay time became longer, the background intensity decreased much faster than that of Cs
14
emission, which led to the increase of Cs signal to background ratio in the delay time around 30 μs.
4. Conclusion
Hg, Sr and Cs have been measured using low pressure laser-induced breakdown spectroscopy (LIBS) under different conditions including pressure, delay time, laser pulse energy and buffer gas. According to the measurement results of atomic Hg in buffer gas of N2, the influence of continuum emission from plasma decreased dramatically under reducing pressure condition, which led to the increase of signal to background ratio. The signal to background ratio increased when the laser operated at low pulse energy, such as 400 mJ/p. The influence of electron impact ionization process can also be changed by decreasing the laser pulse energy to some extent. The buffer gas effect has been analyzed according to Hg measurement in N2 and air. Hg detection limit of 600 shots (1 minute) was 3.5 ppb (3σ/m) at 6.6 kPa using nanosecond breakdown, which was more than 100 times better than that in air due to the quenching of Hg signal in O2.
The dependence on chemical forms of target atoms was evaluated by the comparison of atomic Hg and molecular HgCl2 measurements under various conditions of delay time, pressure, laser pulse energy and buffer gas, which shows the consistent tendency between Hg and HgCl2. Sr and Cs were also measured using low pressure LIBS, which demonstrated the results of Hg measurement and the detection ability of low pressure LIBS for trace species measurement. The optimal pressure and delay time depends on each atom and it is mainly characterized by its upper-level energy.
15 Acknowledgments
This work was supported by National Natural Science Foundation of China (No. 51506171, 51436006), the National Key Basic Research Development Plan (No. 2015CB251504) and Postdoctoral Science Foundation of China (No. 2015M582655).
16 References
[1] Sato, I.; Kudo, H.; Tsuda, S. Removal efficiency of water purifier and adsorbent for iodine, cesium, strontium, barium and zirconium in drinking water. The Journal of
Toxicological Sciences 2011, 36(6), 859-834.
[2] Landis, M.S.; Stevens, R.K.; Schaedlich, F.; Prestbo, E.M. Development and characterization of an annular denuder methodology for the measurement of divalent inorganic reactive gaseous mercury in ambient air. Environmental Science and
Technology 2002, 36(13), 3000-3009.
[3] Lee, S.J.; Seo, Y.C.; Jang, H.N.; Park, K.S.; Baek, J.I.; An, H.S.; Song, K.C. Speciation and mass distribution of mercury in a bituminous coal-fired power plant. Atmospheric
Environment 2006, 40, 2215-2224.
[4] Wolterbeek, B. Biomonitoring of trace element air pollution: principles, possibilities and perspectives. Environmental Pollution 2002, 120, 11-21.
[5] Imperato, M.; Adamo, P.; Naimo, D.; Arienzo, M.; Stanzione, D.; Violante, P. Spatial distribution of heavy metals in urban soils of Naples city (Italy). Environmental Pollution
2003, 124, 247-256.
[6] Ömer, D.; Ahmet, D.; Ahmet, B. Determination of heavy metals (Cd, Pb) and trace elements (Cu, Zn) in sediments and fish of the Southeastern Aegean Sea (Turkey) by atomic absorption spectrometry. Food Chemistry 2006, 95, 157-162.
[7] Takahashia, J.; Tamurab, K.; Sudac, T.; Matsumurac, R.; Onda, Y. Vertical distribution and temporal changes of 137Cs in soil profiles under various land uses after the Fukushima Dai-ichi Nuclear Power Plant accident. Journal of Environmental
17
[8] Y. Deguchi, Industrial Applications of Laser Diagnostics. CRS Press, Taylor & Francis, New York, 2011.
[9] M. Bente, M. Sklorz, T. Streibel, R. Zimmermann, Thermal desorption-multiphoton ionization time-of-flight mass spectrometry of individual aerosol particles: a simplified approach for online single-particle analysis of polycyclic aromatic hydrocarbons and their derivatives, Analytical Chemistry 2009, 81(7), 2525-2536.
[10] Deguchi, Y.; Tanaka, N.; Tsuzaki, M.; Fushimi, A.; Kobayashi, S.; Tanabe, K. Detection of components in nanoparticles by resonant ionization and laser breakdown time-of-flight mass spectrometry, Environmental Chemistry 2008, 5, 402-412.
[11] Noda, M.; Deguchi, Y.; Iwasaki, S.; Yoshikawa, N. Detection of carbon content in a high-temperature and high-pressure environment using laser-induced breakdown spectroscopy. Spectrochimica Acta Part B 2002, 57, 701-709.
[12] Kurihara, M.; Ikeda, K.; Izawa, Y.; Deguchi, Y.; Tarui, H. Optimal boiler control through real-time monitoring of unburned carbon in fly ash by laser-induced breakdown spectroscopy. Applied Optics 2003, 42(30), 6159-6165.
[13] Ctvrtnickova, T.; Mateo, M.P.; Yañez, A.; Nicolas, G. Laser induced breakdown spectroscopy application for ash characterisation for a coal fired power plant.
Spectrochimica Acta Part B 2010, 65, 734-737.
[14] Wang, Z.Z.; Deguchi, Y.; Kuwahara, M.; Taira, T.; Zhang, X.B.; Yan, J.J.; Liu, J.P.; Watanabe, H.; Kurose, R. Quantitative elemental detection of size-segregated particles using laser-induced breakdown spectroscopy. Spectrochimica Acta Part B 2013, 87, 130-138.
18
[15] Wang, Z.Z.; Deguchi, Y.; Kuwahara, M.; Zhang, X.B.; Yan, J.J.; Liu, J.P. Sensitive measurement of trace mercury using low pressure laser-induced plasma. Japanese
Journal of Applied Physics 2013, 52, 11NC05-1-11NC05-6.
[16] Yuan, T.B.; Wang, Z.; Li, L.Z.; Hou, Z.Y.; Li, Z.; Ni, W.D. Quantitative carbon measurement in anthracite using laser-induced breakdown spectroscopy with binder.
Applied Optics 2012, 51(7), B22-B29.
[17] Yuan, T.B.; Wang, Z.; Lui, S.L.; Fu, Y.T.; Li, Z.; Liu, J.M.; Ni, W.D. Coal property analysis using laser-induced breakdown spectroscopy. Journal of Analytical Atomic Spectrometry 2013, 28, 1045-1053.
[18] Noll, R.; Mönch, I.; Klein, O.; Lamott, A. Concept and operating performance of inspection machines for industrial use based on laser-induced breakdown spectroscopy.
Spectrochimica Acta Part B 2005, 60, 1070-1075.
[19] Gaft, M.; Sapir-Sofer, I.; Modiano, H.; Stana, R. Laser induced breakdown spectroscopy for bulk minerals online analyses. Spectrochimica Acta Part B 2007, 62, 1496-1503. [20] Boué-Bigne, F. Laser-induced breakdown spectroscopy applications in the steel industry:
Rapid analysis of segregation and decarburization. Spectrochimica Acta Part B 2008, 63, 1122-1129.
[21] Laville, S.; Sabsabi, M.; Doucet, F.R. Multi-elemental analysis of solidified mineral melt samples by Laser-Induced Breakdown Spectroscopy coupled with a linear multivariate calibration. Spectrochimica Acta Part B 2007, 62, 1557-1566.
[22] Samek, O.; Beddows, D.C.S.; Telle, H.H.; Kaiser, J.; Liška, M.; Cáceres, J.O. Gonzáles Ureña, A. Quantitative laser-induced breakdown spectroscopy analysis of calcified tissue samples. Spectrochimica Acta Part B 2001, 56, 865-875.
19
[23] Thareja, R.K.; Sharma, A.K.; Shukla, S. Spectroscopic investigations of carious tooth decay. Medical Engineering and Physics 2008, 30, 1143-1148.
[24] St-Onge, L.; Kwong, E.; Sabsabi, M.; Vadas, E.B. Quantitative analysis of pharmaceutical products by laser-induced breakdown spectroscopy. Spectrochimica Acta Part B 2002, 57, 1131-1140.
[25] Juvé, V.; Portelli, R.; Boueri, M.; Baudelet, M. Yu, J. Space-resolved analysis of trace elements in fresh vegetables using ultraviolet nanosecond laser-induced breakdown spectroscopy. Spectrochimica Acta Part B 2008, 63, 1047-1053.
[26] Ma, Q.L.; Motto-Ros, V.; Lei, W.Q.; Boueri, M.; Zheng, L.J.; Zeng, H.P.; Bar-Matthews, M.; Ayalon, A.; Panczer, G.; Yu, J. Multi-elemental mapping of a speleothem using laser-induced breakdown spectroscopy. Spectrochimica Acta Part B 2010, 65,
707-714.
[27] Zhang, H.S.; Yueh, F.Y.; Singh, J.P. Laser-induced breakdown spectrometry as a multimetal continuous-emission monitor. Applied Optics 1999, 38(9), 1459-1466.
[28] Buckley, S.G.; Johnsen, H.A.; Hencken, K.R.; Hahn, D.W. Implementation of laser-induced breakdown spectroscopy as a continuous emissions monitor for toxic metals.
Waste Management 2000, 20, 455-462.
[29] Eland, K.L.; Stratis, D.N.; Lai, T.; Berg, M.A.; Goode, S.R.; Angel, S.M. Some comparisons of LIBS measurement using nanosecond and picosecond laser pulses.
Applied Spectroscopy 2001, 55(3), 279-285.
[30] Vander Wal, R.L.; Ticich, T.M.; West, J.R.; Householder, P.A. Trace metal detection by laser-induced breakdown spectroscopy. Applied Spectroscopy 1999, 53(10), 1226-1236.
20
[31] Effenberger, A.J.; Scott, J.R. Effect of Atmospheric Conditions on LIBS Spectra.
Sensors 2010, 10, 4907-4925.
[32] Wang, Z.Z.; Deguchi, Y.; Kuwahara, M.; Yan, J.J.; Liu, J.P. Enhancement of laser-induced breakdown spectroscopy(LIBS) detection limit by low pressure and short pulse laser-induced plasma process. Applied Spectroscopy 2013, 67(11), 1242-1251.
[33] Wang, Z.Z.; Deguchi, Y.; Yan, J.J.; Liu, J.P. Rapid detection of mercury and iodine using laser breakdown time-of-flight mass spectrometry. Spectroscopy Letters 2015, 48(2), 128-138.
[34] Gleason, R.L.; Hahn, D.W. The effects of oxygen on the detection of mercury using laser-induced breakdown spectroscopy. Spectrochimica Acta Part B 2001, 56, 419-430. [35] Wang, Z.Z.; Deguchi, Y.; Yan, J.J.; Liu, J.P. Comparison of detection characteristics of
trace species using laser-induced breakdown spectroscopy and laser breakdown time-of-flight mass spectrometry. Sensors 2015, 15(3), 5982-6008.
21
Table
Table 1 Wavelength and corresponding upper-level energy of measured elements used for laser-induced breakdown spectroscopy analysis
Element Wavelength (nm) Upper-level energy (cm-1) Upper-level energy (eV)
mercury 253.7 39412.24 4.9 strontium 460.7 21698.45 2.7 cesium 852.1 11732.31 1.4 nitrogen 249.6 210705.26 26.1 259.1 205350.18 25.5 820.0 95475.31 11.8 868.3 94830.89 11.7
22
Figure captions
Fig. 1 The schematic diagram of experimental apparatus for metallic compounds measurement in gaseous condition using laser-induced breakdown spectroscopy at low pressure. Conditions: laser with the pulse width of 6 nanosecond, samples of mercury, mercuric chloride, decamethylstrontocene and 2,2,6,6-tetramethyl-3,5-heptanedionato cesium in constant-temperature bath. (N2, nitrogen molecule; CTB, constant-temperature bath; VP, vacuum pump; VC, vacuum chamber; QW, quartz windows; BD, beam dump; PG, pressure gauge; ICCD, intensified charge coupled device.)
Fig. 2 Pressure effect on mercury signal in different delay time. (a) Mercury spectra at pressure of 40 kPa; (b) Mercury spectra at pressure of 6.6 kPa. Conditions: ns 1064 nm, delay time of 1 μs, laser pulse energy in 400 mJ/p, gate width of 30 μs. (c) Pressure dependence of mercury emission signal in different delay time. (d) Pressure dependence of averaged mercury signal to background ratio in different delay time. Conditions: ns 1064 nm breakdown, laser pulse energy in 400 mJ/p, gate width of 30 μs. Buffer gas of nitrogen molecule.
Fig. 3 Laser pulse energy effect on mercury signal at low pressure in different delay time. (a) Mercury spectra in 400 mJ/p; (b) Mercury spectra in 1000 mJ/p. Conditions: ns 1064 nm breakdown, delay time of 1 μs, pressure of 2.6 kPa, gate width of 30 μs. (c) Delay time dependence of averaged mercury signal to background ratio in different laser pulse energy. Conditions: ns 1064 nm breakdown, pressure of 2.6 kPa, gate width of 30 μs.
Fig. 4 Emission spectra of mercury in different buffer gases at low pressure. (a) Mercury in nitrogen molecule; (b) Mercury in air. Conditions: ns 1064 nm breakdown, pressure of 2.6 kPa, delay time of 0.4 μs, laser pulse energy in 600 mJ/p, gate width of 30 μs.
23
Fig. 5 Delay time dependence of mercury emission signal from mercury and mercuric chloride measurements at different pressure. (a) Mercury measurement result; (b) Mercuric chloride measurement result. Conditions: ns 1064 nm breakdown, laser pulse energy in 400 mJ/p, gate width of 30 μs. Buffer gas of nitrogen molecule.
Fig. 6 Pressure effect on strontium signal in different delay time. (a) Strontium spectra at pressure of 26 kPa; (b) Strontium spectra at pressure of 2.6 kPa. Conditions: ns 1064 nm breakdown, delay time of 20 μs, laser pulse energy in 1000 mJ/p, gate width of 30 μs. (c) Pressure dependence of averaged strontium signal to background ratio in different delay time. (d) Delay time dependence of averaged strontium signal to background ratio at different pressure. Conditions: ns 1064 nm breakdown, laser pulse energy in 1000 mJ/p, gate width of 30 μs. Buffer gas of nitrogen molecule.
Fig. 7 Pressure effect on cesium signal in different delay time. (a) Cesium spectra at pressure of 20 kPa; (b) Cesium spectra at pressure of 6.6 kPa. Conditions: ns 1064 nm breakdown, delay time of 30 μs, laser pulse energy in 1000 mJ/p, gate width of 30 μs. (c) Pressure dependence of averaged cesium signal to background ratio in different delay time. (d) Delay time dependence of averaged cesium signal to background ratio at different pressure. Conditions: ns 1064 nm breakdown, laser pulse energy in 1000 mJ/p, gate width of 30 μs. Buffer gas of nitrogen molecule.
24
Table 1 Wavelength and corresponding upper level energy of measured species
Species Wavelength (nm) Upper level energy (cm-1) Upper level energy (eV)
mercury 253.7 39412.24 4.9 strontium 460.7 21698.45 2.7 cesium 852.1 11732.31 1.4 nitrogen 249.6 210705.26 26.1 259.1 205350.18 25.5 820.0 95475.31 11.8 868.3 94830.89 11.7
25
Fig. 1 The schematic diagram of experimental apparatus for metallic compounds measurement in gaseous condition using laser-induced breakdown spectroscopy at low pressure. Conditions: laser with the pulse width of 6 nanosecond, samples of mercury, mercuric chloride, decamethylstrontocene and 2,2,6,6-tetramethyl-3,5-heptanedionato cesium in constant-temperature bath. (N2, nitrogen molecule; CTB, constant-temperature bath; VP, vacuum pump; VC, vacuum chamber; QW, quartz windows; BD, beam dump; PG, pressure gauge; ICCD, intensified charge coupled device.)
29
Fig. 2 Pressure effect on mercury signal in different delay time. (a) Mercury spectra at pressure of 40 kPa; (b) Mercury spectra at pressure of 6.6 kPa. Conditions: ns 1064 nm, delay time of 1 μs, laser pulse energy in 400 mJ/p, gate width of 30 μs. (c) Pressure dependence of mercury emission signal in different delay time. (d) Pressure dependence of averaged mercury signal to background ratio in different delay time. Conditions: ns 1064 nm breakdown, laser pulse energy in 400 mJ/p, gate width of 30 μs. Buffer gas of nitrogen molecule.
32
Fig. 3 Laser pulse energy effect on mercury signal at low pressure in different delay time. (a) Mercury spectra in 400 mJ/p; (b) Mercury spectra in 1000 mJ/p. Conditions: ns 1064 nm breakdown, delay time of 1 μs, pressure of 2.6 kPa, gate width of 30 μs. (c) Delay time dependence of averaged mercury signal to background ratio in different laser pulse energy. Conditions: ns 1064 nm breakdown, pressure of 2.6 kPa, gate width of 30 μs.
34
Fig. 4 Emission spectra of mercury in different buffer gases at low pressure. (a) Mercury in nitrogen molecule; (b) Mercury in air. Conditions: ns 1064 nm breakdown, pressure of 2.6 kPa, delay time of 0.4 μs, laser pulse energy in 600 mJ/p, gate width of 30 μs.
36
Fig. 5 Delay time dependence of mercury emission signal from mercury and mercuric chloride measurements at different pressure. (a) Mercury measurement result; (b) Mercuric chloride measurement result. Conditions: ns 1064 nm breakdown, laser pulse energy in 400 mJ/p, gate width of 30 μs. Buffer gas of nitrogen molecule.
40
Fig. 6 Pressure effect on strontium signal in different delay time. (a) Strontium spectra at pressure of 26 kPa; (b) Strontium spectra at pressure of 2.6 kPa. Conditions: ns 1064 nm breakdown, delay time of 20 μs, laser pulse energy in 1000 mJ/p, gate width of 30 μs. (c) Pressure dependence of averaged strontium signal to background ratio in different delay time. (d) Delay time dependence of averaged strontium signal to background ratio at different pressure. Conditions: ns 1064 nm breakdown, laser pulse energy in 1000 mJ/p, gate width of 30 μs. Buffer gas of nitrogen molecule.
44
Fig. 7 Pressure effect on cesium signal in different delay time. (a) Cesium spectra at pressure of 20 kPa; (b) Cesium spectra at pressure of 6.6 kPa. Conditions: ns 1064 nm breakdown, delay time of 30 μs, laser pulse energy in 1000 mJ/p, gate width of 30 μs. (c) Pressure dependence of averaged cesium signal to background ratio in different delay time. (d) Delay time dependence of averaged cesium signal to background ratio at different pressure. Conditions: ns 1064 nm breakdown, laser pulse energy in 1000 mJ/p, gate width of 30 μs. Buffer gas of nitrogen molecule.