Japan Advanced Institute of Science and Technology
JAIST Repository
https://dspace.jaist.ac.jp/Title
Structure and Raman scattering of Cs_3C_<60>
under high pressure
Author(s)
Fujiki, S.; Kubozono, Y.; Emura, S.; Takabayashi,
Y.; Kashino, S.; Fujiwara, A.; Ishii, K.;
Suematsu, H.; Murakami, Y.; Iwasa, Y.; Mitani,
T.; Ogata, H.
Citation
Physical Review B, 62(9): 5366-5369
Issue Date
2000-09-01
Type
Journal Article
Text version
publisher
URL
http://hdl.handle.net/10119/4601
Rights
S. Fujiki, Y. Kubozono, S. Emura, Y. Takabayashi,
S. Kashino, A. Fujiwara, K. Ishii, H. Suematsu,
Y. Murakami,Y. Iwasa, T. Mitani, and H. Ogata,
Physical Review B, 62(9), 2000, 5366-5369.
Copyright 2000 by the American Physical Society.
http://link.aps.org/abstract/PRB/v62/p5366
Structure and Raman scattering of Cs
3C
60under high pressure
S. Fujiki,1Y. Kubozono,1,*S. Emura,2Y. Takabayashi,1S. Kashino,1A. Fujiwara,3K. Ishii,3H. Suematsu,3 Y. Murakami,4Y. Iwasa,5 T. Mitani,5and H. Ogata6
1Department of Chemistry, Okayama University, Okayama 700-8530, Japan 2ISIR, Osaka University, Osaka 567-0047, Japan
3Department of Physics, University of Tokyo, Tokyo 113-0033, Japan 4KEK-PF, Tsukuba 305-0801, Japan
5Japan Advanced Institute of Science and Technology, Ishikawa 923-1292, Japan 6Institute for Molecular Science, Okazaki 444-8585, Japan
共Received 4 October 1999; revised manuscript received 24 January 2000兲
Raman scattering is studied for a pressure-induced superconductor Cs3C60in a pressure region from 1 bar to
62 kbar. The center frequency0for Hg(1) and Hg(2) Raman peaks increase by applying pressure, but the
increase shows a saturation in the high-pressure region. On the other hand, the0for Ag(1) and Ag(2) modes
increase monotonically in all pressure regions. The electron-phonon coupling constant for Cs3C60 shows a
rapid decrease up to 30 kbar and an increase above 30 kbar. This result may be associated with a transforma-tion from a multiphase共body-centered orthorhombic and A15 phases兲 to a single phase around 20 kbar. X-ray powder diffraction pattern at 11 K under a pressure of 40 kbar shows that a superconducting phase for Cs3C60
is body-centered orthorhombic.
In 1995, Palstra et al. found that Cs3C60 was a pressure-induced superconductor that exhibited at 14.3 kbar the high-est superconducting critical temperature (Tc⫽40 K) among
fullerene superconductors.1 According to their observation, the Tc appeared by applying pressure and increased with an increase in pressure. This increase in Tc is contrary to the
model that a band broadening by applying pressure reduces the density-of-state on the Fermi level, N(F), and Tc as expected from the BCS theory. One of the explanations for the increase is that the shielding currents are suppressed by a disorder such as fine grain and the two-phase nature of body-centered tetragonal共bct兲 and A15 at 1 bar.1Such a disorder may reduce Tcby a fluctuation in the phase of the
supercon-ducting order parameter ⌿. If only one phase is realized under high pressure, applying pressure should lead to a de-crease in the fluctuation of⌿ and improve the superconduct-ing phase. The second explanation is that applysuperconduct-ing pressure can reduce the phase fluctuation of ⌿ and increase the Tc because pressing the grains should improve the connectivity of the material. The third explanation is based on the as-sumption that Cs3C60 is a Mott-Hubbard insulator. The su-perconducting transition cannot be expected for an insulating Cs3C60 because all known fullerene superconductors trans-form to a superconducting state from a metallic state. Apply-ing pressure may change an insulatApply-ing state to a metallic state, and further a superconducting state.
We studied the structure and physical properties of Cs3C60 at 1 bar by x-ray powder diffraction and ESR共electron spin resonance兲2 and found that Cs3C60 at 1 bar took two phases of body-centered orthorhombic 共bco; Immm, not bct兲 as the major phase and A15 as the minor phase from 10 to 300 K. It was recently found that Cs4C60also took a bco structure.
3 No metal-insulator transition was observed for Cs3C60 by ESR from 1.9 to 300 K at 1 bar,2suggesting that it is not the Mott–Hubbard insulator. The electron-phonon 共e-ph兲 cou-pling constant determined for Cs3C60from Raman scatter-ing at 1 bar was⬃0.18, which was approximately one third of Rb3C60and K3C60.4The for Cs3C60estimated from
Ra-man scattering at 1 bar does not lead to any meaningful Tcin
the BCS and McMillan theory, which is consistent with non-superconductivity at 1 bar. In the present paper, we studied the Raman scattering of Cs3C60from 1 bar to 62 kbar with an interest in the e-ph coupling under high pressure for a pressure-induced superconductor. Further, we studied the crystal structures of Cs3C60at 101 and 11 K under a pressure of 40 kbar, which corresponds to the normal and the super-conducting states, respectively.
The sample of Cs3C60was prepared by using liquid NH3 at low temperature according to the method reported in Ref. 1. After removing NH3 by pumping under 10⫺3Torr at 100 °C for 18 h and at 140 °C for 1 h, the sample was trans-ferred into a capillary 共outer diameter ⫽0.7 mm兲 and a diamond anvil cell in a glove box for Raman and x-ray dif-fraction measurements. X-ray difdif-fraction pattern at 298 K and 1 bar was measured with CuK␣ radiation 共wavelength: 1.5418 Å兲 by an x-ray diffractometer 共Rigaku Rint 1500兲. X-ray powder diffraction patterns were measured at 11 and 101 K under a pressure of 40 kbar with synchrotron radiation 共wavelength: 0.6896 Å兲 at BL-1B of the Photon Factory in the High Energy Accelerator Research Organization. The Ri-etveld analyses for x-ray diffraction patterns were achieved by using RIETAN 94 program.5 The Raman scattering was measured at 298 K with He-Ne laser excitation of 632.8 nm using a Confocal Raman Imaging LabRam system. The cen-ter frequency 0 the line width⌫, and the asymmetric pa-rameter q for the Raman peak, were determined by a least-squares fitting with the Breit-Wigner-Fano 共BWF兲 formula. The Hg(2) peaks were analyzed by the three-components
fitting, while the Hg(1), Ag(1), and Ag(2) peaks were
ana-lyzed by the single-component fitting. The multiple splittings of the Hg(2) mode have been observed in single crystals of
K3C60 and Rb3C60. 6
The splittings suggest a lowering of symmetry from Ih for the C60molecule, which is reasonable for the Cs3C60 crystal of Immm. The Hg(1) and Hg(2)
modes showed a large 1/q as observed previously,4 which reflects the BWF effect. The Ag(1) and Ag(2) peaks showed
PRB 62
a small 1/q, i.e., a Lorentzian line shape. The coupling be-tween the phonon and a low-energy continuum 共t1u-t1u* in-terband transition caused by a lowering in symmetry of the C60 molecule兲 is the origin of the BWF effect in the Hg
modes.7
The Ag(2) Raman peak was observed at0of 1447 cm⫺1 at 1 bar. The 0 value was consistent with those reported previously.1,2,4Further, the0for the Hg(1)共259 cm⫺1兲 and
Ag(1)共493 cm⫺1兲 modes were consistent with those reported
previously.4 The 0 for the Hg(4) peak was 756 cm⫺1,
which was close to that in K3C60.6 The x-ray diffraction pattern at 1 bar was also consistent with that reported previously,1,2,4 and the Rietveld analysis showed the occu-pancy of 0.75 for Cs atom. These results support that this sample is Cs3C60.
As a typical example of the Raman scattering in the present study, the Hg(1), Hg(2), Ag(1), and Ag(2) Raman
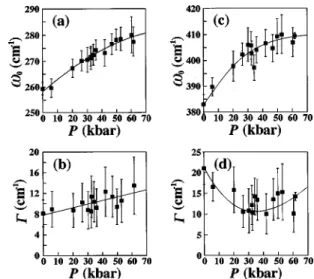
peaks observed at 6 and 47 kbar are shown in Figs. 1 and 2 along with the calculated Raman peaks, in order to show the quality of the Raman data and the validity of the analyses. The Raman data and the analyses in all pressure regions were sufficient to estimate the pressure dependence of the e-ph coupling in Cs3C60. The values of0 and⌫ for the Raman peaks at 1 bar, 6 kbar, and 47 kbar are collected in Table I. Figures 3共a兲 and 3共b兲 show the pressure dependence of the 0 and⌫ for the Hg(1) peak. The0 increases with an
increase in pressure. The rate of increase in 0 for applied pressure decreases gradually above 40 kbar. The pressure coefficient0/p is estimated to be 0.41 cm⫺1/kbar共⫽4.1 cm⫺1/GPa兲 for the 0 below 40 kbar. This value is larger than that for C60, 1.1 cm⫺1/GPa.
8
The⌫ for the Hg(1) mode
increases slightly with an increase in pressure.
The 0 of all peaks for the Hg(2) mode increase rapidly with an increase in pressure up to 30 kbar, while the 0 saturates above 30 kbar. The pressure dependence of the weighted average value of 0 is shown in Fig. 3共c兲. The pressure dependence is largely different from that in pristine C60, in which the Hg(2) mode shows the largest blueshift
(0/p⫽2.4 cm⫺1/GPa) among all modes and a monoto-nous increase below 60 kbar.8 The ⌫ of all peaks for the Hg(2) mode in Cs3C60 decrease rapidly with an increase in pressure from 1 bar to 30 kbar, and shows a slight increase above 30 kbar. The pressure dependence of the weighted average value of ⌫ is shown in Fig. 3共d兲. The weighted av-erage value of ⌫ also decreases rapidly up to 30 kbar and FIG. 1. Raman peaks for the Hg(1) mode at共a兲 6 and 共b兲 47
kbar, and those for the Hg(2) mode at共c兲 6 and 共d兲 47 kbar. The Hg(1) and Hg(2) modes were analyzed by a single BWF and three
BWF components, respectively. The crosses and solid lines refer to the experimental and the best-fitted peaks, respectively.
FIG. 2. Raman peaks for the Ag(1) mode at共a兲 6 and 共b兲 47
kbar, and those for the Ag(2) mode at共c兲 6 and 共d兲 47 kbar. Both
modes were analyzed by a single BWF component, respectively. The crosses and solid lines refer to the experimental and the best-fitted peaks, respectively.
TABLE I. Values of 0 共cm⫺1兲 and ⌫ 共cm⫺1兲 for the Raman modes at 1 bar, 6 kbar, and 47 kbar.
Mode P 0 ⌫ 0 ⌫ 0 ⌫ 具0典a 具⌫典a Hg(1) 1 bar 259 8 6 kbar 260 9 47 kbar 277 11 Hg(2) 1 bar 343 17 372 22 405 22 383 21 6 kbar 348 13 387 16 416 17 390 16 47 kbar 354 7 396 15 425 15 405 14 Ag(1) 1 bar 493 1 6 kbar 496 2 47 kbar 514 4 Ag(2) 1 bar 1447 5 6 kbar 1450 5 47 kbar 1468 6
a具0典 and 具⌫典 refer to the weighted average values of0 and ⌫, respectively.
FIG. 3. Pressure dependence of 共a兲 0 and 共b兲 ⌫ for Hg(1)
mode, and of the weighted average values of 共c兲0and 共d兲 ⌫ in three Raman components for the Hg(2) mode.
increases slightly above 30 kbar. The q values for the Hg(1)
and Hg(2) modes are almost constant in all pressure regions. As seen from Figs. 4共a兲 and 4共b兲, the 0 and ⌫ for the Ag(1) peak increases linearly with an increase in pressure.
The 0/p is estimated to be 0.42 cm⫺1/kbar 共⫽4.2 cm⫺1/GPa兲, which is extremely larger than that for C60 (0.94 cm⫺1/GPa).8The0 for the Ag(2) peak also in-creases linearly with an increase in pressure关Fig. 4共c兲兴. The
0/p of 0.40 cm⫺1/kbar共⫽4.0 cm⫺1/GPa兲 for the Ag(2)
peak is consistent with that for the Ag(1) mode, and is larger
than that for the Ag(2) mode in C60共1.7 cm⫺1/GPa兲.8The⌫ increases slightly with an increase in pressure 关Fig. 4共d兲兴. The q values for the Ag(1) and Ag(2) modes are
substan-tially constant in all pressure regions.
The mode–Gruneisen parameters ␥关⫽⫺(1/)(1/
0)(d0/d p)] for the Ag(1) and Ag(2) modes are
deter-mined from the pressure dependence of 0 and the com-pressibility 关⫽(1/V)(dV/dp)兴 to be 0.28 and 9.6 ⫻10⫺2, respectively; the is determined to be 3.1
⫻10⫺3kbar⫺1for Cs
3C60. 9
The␥for the Ag(2) mode is the
same order as that for C60 (6.4⫻10⫺2).10 The small ␥ for the Ag(1) and Ag(2) modes suggest that the bond lengths for
the C60molecule in Cs3C60are little affected by the contrac-tion of the crystal lattice under pressure.
The contribution of the Ag(1) and Ag(2) modes to the
in Cs3C60is extremely small at 1 bar in comparison with the Hg(1) and Hg(2) modes.
4
These modes cannot be expected to contribute to the even under high pressure. Therefore, the Ag(1) and Ag(2) modes will be affected only by an
increase in force constants of the C60 molecule caused by applying pressure. The intercalation of three Cs atoms into the C60lattice leads to a softening of the tangential intramo-lecular ⫺C60-Ag(2) mode by ⬃20 cm⫺1 because of a
de-crease in force constants of the C60 molecule caused by the transfer of three electrons to the antibonding LUMO orbital, i.e., charge-transfer elongation of C–C bonds.7,11,12 Con-versely, as seen from Fig. 4共c兲, applying pressure of 50 kbar to Cs3C60leads to a stiffening by 20 cm⫺1, whose variation is comparable to that caused by three-electrons transfer to a LUMO orbital in C60.
The for Cs3C60 can be estimated according to the equation,7,13–15
⫽⌺i⫽⌺C⌬⌫i/关01 2
N共F兲兴,
where i is the for the ith mode. C⫽di/, di being the
degeneracy of the ith mode共d⫽5 for the Hgmode, d⫽1 for
Ag mode兲. The ⌬⌫i is the difference between the ⌫i in
Cs3C60 and that in C60; the ⌫i at 1 bar is employed for
C60 in all pressure regions. The N(F) 共⫽9 state eV⫺1C60⫺1spin⫺1) 共Ref. 4兲 determined at 1 bar is used as the N(F) in all pressure regions. The for the Hg(1) and Hg(2) modes at 1 bar are estimated to be 0.08 and 0.15,
respectively, and the total⫽0.23, which is substantially in agreement with that reported previously.4 The pressure de-pendence of for the Hg(1) and Hg(2) modes are shown in
Figs. 5共a兲 and 5共b兲; the weighted average values of the 0 and ⌫ are used in estimating the from the Hg(2) mode.
The for the Hg(1) mode increases with an increase in pressure, while that for the Hg(2) decreases rapidly from
0.15 to 0.05 up to 30 kbar and increases slightly above 30 kbar. As shown in Fig. 5共c兲, the total decreases rapidly up to 30 kbar and increases above 30 kbar. This result may be associated with the phase transition from the multiphase共bco and A15兲 to the single phase 共bco兲 which is found by the pressure-dependent x-ray diffraction study.1,9 This suggests that a disappearance of disorder in the Cs3C60 crystal plays an important role for a superconductivity.
However, the total estimated from the Hg(1) and Hg(2) modes is smaller than that 共⬃0.65兲 expected from the Mc-Millan formula. We employed the N(F) at 1 bar in estimat-FIG. 4. Pressure dependence of共a兲0and共b兲 ⌫ for the Ag(1)
mode, and of共c兲0and共d兲 ⌫ for the Ag(2) mode.
FIG. 5. Pressure dependence of for 共a兲 Hg(1) and共b兲 Hg(2)
modes, and of共c兲 total . The for the Hg(2) mode was estimated
ing the. However, the N(F) value should decrease with an
increase in pressure according to the relation, N(F)⬃tinter⫺1 ⬃dinter
n
;14,15the parameters, tinter and dinter, refer to the in-teratomic hopping integral and the inin-teratomic distance, re-spectively, and the n is normally 2–3. The unit cell volume V at 30 and 60 kbar can be estimated from the pressure dependence of V for Cs3C609 to be ⬃1540 and ⬃1410 Å3, respectively. When 3 is adopted for the n in estimating N(F), the values of N(F) at 30 and 60 kbar are predicted
to be 90 and 85 % of that at 1 bar, respectively. When the reduction of N(F) is taken into account, the at 60 kbar
should increase from 0.25 to 0.3. The increase in is still smaller than that expected by the McMillan formula.
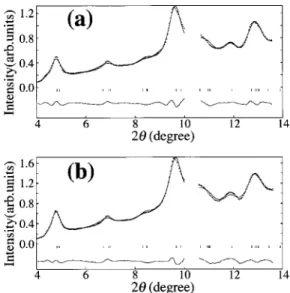
Figures 6共a兲 and 6共b兲 show the x-ray powder-diffraction patterns at 101 and 11 K, respectively, under a pressure of 40 kbar. Though the x-ray diffraction pattern measured at 1 bar and 295 K shows the existence of two phases of bco共95%兲 and A15 共5%兲, no A15 phase is observed for both x-ray diffraction patterns at 40 kbar shown in Figs. 6共a兲 and 6共b兲. These x-ray diffraction patterns can be indexed with a bco phase (Immm): Rw p⫽3.42% and Rp⫽2.76% at 101 K,
Rw p⫽3.23% and Rp⫽2.61% at 11 K. The lattice constants
a, b, and c at 11 K under a pressure of 40 kbar are deter-mined to be 11.8共1兲, 11.32共9兲, and 11.40共9兲 Å respectively; the V is 1520共23兲 Å3. The x-ray diffraction patterns suggest no structural phase transition between 11 and 101 K at 40 kbar, where the superconducting transition should occur. Therefore, it is concluded that the bco phase is the supercon-ducting phase for Cs3C60.
1H NMR spectrum of this sample was measured to iden-tify a stoichiometry of NH3 by a NMR 共nuclear magnetic resonance兲 spectrometer 共Bruker DSX400兲. The 1H NMR spectrum shows that the sample contains small amounts of NH3; the stoichiometry is Cs3C60共NH3兲0.1. The V deter-mined from the x-ray diffraction pattern at 1 bar and 295 K, 1654共4兲 Å3, is in agreement with those reported previously for Cs3C60 within the standard deviation: 1662 Å3 in Ref. 1 and 1659共2兲 Å3 in Ref. 2. These results suggest that the pressure-induced superconducting Cs3C60 reported in Ref. 1 contains small amounts of NH3. The existence of NH3 in these samples cannot be confirmed from the x-ray diffraction patterns because of extremely small amounts of NH3. The bco phase of Cs3C60may be stabilized by NH3occupying the vacancies at 4 f and 4h sites where Cs atoms occupy with the occupancy of 0.75.
In conclusion, the total estimated from the Hg(1) and Hg(2) modes also shows a rapid decrease up to 30 kbar and
an increase above 30 kbar. This result suggests that a disap-pearance of the disorder in Cs3C60crystal leads to an appear-ance of superconductivity. However, even under high pres-sure the total does not increase to the value 共0.65兲 expected for Cs3C60by the McMillan formula. The small may show the necessity of including other Hg modes and
intermolecu-lar vibrations in estimating the e-ph coupling in Cs3C60. The x-ray diffraction patterns at 40 kbar show that the supercon-ducting phase of Cs3C60is bco as in the case of the normal phase. Further, the 1H NMR study suggests that the super-conducting phase of Cs3C60contains small amounts of NH3. The origin of the pressure-induced superconductivity should further be studied.
The authors are grateful to Dr. Hiroshi Kitagawa of JAIST for his valuable suggestion in Raman measurements. The x-ray diffraction study at 40 kbar was performed under a Proposal of KEK-PF共97G201兲. This study was supported by a Grant-in-Aid 共11165227兲 from the Ministry of Education, Science, Sports and Culture, Japan.
*Corresponding author. Electronic address: [email protected]
1T. T. M. Palstra et al., Solid State Commun. 93, 327共1995兲. 2Y. Yoshida et al., Chem. Phys. Lett. 291, 31共1998兲. 3P. Dahlke et al., J. Mater. Chem. 8, 1571共1998兲. 4Y. Kubozono et al., Chem. Phys. Lett. 298, 335共1998兲. 5F. Izumi, in The Rietveld Method, edited by R. A. Young共Oxford
University, New York, 1993兲, p. 236.
6J. Winter and H. Kusmany, Phys. Rev. B 53, 655共1996兲. 7P. Zhou et al., Phys. Rev. B 48, 8412共1993兲.
8D. W. Snoke et al., Phys. Rev. B 45, 14 419共1992兲.
9Y. Kubozono et al., in Electronic Properties of Novel Materials–
Science and Technology of Molecular Nanostructures,
Proceed-ings of the XIII International Winterschool for Electronic Prop-erties of Novel Materials, Austria, 1999, edited by H. Kuzmany
et al., AIP Conf. Proc. No. 486共AIP, New York, 1999兲, p. 69.
10S. H. Tolbert et al., Chem. Phys. Lett. 188, 163共1992兲. 11S. J. Duclos et al., Science 254, 1625共1991兲.
12K.-A. Wang et al., Phys. Rev. B 45, 1955共1992兲. 13C. M. Varma et al., Science 254, 989共1991兲. 14M. Schluter et al., Phys. Rev. Lett. 68, 526共1992兲.
15K. Prassides et al., in Fullerene: Status and Perspectives, edited
by C. Taliani, G. Ruani, and R. Zamboni共World Scientific, Sin-gapore, 1992兲, p. 147.
FIG. 6. X-ray diffraction patterns at共a兲 101 and 共b兲 11 K under a pressure of 40 kbar. The crosses and solid lines refer to the ex-perimental and the best-fitted patterns, respectively. Ticks mark the positions of allowed Bragg reflections. The difference between the experimental and the best-fitted patterns is shown by the thin lines in the bottom of each figure.