Quantitative Analysis of Microstructure of Silicate Ceramics and its Relationship to Thermal Expansion Property
(珪酸塩セラミックスの微構造の定量解析及び熱膨張特性との関係)
2014
Masaki Katayama
Contents
Chapter 1 Introduction
1-1 Silicate ceramics ... 1
1-2 Cordierite ceramics ... 2
1-3 Purpose of this study ... 3
1-4 Course of this study ... 4
Chapter 2 Quantification of ceramic microstructures with digital images of photomicrograph 2-1 Introduction... 9
2-2 Experimental procedure ... 9
2-2-1 Quantification of domain structure of cordierite ceramics ... 9
2-2-2 Quantification of primary grains constituting mullite ceramics ... 10
2-3 Result and Discussion ... 10
2-3-1 Quantification of cordierite domain by digital image analysis ... 10
2-3-2 Applying digital image analysis for quantification of microstructure of mullite ceramics .. 15
2-4 Conclusions... 19
Chapter 3 Effect of Microstructure on the Thermal Expansion Coefficient of Sintered Cordierite Prepared from Sol Mixtures 3-1 Introduction... 21
3-2 Experimental Procedures ... 21
3-2-1 Preparation... 21
3-2-2 Characterization... 22
3-3 Results and Discussion ... 22
3-3-1 Thermal reaction and sintering of sol mixtures ... 22
3-3-2 Thermal expansion properties of dense ceramics ... 27
3-3-3 Microstructure of sintered cordierite ... 27
3-3-4 Quantification of average domain size and CTE modeling ... 32
3-4 Conclusions... 37
Chapter 4
Effect of Particle Size of Tabular Talc Powders on Crystal Orientation and Sintering of Cordierite Ceramics
4-1 Introduction... 39
4-2 Experimental procedure ... 40
4-2-1 Materials ... 40
4-2-2 Preparation... 41
4-2-3 Characterization... 41
4-3 Results and Discussions ... 42
4-3-1 Crystal orientation of talc powders ... 42
4-3-2 Effect of the particle orientation of talc powders on crystal orientation of cordierite ... 48
4-3-3 Effect of particle size of talc powders on densification of cordierite ceramics ... 52
4-3-4 Anisotropic CTE of sintered cordierite ceramics ... 52
4-4 Conclusions... 56
Chapter 5 Crystal orientation of cordierite generated at the interface between Al2O3·2SiO2 and 3MgO·4SiO2 5-1 Introduction... 57
5-2 Experimental procedures ... 57
5-2-1 Materials ... 57
5-2-2 Preparation... 58
5-2-3 Characterization... 59
5-3 Results and Discussions ... 59
5-3-1 Phase composition of powders used for compacts and coating layers ... 59
5-3-2 Phase changes of the coated surface of the compact ... 62
5-3-3 Correlation between crystal orientation of cordierite and heat-treatment temperature ... 65
5-4 Conclusions... 74
Chapter 6 Preparation of Dense Mullite Polycrystals by Reaction Sintering of Kaolin Materials and Alumina and their Microstructure 6-1 Introduction... 76
6-2 Experimental Procedure ... 76
6-2-1 Starting Materials ... 76
6-2-2 Characterization... 80
6-3 Results and Discussion ... 80
6-3-1 Thermal changes of kaolin ... 80
6-3-2 Thermal reaction of the mixtures ... 85
6-3-3 Densification of the mixtures ... 88
6-3-4 Microstructure of Mullite ... 90
6-3-5 Quantification of Microstructure ... 90
6-4 Conclusion ... 94
Chapter 7 Conclusions 7-1 Quantification of ceramic microstructures with digital images analysis ... 95
7-2 Effect of microstructure on CTE of dense cordierite prepared from sol mixtures ... 95
7-3 Effect of particle size of talc on crystal orientation of cordierite ceramics ... 95
7-4 Preferred crystal orientation of cordierite by interdiffusion of Al2O3·2SiO2 and 3MgO·4SiO2 . 96 7-5 Preparation of dense mullite ceramics and their microstructure ... 96
List of Publications ... 98
Others ... 99
Presentations at international conferences and seminars ... 100
Acknowledgment ... 101
1 Chapter 1 Introduction 1-1 Silicate ceramics
Many natural silicate minerals are found in earth crust since chemical composition of earth crust is consisted of a large amount of oxygen, silicon and aluminum.1 Crystalline or amorphous silicate materials, or their composites dominantly constitute ceramics such as refractories, tiles, potteries and porcelains, since these ceramics can be prepared using the natural silicate minerals (called also as clay minerals) as raw materials. The fundamental structural unit of silicate is SiO4-tetrahedrons, and SiO4-tetrahedron groups such as SiO44-, Si2O76-, Si3O96-, Si4O128-, Si6O1812-, (SiO3)n2n-, (Si4O11)n6n-, (Si2O5)n2n-, and (SiO2)n are formed basing on the connecting style of SiO4-tetrahedrons in the framework of crystal structure. Furthermore, the connecting styles of SiO4-tetrahedrons are mineralogically classified into six types of structures referred to as neso-, soro-, cycro-, ino-, phyllo- and tecto-silicates. Silicate based ceramics have a rigidity, a thermal stability, corrosion resistance, weather resistance, and electric insulation, and have been applied in many industrial fields depending on their various properties. Particularly, the silicate ceramics such as steatite (MgO·SiO2), forsterite (2MgO·SiO2), mullite (3Al2O3·2SiO2), zircon (ZrO·SiO2) and cordierite (2MgO·2Al2O3·5SiO2) have superior properties, and therefore have been applied for industrial use such as structural, electrical, and high-temperature materials.
On the other hand, new types of ceramic materials having advanced properties were needed for fields of science and technology with growing demand for advanced materials, presently.2 They are produced from highly purified minerals and pure metal oxides, or from chemically prepared precursors using sol-gel processing,3 atomic layer deposition,4 gas-phase synthesis5 and liquid-phase synthesis.6,7 We have called them advanced ceramics. Using a highly purified or chemically obtained raw materials and regulating a preparation routes can control chemical compositions and microstructures of resultant ceramics. As a result, advanced ceramics have excellent properties and can be applied to various field of modern science and technology as electronic materials, catalyst, fluorescent materials, magnetic materials optical materials, nanomaterials, coatings, superconducting material, structural materials and composites etc.
Advanced ceramics can be catabolized into two types depending on the constituent; oxides such as Al2O3, TiO2, ZrO2, ZnO2, ZrW2O8, Al2TiO3, CaTiO3, BaTiO3, MnFe2O4, LiCoO2 and Y2Nb2O7 etc., and non-oxides such as SiC, Si3N4, AlN, GaN, ZrC, WC and BN etc.
Also on silicate ceramics, highly-purified raw materials can be used, and the preparation techniques are drastically improved owing to appearing advanced ceramics, and the chemical composition and the microstructure can be arbitrarily controlled. As a result, the extremely pure silicate ceramics such as mullite and cordierite, already mentioned above, are expected to serve their superior properties in the fields of modern science and technology, as well as advanced ceramics. Especially, cordierite ceramics have been widely used in many industrial fields and
2 studied by many researchers for a long time.
1-2 Cordierite ceramics
Cordierite (2Al2O3·2MgO·5SiO2) is categorized mineralogically into cyclosilicate, and has several types of polymorphs, -cordierite (hexagonal), -cordierite (orthorombic) and a metastable
-cordierite, which appear as a metastable phase at a limited temperature and time.8 The indialite is the name used for the synthesized -cordierite, having a pseudohexagonal lattice due to the impurities not eliminated in the synthesis process, and is found in many commercial cordierite ceramics.9 Cordierite also has large anisotropic coefficients of thermal expansion (CTEs) of 2.5 × 10⁻⁶ K-1 and -0.9 × 10⁻⁶ K-1 along the a and b axes, and c axis, respectively. It is reported that this large anisotropic CTE is attributed to its unique crystal structure.10 Cordierite crystal is formed by six-membered ring composed of six T2O4-tetrahedrons. Here, T2 sites are occupied by Si or Al.
The rings are situated on top of each other as a result of rotation about 30° with the lines connecting the center of the rings parallel to the c axis.11 The T1O4-tetrahedron and MgO6 octahedron are connected to the six-membered rings.11 Here, T1 sites are occupied by Si or Al.
Sintered cordierite ceramics usually have a low CTE of approximately 1.7 × 10⁻⁶ K-1, corresponding to an average value of crystal axes expansion, in the range from room temperature to 900 °C. It has long been considered to be difficult to produce dense cordierite ceramics since cordierite incongruently melt near the sintering temperature. In order to prepare dense cordierite ceramics, various preparation methods have been discussed. Mixing of a sintering aid12 resulted in a decrease of the cordierite crystallization temperature and an increase of the density of the final product. However, addition of the sintering aids degrades the thermal expansion and dielectric properties. Homogeneous and fine cordierite powder that can be sintered without the addition of sintering aids is prepared from glass-ceramic processes13 and advanced sol-gel processes.14-17 The former involves a sintering of quenched glass or glass powder compact in the stoichiometric composition of cordierite. The latter uses metal alkoxides as starting materials and produces cordierite ceramics via sol-gel processes. However, these methods have not reached practical applications because of problems such as complex procedures and expensive raw materials. Sumi et al. reported18,19 the preparation method of dense cordierite ceramics using pure kaolin and synthesized fine particles of Mg(OH)2. However, a slight difference from the chemical composition of cordierite led to the coexistence of a small amount of spinel (MgO·Al2O3). This spinel increases the CTE of cordierite polycrystals. Although it is difficult to obtain densely sintered body, the most popular technique available is ultimately the solid-state reaction of precursor oxides20-23 such as talc, kaolinite and alumina owing to its cost effectiveness and its adaptability for forming and firing processes.24,25
Porous cordierite ceramics have been prepared by extruding the powder mixtures mainly composed of kaolin and talc, and have been extensively utilized for various applications such as honeycomb structured catalyst carriers in the car exhaust systems26-30, a diesel particulate filter
3
(DPF)26, ceramic gas turbine heat exchangers,31 hot gas filters,31 and molten metal filters,32 etc. It is well known that the porous cordierite prepared from kaolin and talc exhibits extremely low CTE less than 1.0 × 10⁻⁶ K-1 along the direction parallel to extruding direction.21 The extremely low CTE is thought to be caused by two factors: (1) occurrence of microcracks and (2) preferable crystal orientation of cordierite.
When the sintered multi-phase ceramics are cooled from high processing temperatures, a spontaneous microcracking occur depending on the difference in thermal expansion properties.33-35 In single-phase polycrystalline ceramics, anisotropic thermal expansion of crystal axes also induces microcracking. According to the many researches already reported,33,36,37 the temperature difference to generate microcracks depends on the grain size of polycrystalline bodies and the degree of thermal expansion anisotropy of a crystal. Hamano etc.38-41 studied the relationship between microstructure and thermal expansion properties of aluminum titanate polycrystals, which has a larger thermal expansion anisotropy than that of a cordierite crystal, and reported that polycrystalline aluminum titanate prepared by reaction-sintering had a large secondary grains (hereafter referred to domain) constructed by many primary grains in the same crystal orientation and that the domain size affected the CTE of aluminum titanate polycrystals. Cordierite honeycomb ceramics were also reported42-45 to possess domain structure, and the domain structure was also considered to affect thermal expansion property of cordierite honeycombs. However, quantification of domain structure was extremely difficult, and the relationship between CTE and domain structure has not yet been clarified.
The c-axis of cordierite crystal having negative CTE aligns parallel to the extruding direction during a sintering and thermal reactions,20,21 so that the CTE of extruding direction shows a lower value than usual CTE of sintered cordierite without crystal orientation. Lachman20,21 reported that c-axes of cordierite crystals aligned in vertical to c-axes of tabular kaolinite and that talc powder used for precursor mixture react with Al2O3 component contained in kaolin and corundum powders to form eutectic liquid. Thereafter, the preferable crystal orientation of cordierite has been believed to be attributed to the preferable orientation of large anisotropic tabular kaolinite used as raw material of cordierite ceramics, induced during extrusion molding. However, factors causing preferred orientation of cordierite crystal are not discussed enough in details.
1-3 Purpose of this study
It has been difficult to characterize the microstructure of cordierite ceramics because of their multiple structures. Generally, primary small cordierite grains observed by scanning electron microscope constitute a large secondary grain. This secondary grain has been called “domain”.
However, the domain size has only been roughly estimated by the microcracks using scanning electron microscope. The precise domain size was difficult to evaluate because the microcracks (gap) between many domains were in the size below >0.1m. A cordierite crystal is in hexagonal system and has an optical anisotropy, namely birefringence. In the area of petrographic researches,
4
optical polarizing microscope is frequently used for an observation of optically anisotropic crystals.
The purposes of this study were as follows.
(1) A quantitative evaluation of microstructure of ceramics could be attained by the digital image analysis of photographs of ceramics using an optical polarizing microscope and a scanning electron microscope.
(2) The domain structure of cordierite can be quantitatively evaluated by a digital image analysis of photographs and the relationship between the domain size and the thermal expansion properties can be clarified. Especially, an extra-low thermal expansion property can be explained by quantitative evaluation of microcracks.
(3) Conventionally, a preferred crystal orientation of cordierite ceramics prepared from the mixture of kaolin, talc and alumina by extrusion molding has been reported to depend on the prior orientation of anisotropically shaped raw material particles, especially tabular kaolinite particles.
However, the effect of the anisotropic shape of talc particles has been ignored in many researches.
The purpose of this study was to clarify the effect of orientation property of tabular talc particles on the preferable crystal orientation of cordierite.
(4) When kaolinite and talc powders are used as a starting mixture for the extrusion of cordierite-based ceramics, the c-axis of the cordierite crystals is aligned vertically to the c-axis of the kaolinite crystals during heat-treatment. Lachman et al. reported that this preferred orientation of cordierite was attributable to the crystal structure and orientation of kaolinite similarly to mullite crystals topotactically generated from kaolinite. However, many crystalline phases such as mullite, enstatite, sapphirine, spinel, and cristobalite are transiently generated during heat-treatment of a starting mixture containing silicates. The purpose of this study was to investigate the thermal reaction mechanism of preferable orientation of cordierite crystals between the interface of Al2O3-SiO2 mixtures and MgO-SiO2 mixtures.
(5) Mullite ceramics are also valuable in a variety of industry, such as refractories, ceramic packages of electro circuits and so on. The purpose of this study was to clarify the effect of preparation process of raw materials on the sintering and densification of mullite ceramics and to evaluate quantitatively the resultant microstructures.
1-4 Course of this study
(1) The digital image analysis with the aid of optical polarization microscopy was introduced to quantify domain structures of cordierite ceramics prepared by reaction sintering. Digital image analysis was also available for quantification of microstructure of mullite ceramics using the aid of SEM. Using the computer software, microstructures of silicate ceramics can be easily measured from digital images of photomicrograph. (Chapter 2)
(2) Dense cordierite ceramics were prepared from a sol mixture of alumina, silica, and magnesia, and the relationship between microstructure and thermal expansion was clarified for sinters
5
with relative density greater than 97%. In the dense cordierite ceramics, submicrometer-sized primary cordierite crystals aligned in the same crystal orientation and constituted the domain structure. We discovered that these domain structures could be easily observed by optical polarizing microscopy and quantified by digital image analysis of the photographs. The occurrence of microcracks between domains larger than 40 lm was induced by the thermal expansion anisotropy of the cordierite crystal axes. As a result, the mean thermal expansion coefficient of the cordierite ceramics decreased to 0.4 × 10⁻⁶ K−1 from the average value of the crystal axes of 1.7 × 10⁻⁶ K−1. This lower thermal expansion coefficient could be theoretically explained by partial microcracking. (Chapter 3)
(3) Cordierite ceramics were prepared from several types of kaolin powders and talc powders having various median particle size with nanometer-sized alumina sol. Powder mixtures were uniaxially pressed, followed by cold isostatic pressing to make thin compacts. Crystal orientation of talc particle and resultant cordierite were evaluated using the X-ray diffraction profile measured on the uniaxially pressed surface of calcined compacts and sintered compacts, respectively. Coarser talc powders above 3m aligned their c-axis in vertical to the uniaxially pressed surface of the calcined compact during uniaxially pressing, owing to highly anisotropic tabular shape. The crystal orientation of resultant cordierite increased with an increase in the crystal orientation of talc powders on the pressed surface. This result indicated that the c-axis of cordierite crystal preferably oriented vertical to the c-axis of talc particle oriented. Using the combination of kaolin powders below 5 m and talc powders having median particle size between 3 m and 5 m, densely sintered cordierite, having relative density of 95 % and high crystal orientation of approximately 85 % [I110 / (I110+I002)], could be obtained. (Chapter 4) (4) This study examines the thermal reaction, and preferred orientation, of cordierite crystals at the
interface between Al2O3·2SiO2 and 3MgO·4SiO2 materials, prepared from fine calcined kaolin and talc, or oxide sol mixtures with an isotropic particle shape. Four types of compacts, coated with a thin layer of a different composition, were prepared and heat-treated at various conditions. In the case of all four combinations, MgO and Al2O3 were sufficiently diffused at temperatures above 1300 °C to generate cordierite crystals (MgO·2Al2O3·5SiO2) at the interface between Al2O3·2SiO2 and 3MgO·4SiO2. Below 1345 °C, the c-axes of cordierite crystals were preferentially oriented parallel to the interface. It was also found that the contacting interface of Al2O3·2SiO2 and 3MgO·4SiO2 materials provided a trigger for the nucleation and growth of cordierite crystals. Above 1345 °C, further diffusion of MgO and Al2O3 resulted in the appearance of the MgO–Al2O3–SiO2 system eutectic melt, prompting cordierite crystals to align parallel to each other, and at an angle to the interface, by dissolution and recrystallization. (Chapter 5)
6
(5) Dense and mono-phase mullite ceramics were prepared by reaction sintering of relatively pure kaolins with several kinds of alumina. Removal of coarse kaolin particles >1m by sedimentation substantially improved thermal reactivity and sinterability of kaolin and its mixtures with alumina. As for mixtures of refined kaolin and submicron corundum powder having a mullite composition, relative densities of above 98% were accomplished by heat-treatment at 1650°C for 1 h. Effect of alumina particle size on thermal reactivity between alumina and kaolin was investigated, and the difference in thermal reaction sequence between alumina and kaolin was clarified. A combination of sub-micron corundum and elutriated kaolin yielded a monodispersed and fine-grained mullite ceramics. (Chapter 6)
7 References
1 H. Sakai, “Introduction to earth science,” Tokai university, (2003) 2 Aldrich chemistry, Material Matters, Vol.4, No.2, 2(2009)
3 Aldrich chemistry, Material Matters, Vol.1, No3, 8–9(2006) 4 Aldrich chemistry, Material Matters, Vol.3, No.2, 28–30(2008) 5 Aldrich chemistry, Material Matters, Vol.4, No.1, 2–4(2009) 6 M. Hirano and E. Kato J. Amer. Ceram. Soc. 79 [3] 777–80(1996)
7 M. Hirano, C. Nakahara, K. Ota and M. Inagaki, J. Am. Ceram. Soc., 85 [5] 1333–5(2002) 8 U. Selvaraj, S. Komarnemi and R. Roy, J. Am. Ceram. Soc., 73 [12] 3663–9(1990)
9 J. R. GONZÁLEZ-VELASCO, M. A. GUTIÉRREZ-ORTIZ, R. FERRET, A.
ARANZABAL, and J. A. BOTAS, J. Mat. Sci., 34 1999 – 2002(1999)
10 M. F. Hochella, Jr., and G. E. Brown, Jr., J. Am. Ceram. Soc., 69 [1] 13–8 (1986)
11 H. Ikawa, T. Otagiri, O. Imai, M. Suzuki, K. Urabe and S. Udagawa, J. Am. Ceram. Soc., 69 [6] 492–8 (1986)
12 R.W. Dupon, R. L. McConville, D. J. Musolf, A. C. Tanous, and M. S. Thompson, J. Am.
Ceram. Soc., 73 335(1990)
13 C. Panda, W. M. Mobley and R. Raj, J. Am. Ceram. Soc., 72 [12] 2361–4 (1989) 14 H. Suzuki, K. Ota and H. Saito, J. Ceram. Soc. Jpn., 95 [2] 163–9 (1987)
15 H. Suzuki, K. Ota and H. Saito, J. Ceram. Soc. Jpn., 95 [2] 170–5 (1987)
16 N. Kikuchi, T. Sei, T. Tuchiya, S. Hayashi and K. Hayamizu, J. Ceram. Soc. Jpn., 101 [7]
824–9 (1993)
17 J. Rokoh, H. Imai and H. Hirashima, J. Ceram. Soc. Jpn., 105 [1] 43–7 (1997) 18 K. Sumi, Y. Kobayashi and E. Kato, J. Am. Ceram. Soc., 81 [4] 1029–32 (1998) 19 K. Sumi, Y. Kobayashi and E. Kato, J. Ceram. Soc. Jpn., 106 [7] 693–7 (1998) 20 I. M. Lachman and R. M. Lewis, U.S. Patent No.3,885,977 (1975)
21 I. M. Lachman, R. D. Bagley and R. M. Lewis, Ceramic Bulletin Vol. 16, No12 (1981) 22 R. Johnson, B. P . Saha, I . Ganesh, V. Mahender, S . Bhattacharjee, Y. R. Mahajan and M.
M. K. Khaja, Trans. Ind. Ceram. Soc., 59 [3] 93 (2000)
23 B. P . Saha, R. Johnson, I . Ganesh, G. V. N. Rao and Y. R. Mahajan, Mater. Chem. Phys., 67 [1–3] 140 (2001)
24 J . Howitt, in “Catalysis and Automobile Emission Control,” edited by A. Crucq and Frennet (Elsevier Science and Publisher).
25 R. Morrell, Proc. Brit. Ceram. Soc., 28 52 (1979) 26 P . M. Then and P . Day, Interceram., 69(1) 20 (2000) 27 H. Kainer and H. Reh, Interceram., 40 (2) 99 (1991)
28 R. Johnson, B. P . Saha, I . Ganesh, V. Mahender, S . Bhattacharjee, Y. R. Mahajan and M.
M. K. Khaja, Trans. Indian. Ceram., Soc. 59(3) 93(2000)
29 T. M. Gardner, S. E. Lott, S. J. Lockwood and L. I. Mclaughlin, U.S. Patent No. 5,830,421
8 (1998)
30 H. Ray, Interceram, 5 54 (1987)
31 J. P. Day and D. L. Hickman, J. Am. Ceram. Soc., 52 (1995)
32 Y. R. Mahajan and R. Johnson, “Current Scenario and Future Projections,” in Materials Research : edited by R. Chidabaram (Materias Reseach Society of India, 2003)
33 J. A. Kuszyk and R. C. Bradt, J. Am. Ceram. Soc., 56 [8] 420–3(1973) 34 I. Yamai and T. OOTA, J. Am. Ceram. Soc., 68 [5] 273–8(1985) 35 F. J. Parker and R. W. Rice, J. Am. Ceram. Soc., 72 [12] 2364–6(1989) 36 J. J. Cleveland and R. C. Bradt, J. Am. Ceram. Soc., 61 [11-12] 478–81(1973) 37 A.G. Evans, Acta. Metall., 26 [12] 1845–1853(1978)
38 K. Hamano, Y. Ohya, and Z. Nakagawa, Yogyo-Kyokai-Shi, 91 [2] 94–101 (1983) 39 Y. Ohya, K. Hamano, and Z. Nakagawa, Yogyo-Kyokai-Shi, 92 [5] 261–7 (1984) 40 D. F. Qian, Y. Ohya, K. Hamano and Z. Nakagawa, Yogyo-Kyokai-Shi, 93 [6] 315–21
(1985)
41 D. F. Qian, Y. Ohya, Z. Nakagawa and K. Hamano, J. Ceram. Soc. Jpn, 103 [10] 1022–6 (1995)
42 A. Shyam, E. Lara-Curzio, A. Pandey, T. R. Watkins and K. L. More, J. Am. Ceram. Soc., 95 [5] 1682–91 (2012)
43 T. Harada, T. Hamanaka, K. Hamaguch and S. Asami, Patent US 4,869,944 (1989) 44 G. Bruno, A. M. Efremov, C. P. An, B. R. Wheaton and D. J. Hughes, J.Mater.Sci., 47
3674–89 (2012)
45 G. Bruno and S. Vogel, J. Am. Ceram. Soc., 91 [8] 2646–52 (2008)
9 Chapter 2
Quantification of ceramic microstructures with digital images of photomicrograph
2-1 Introduction
Cordierite ceramics possess domain structure, which consist of submicron-sized primary cordierite crystals aligned in the same crystal orientation.1,2 The domain structures were thought to affect CTE, but it have been difficult to quantify the sizes and distributions of domains.
On the other hand, it is well known that the size and the distribution of grains affect various properties of polycrystals,3–15 and several methods have been used to quantify them.6–8,15 Major characterization methods are carried out with the aid of microscopy, such as optical polarization microscopy (OPM), scanning electron microscopy (SEM), and transmission electron microscopy (TEM). Ordinarily, a transparent overlay containing one or more test lines of known length is fixed in place over a photomicrograph of microstructure.16 Counting the number of intercepts between the test line and grain boundaries, and measuring distance between two intercepts closest each other can obtain the size and distribution of grains constituting polycrystalline ceramics.17 This measurement method are called “Linear intercept method”. Linear intercept method has been the most frequently used for quantification of size and distribution of grains constituting ceramics, since they do not need special devices and tools for measurement. However, linear intercept method also requires great care to obtain grain size distribution. Thus, easy and accurate method to quantify a microstructure of ceramics is strongly needed.
Recently, using the computer software, particle characteristics such as shape and size etc. can be easily measured from digital images of photomicrograph.18 The aid of the software makes also measurement of ceramics microstructures more easily than before. Here after, this method are referred to as “digital image analysis”. However, there are few reports of the microstructure measurement with the aid of the software using digital images of photomicrographs.
In this chapter, domain structures of cordierite ceramics were quantified with digital image analysis. Furthermore, digital image analysis was adopted also in measuring the microstructure of sintered mullite ceramics.
2-2 Experimental procedure
2-2-1 Quantification of domain structure of cordierite ceramics
Cordierite specimens were prepared by reaction sintering of various raw materials, and then petrographic thin specimens having a thickness of about 30 m were prepared. The microstructures of the sintered specimens were observed by optical polarizing microscope (BX 53-P, OLYMPUS Corp.co. Ltd).
10
2-2-2 Quantification of primary grains constituting mullite ceramics
Sintered mullite tablet were prepared by reaction sintering of pure kaolin and alumina, and then their surface was polished and thermally etched at 20 °C lower than sintering temperature for 10 min. The microstructures of the sintered specimens were observed by SEM (JSM-6335FM, JEOL co. Ltd.) at an acceleration voltage of 2.0 kV.
2-3 Result and Discussion
2-3-1 Quantification of cordierite domain by digital image analysis
Cordierite domains are thought to have an optical anisotropy same as the primary crystals since they consist of primary crystal grains aligned in same crystal orientation. Therefore, OPM using transmitted light was used for the domain observation. While turning the sample stage in a crossed Nicol prism, the large area repeated bright and dark as shown in Fig.2-1. These areas were thought to be the large domains composed of many submicron-sized primary grains oriented in the same direction. Thus, the domain structure of cordierite ceramics could be easily observed with the aid of an optical polarizing microscope. In comparison of specimens (A) with (B), the size and distribution of domains seem to be different. These microphotographs were also binarized by digital processing, and the digital images were used for quantification of the size and distribution of domains.
Determining the individual domain areas of S1, S2···Si, from the digital image obtained by optical polarizing microscopy, equivalent diameter Di of a circle having same area as Si was obtained from the equation,
i
i
D 2 S
. The curves of the cumulative domain number versus the equivalent diameter, Di, were shown in Fig.2-2. Here, a corresponding size to 50 number percent of the cumulative domain was defined as the average domain size, D50. The average domain size of specimens (A) and (C) showed 8 and 30 m, respectively. These quantified domain size did not correspond to visual result shown in OPM images. Therefore, the number-size distribution is unfavorable for quantification of domain size.
Many researchers19-25 have applied Turner’s work26 to examine CTEs of anisotropic thermal expansion ceramics and composites. Turner26 investigated the behavior of CTE in composites or polycrystalline solids and found that when the bulk modulus or rigidity of two crystals differs, the CTE of their composite cannot be shown in direct proportion to volume fraction. The average thermal expansion, r,could be calculated using the following equation, where K is the bulk modulus, F is the volume fraction, and ρ is the density.
11
On the other hand, in cases such as the present research where the bulk modulus, rigidity, and density can be assumed constant, CTE is proportional to the volume fraction of each phase:
Assuming that a polycrystalline solid is composed of monophase anisotropic crystals, the CTE of the solid is proportional to the volume fraction of the domain in that direction, as reported in the literature23-25. Thus, the distribution of domain size, which can be obtained from the digital image analysis, must be considered from the viewpoint of volume, same as that of mullite grain size. The distributions of domain size and domain volume were estimated by the following procedure. The volumes of the individual domains were calculated using the equation . From the curve of cumulative domain volume versus the equivalent diameter, Di, a corresponding size for 50 volume percent of the cumulative domain was redefined as the average domain size, D50. Fig.2-3 shows domain size distributions and average domain size based on the volume. Specimens (A) and (C) respectively showed average domain size of 15 and 51 m, and they had narrow domain size distributions. These results were good agreement with the result of OPM observation.
i i i
i i i i
r K F
F K
/ /
i i
r
F
3
2 3
4
i
i
V D
12
Fig.2-1 OPM images of cordierite ceramics
13
0 20 40 60 80 100
1 10 100
(A) D50 = 8m
(C)
D50 = 30m
Average domain size / m
C u m u la ti ve nu m be r p erc en t / %
Fig.2-2 Average domain size and domain size distributions of cordierite, based on the domain number
14
0 20 40 60 80 100
1 10 100
Average domain size / m
Cu m u la tive vo lu me p erc ent / %
(A)
D50 = 15m
(C)
D50 = 51m
Fig.2-3 Average domain size and domain size distributions of cordierite, based on the domain volume
15
2-3-2 Applying digital image analysis for quantification of microstructure of mullite ceramics Fig.2-4 shows SEM images of the three mullite specimens prepared under different conditions. Specimen (A) consisted of submicron grains. On the other hand, for specimens (B) and (C), extremely coarse grains were partially observed, and the number of coarse grain in specimen (C) increased more than that of specimen (B).
These microphotograph images were binarized by digital processing, and the digital data were used for quantification of the grain size and distribution.
Determining the individual domain areas of S1, S2···Si from the digital image obtained by SEM, equivalent diameter di of a circle having same area as Si was obtained from the equation,
i
i
D 2 S , similar to quantification of cordierite domains. Fig.2-5 shows grain number-size distributions of mullite ceramics. Average grain size of specimens (A), (B), and (C) showed 0.3, 0.3, and 0.4 m, respectively. The difference in grain size did not observe, and these results did not correspond to SEM observation. Also in a case of quantification of grain size of ceramics, the number-size distribution is unsuitable for quantification of domain size.
The volumes of the individual grains were calculated using the equation , where di
is the equivalent diameter of a circle having the same area as Si, and is equal to . From the curves of cumulative grain volume versus the equivalent diameter di, an equivalent size for 50 volume percent of the cumulative grains was defined as the average grain size d50. Fig.2-6 shows the grain size distributions and average grain size of mullite specimens. In order corresponding to specimens (A)-(C), grain size distributions became wider. Average grain size of specimens (A), (B), and (C) respectively showed 0.7, 0.8, and 1.0 m. These results corresponded well to the result of SEM observation.
3
2 3
4
i
i
V d
i
S 2
16
Fig.2-4 SEM images of mullite prepared under various condition
17
0 25 50 75 100
0.01 0.10 1.00
Cu m u la tive n umbe r per cent / %
(A)
d50 = 0.3m (B)
d50 = 0.3m
(C)
d50 = 0.4m
Average grain size / m
Fig.2-5 Grain number-size distributions of mullite ceramics
18
0 25 50 75 100
0.1 1.0
Average grain size / m
Cum u la tive vo lu me p er ce nt / %
(A)
d50 = 0.7m (B)
d50 = 0.8m
(C)
d50 = 1.0m
Fig.2-6 Grain volume-size distributions of mullite ceramics
19 2-4 Conclusions
Microstructure of cordierite ceramics and mullite ceramics respectively were quantified by digital image analysis of binarized photomicrographs, and next conclusions were obtained:
1 In sintered cordierite compacts, large domain structure could be observed by optical polarizing microscopy and it was confirmed that the domains were composed of primary submicron grains aligned in the same crystal orientation.
2 Also the size and distribution of primary grains of mullite ceramics could be easily quantified with digital image analysis.
3 The results of digital image analysis corresponded well to observation by SEM or OPM. Thus, the digital image analysis is available to estimate primary and secondary micriostructures of ceramics.
References
1 T. Harada, T. Hamanaka, K. Hamaguch and S. Asami, Patent US 4,869,944 (1989)
2 A. Shyam, E. Lara-Curzio, A. Pandey, T. R. Watkins and K. L. More, J. Am. Ceram. Soc., 95 [5] 1682–91 (2012)
3 S. G. Lee, Y. W. Kim and M. Mitomo, J. Am. Ceram. Soc., 84 [6] 1347–53 (2001) 4 A. de Pablos, M. I. Osendi and P. Miranzo, J. Am. Ceram. Soc., 85 [1] 200–6 (2002) 5 H.S. Lee and T. Kimura, J. Am. Ceram. Soc., 81 [12] 3228–36 (1998)
6 T. Hotta, K. Nakahira, M. Naito, N. Shinohara, M. Okumiya and K. Uematsu, J. Mater.
Res., 14 [7] 2970–9(1999)
7 H. Abe, T. Hotta, M. Naito, N. Shinohara and K. Uematsu, J. Am. Ceram. Soc., 86 [6]
1019–21(2003)
8 W.E. Lee and W.M. Rainforth, Ceramic Microstructures–Property Control by Processing, Chapman and Hall, London, 1994
9 P. Chantikul, S.J. Bennison and B.R. Lawn, J. Am. Ceram. Soc., 73 [8] 2419–27 (1990) 10 D. Kovar and M.J. Readey, J. Am. Ceram. Soc., 79 [2] 305–12(1996)
11 A. Krell and P. Blank, J. Am. Ceram. Soc., 78 [4] 1118–20 (1995)
12 F. Xiong, R.R. Manory, L. Ward, M. Terheci and S. Lathabai, J. Am. Ceram. Soc., 80 [5]
1310–2 (1997)
13 S.J. Penn, N.McN. Alfrord, A. Templeton, X. Wang, M. Xu, M. Reece and K. Schrapel, J.
Am. Ceram. Soc., 80 [7] 1885–88 (1997)
14 J. Seidel, N. Claussen and J. Rodel, J. Eur. Ceram. Soc., 15, 395–404(1995)
15 W.D. Kingery, H. K. Bowen and D. R. Uhmann, Introduction to Ceramics, 2nd Ed. Wiley, New York, 1976.
16 T. Hotta, J. Tatami, H. Tanaka, N. Shinohara, H. Emoto, M. Hattori, Y. Kishi, H. Abe, M.
Naito and K. Uematsu, American Ceramic Society Bulletin 83.11 (2004): 9101–5 17 J. C. Wurst, J. A. Nelson, J. Am. Ceram. Soc., 55 [2] 109(1972)
20
18 C.F. Moraa, A.K.H. Kwana, H.C. Chan, Cement and Concrete Research, 28 [6] 921–32 (1998)
19 H. Ikawa, T. Watanabe, K. Urabe, and S. Udagawa, Yogyo-Kyokai-Shi, 93 [12] 762–7 (1985)
20 N. Chawla, X. Deng, and D. R. M. Schnell, Mater. Sci. Eng., A, 426, 314–22 (2006) 21 H. Choe, T. Hsieh, and J. Wolfenstine, Mater. Sci. Eng., A, 237, 250–5 (1997)
22 J. Milhans, S. Ahzi, H. Garmestani, M. A. Khaleel, X. Sun, and B. J. Koeppel, Mater. Des., 30 1667–73(2009)
23 A. M. Efremov, Philos. Mag. A, 86 [36] 5431–40 (2006)
24 G. Bruno, A. M. Efremov, B. R. Wheaton, and J. E. Webb, Acta Mater., 58, 6649–55 (2010)
25 G. Bruno, A. M. Efremov, B. Clausen, A. M. Balagurov, V. N. Simkin, B. R. Wheaton, J.
E. Webb, and D. W. Brown, Acta Mater., 58, 1994–2003 (2010) 26 P. S. Turner, J. Res. NBS, 37, 239–50 (1946)
21 Chapter 3
Effect of Microstructure on the Thermal Expansion Coefficient of Sintered Cordierite Prepared from Sol Mixtures
3-1 Introduction
Cordierite (2Al2O3·2MgO·5SiO2) is in the hexagonal crystal structure and has large anisotropic coefficients of thermal expansion (CTEs) of 2.5 × 10⁻⁶ K-1 and -0.9 × 10⁻⁶ K-1 along the a and b axes, and c axis, respectively.Sintered cordierite ceramics have low CTE of approximately 1.7×10⁻⁶ K-1 in the range from room temperature to 900 °C. Therefore, they have superior thermal shock resistance. For this reason, it has long been utilized as a refractory material, filtering material for molten metals, and honeycomb-structured catalyst carrier in automobile exhaust systems. It can be difficult to produce dense cordierite ceramics using natural raw materials since they incongruently melt near the sintering temperature. Thus, many techniques to prepare dense cordierite ceramics have been proposed. These include glass-ceramic processes1 and advanced sol-gel processes2-5. The former involves sintering quenched glass in the stoichiometric composition of cordierite or its glass powder compact. The latter uses metal alkoxides as starting materials and produces cordierite ceramics via gel-sol processes. However, these methods have not reached practical applications because of problems such as complex procedures and expensive raw materials. We have already reported6, 7 the preparation of dense cordierite ceramics using kaolinite particles and synthesized fine particles of Mg(OH)2. However, a slight difference from the chemical composition of cordierite led to the coexistence of a small amount of spinel (MgO·Al2O3). This spinel increases the CTE.
In this study, we produced sintered cordierite ceramics from Mg(OH)2 particles, silica sol, and alumina sol with the relative density of at least 97 %. However, these ceramics showed a wide range of CTEs from 0.4 × 10⁻⁶–1.6 × 10⁻⁶ K-1 between room temperature and 900 °C. Observations with a scanning electron microscope (SEM) and optical polarizing microscope revealed that the submicron primary cordierite crystals constructed large domains with sizes of several tens of micrometers in the same crystal orientation. Moreover, digital image analysis of the photographs obtained by optical polarizing microscopy revealed that there was a clear relationship between the quantified domain size and CTE.
3-2 Experimental Procedures 3-2-1 Preparation
Ultrafine particles of Mg(OH)2 were precipitated from a mixture of magnesium chloride solution and ammonia solution, and separated by centrifugation. The resultant Mg(OH)2, silica sol (Nissan Chemical Industries, SNOWTEX-O), and alumina sol (Nissan Chemical Industries, ALUMINASOL 520) were ultrasonically dispersed in the stoichiometric composition of cordierite
22
(2Al2O3·2MgO·5SiO2). TiO2 fine particles (Kishida Chemical, anatase) were used to produce samples with various microstructures. The suspensions were stirred and then dried under an infrared lamp. After calcination for one hour at 800 °C, the samples were milled with an alumina mortar.
The sample powders were then uniaxially pressed into a 16-mm-diameter die by a uniaxial press at the pressure of 39.2 MPa followed by a cold isostatic pressing at 196 MPa. The resultant green disk was heated to 1000 °C in an electric furnace at the rate of 5 °C/min and then heated at the rate of 2.5 °C/min above 1000 °C. The furnace was maintained at a prescribed temperature for one hour and then it was left to cool.
3-2-2 Characterization
The crystalline phases of the sintered compacts were identified by X-ray diffractometry (Rigaku Corp., RINT 2500) utilizing Cu K X-ray radiation and a graphite monochromator. The lattice thermal expansion of the generated cordierite was measured by high-temperature powder X-ray diffractometry. The diffractometer was attached to an electronic furnace that had a window covered with Kapton film on which aluminum was deposited, and 99.999% silicon powder was used as an internal standard and N2 gas was flowed during the measurement in order to prevent oxidation of the silicon powder. Bulk density and apparent porosity were measured using the Archimedes' immersion method. The CTE of the sintered compact was measured using thermomechanical analysis equipment (TMA 8310, Rigaku Corp.) at a heating and cooling rate of 10 °C/min between room temperature and 900 °C. The microstructures of the sintered specimens were observed by SEM (JSM-6335FM, JEOL Ltd.) at an acceleration voltage of 2.0 kV, and an optical polarizing microscope (BX 53-P, Olympus Corp.).
3-3 Results and Discussion
3-3-1 Thermal reaction and sintering of sol mixtures (A) Thermal reaction of sol mixtures
Figure 3-1 shows the X-ray diffraction patterns of samples that were heat treated between 900 °C and 1200 °C for one hour then left to cool. Around 900 °C, decomposed MgO reacted with
-alumina and silica to form spinel (MgO·Al2O3). Above 1000 °C, a small amount of enstatite (MgO·SiO2) crystallized from amorphous phases. Around 1175 °C, -cordierite suddenly appeared from amorphous phases in the composition of the MgO-Al2O3-SiO2 system. Amorphous phases remained until the temperature reached 1175 °C, which was presumed from the broad band at about 2= 22°.
23
Fig. 3-1 XRD patterns of sol mixtures of alumina, silica, and Mg(OH)2
24
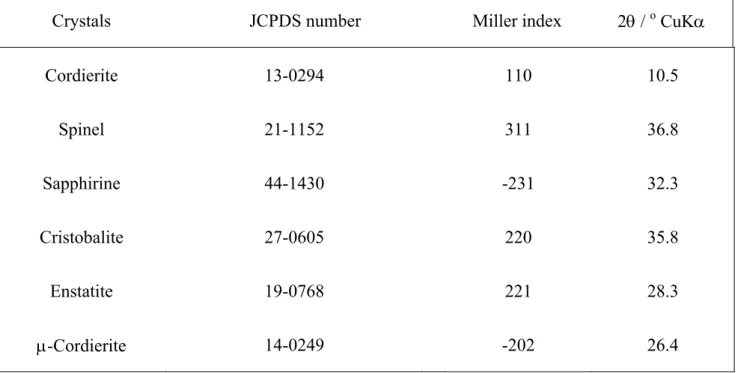
Table 3-1 Diffraction data of each crystalline phase used for determination of phase changes of specimens.
Crystals JCPDS number Miller index 2/ o CuK
Cordierite 13-0294 110 10.5
Spinel 21-1152 311 36.8
Sapphirine 44-1430 -231 32.3
Cristobalite 27-0605 220 35.8
Enstatite 19-0768 221 28.3
-Cordierite 14-0249 -202 26.4
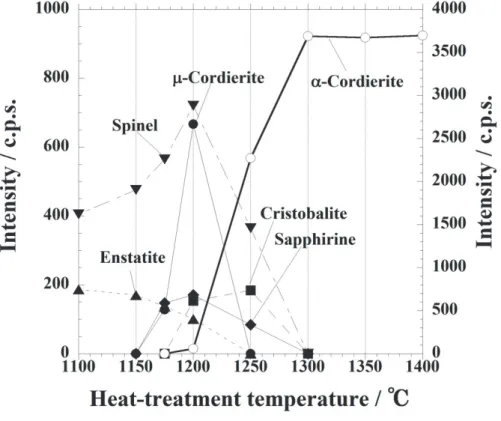
Figure 3-2 presents the qualitative changes in crystal phases above 1100 °C. The height of a single diffraction peak of each crystalline phase shown in Table 3-1 was used to determine the approximate amount of each crystal phase. These diffraction peaks were selected because they do not overlap. At 1175 °C, both sapphirine (4MgO·5Al2O3·2SiO2) and -cordierite, which were crystals in the MgO-Al2O3-SiO2 system, crystallized. At 1200 °C, the broad band around 2= 22°
attributed to the amorphous phases almost disappeared while the peaks for -cordierite and cristobalite rapidly increased. Above 1200 °C, -cordierite suddenly started to increase with consumption of-cordierite, sapphirine, spinel, and enstatite. At 1300 °C, the sintered compacts had completely transformed into monophase -cordierite. We concluded that the -cordierite was generated by transformation of -cordierite and solid-state reaction between sapphirine, spinel, cristobalite, and enstatite. It has been reported2, 4, 5, 8-10 that -cordierite directly crystallized without formation of additional intermediate crystalline phases such as spinel or cristobalite when the atomically homogeneous amorphous powder was heat treated. In this research, nanosized sol mixtures were used as starting material to produce cordierite so that intermediate crystals such as spinel, enstatite, and sapphirine appeared during reaction process.
25
Fig. 3-2 Phase changes of powder mixtures of alumina sol, silica sol, and Mg(OH)2 having cordierite composition
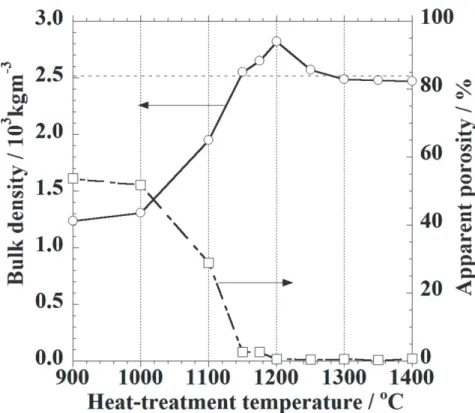
26 (B) Sintering characteristics
The bulk density and apparent porosity of the compacts sintered at each prescribed temperature are shown in Fig. 3-3. Here, bulk density and apparent porosity were determined by the Archimedes' immersion method. Bulk density rapidly increased in the range from 1000 °C to 1200 °C and the apparent porosity was almost 0 % at 1200 °C, revealing these powders to be very sinterable. As can be seen in the XRD pattern shown in Fig. 1, the amorphous phase was still present below 1175 °C. Therefore, it was thought that the viscous flow of the amorphous phase promoted sintering and densification of the substance. At 1200 °C, the bulk density had become greater than the value of 2.507 × 10³ kg m-3 calculated from the lattice parameters of -cordierite owing to the presence of -cordierite and sapphirine, which have somewhat larger density than
-cordierite. Above 1200 °C, the formation of -cordierite started to increase and the bulk density started to decrease. Since the compact turned into monophase cordierite above 1300 °C, the bulk density showed a constant value of approximately 2.47 × 10³ kg m-3. The relative density of the
-cordierite sample, which could be calculated from the ratio of bulk density to calculated density (2.507 × 10³ kg m-3), was about 98%. Thus, we successfully prepared dense -cordierite (hereafter referred to as cordierite).
Fig. 3-3 Bulk density and apparent porosity of samples heat treated at various temperatures
27 3-3-2 Thermal expansion properties of dense ceramics
Figure 3-4 shows the thermal expansion curves of sintered compacts A, B, and C, which contain different amounts of TiO2. The CTEs of the sintered cordierite ceramics showed various values in the range of 0.4 × 10⁻⁶–1.6 × 10⁻⁶ K-1, largely depending on the preparation conditions. There were more differences between heating and cooling curves in sintered compacts having lower CTE. The occurrence of microcracks was supposed from this result, as suggested for Al2TiO5 11.
3-3-3 Microstructure of sintered cordierite
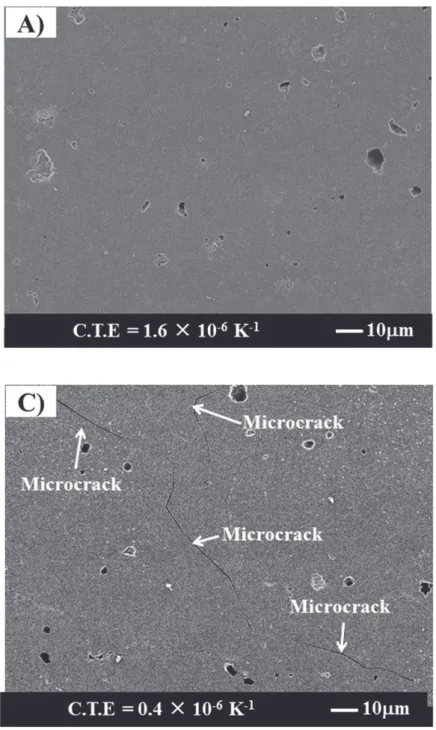
The polished surfaces of sintered cordierite compacts A and C were observed by SEM as shown in Fig. 3-5. Microcracks were not found in sintered compact A, which showed a CTE of 1.6 × 10⁻⁶ K-1 similar to the average of the crystal axes expansion. On the other hand, numerous microcracks were observed on the polished surface of sintered compact C, which showed lower expansion. In general, stresses arise in sintered compacts composed of crystals with thermal expansion anisotropy.
The stresses are proportional to the product of the CTE difference, , and the difference between the sintering temperature and room temperature, T. Kuszyk and Bradt12 studied the influence of grain size on the effects of thermal expansion anisotropy in MgTi2O5. They clarified that an increase in grain size induced abrupt decrease in CTE and showed that the critical size for microcrack formation depended on the strain energy and fracture surface energy.
The high-resolution SEM image of the polished and thermally etched surface of sintered compact A is shown in Fig. 3-6. Submicron-sized primary grains could be observed in each sintered compact.
Since the primary grain size did not differ despite varying preparation conditions, it is difficult to proclaim the intergranular stress between primary grains as the source of microcracks.
28
Fig. 3-4 Thermal expansion curves of dense cordierite prepared under various conditions
29
Fig. 3-5 SEM images of polished samples having CTEs of A) 1.6 × 10⁻⁶ K-1 and C) 0.4 × 10⁻⁶ K-1
30
Fig. 3-6 SEM image of dense cordierite ceramics that were polished, then thermally etched
31
Hamano etc. 13-16 studied the relationship between microstructure and thermal expansion properties of aluminum titanate, which has larger thermal expansion anisotropy than cordierite.
They showed that a large secondary particle was constructed by many primary grains in the same crystal orientation and that the domain structure affected the CTE of aluminum titanate polycrystals.
Cordierite honeycomb ceramics were also reported17-20 to possess domain structure, which affected CTE, on the basis of SEM observations. However, quantitative analysis of the domain size is quite difficult by only SEM observation. Therefore, petrographic thin samples of the cordierite ceramics having a thickness of about 30 m were observed by optical polarizing microscopy using transmitted light. While turning the sample stage in a crossed Nicol prism, the large area repeated bright and dark as shown in Fig. 3-7. These areas were thought to be the large domains composed of many submicron-sized primary grains oriented in the same direction. Thus, the domain structure of cordierite ceramics could be easily observed with the aid of an optical polarizing microscope.
Figure 3-7a shows the domain structure of sintered compact A, which showed an average CTE of 1.6 × 10⁻⁶ K-1. Fig. 3-7b shows the domain structure of sintered compact C having a CTE of 0.4 × 10⁻⁶ K-1. Comparing these figures, it can be concluded that the larger the domain grows, the smaller the CTE becomes.
Fig. 3-7 Polarizing microscope images of samples with CTEs of A) 1.6 × 10⁻⁶ K-1 and C) 0.4 × 10⁻⁶ K-1
32
3-3-4 Quantification of average domain size and CTE modeling
In order to reveal the quantitative relationship between domain size and CTE, the size and distribution of the domains were quantified from the binarized image obtained by optical polarizing microscopy. Many researchers21-27 have applied Turner’s work28 to examine CTEs of anisotropic thermal expansion ceramics and composites. Turner28 investigated the behavior of CTE in composites or polycrystalline solids and found that when the bulk modulus or rigidity of two crystals differs, the CTE of their composite cannot be shown in direct proportion to volume fraction.
The average thermal expansion, r,could be calculated using the following equation, where K is the bulk modulus, F is the volume fraction, and ρ is the density.
i i i
i i i i
r K F
F K
/ /
On the other hand, in cases such as the present research where the bulk modulus, rigidity, and density can be assumed constant, CTE is proportional to the volume fraction of each phase:
i i
r
F
Assuming that a polycrystalline solid is composed of monophase anisotropic crystals, the CTE of the solid is proportional to the volume fraction of the domain in that direction, as reported in the literature25-27. Thus, the distribution of domain size, which can be obtained from the image analysis, must be considered from the viewpoint of volume. The distributions of domain size and domain volume were estimated by the following procedure. Determining the individual domain areas of S1, S2···Si, from the digital image obtained by optical polarizing microscopy, the volumes of the individual domains were calculated using the equation
3
2 3
4
i
i
V D , where Di is the equivalent
diameter of a circle having the same area as Si, and is equal to
i
S
2 . From the curve of cumulative domain volume versus the equivalent diameter, Di, a corresponding size for 50 volume percent of the cumulative domain was defined as the average domain size, D50.
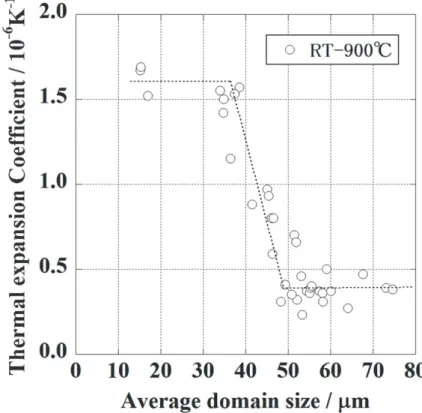
Figure 3-8 shows the relationship between average domain size D50 and the average CTE from room temperature to 900 °C for various sintered cordierite ceramics. Changing the amount of TiO2
could lead to various CTEs in the sintered compacts. A clear relationship could be seen between the domain size and CTE of the sintered compacts. When the domain size was smaller than 40 m, CTE was around 1.7 × 10⁻⁶ K-1, which coincided with previously reported results.17 On the other hand, when the domain size exceeded 40 m, CTE decreased rapidly to around 0.4 × 10⁻⁶ K-1. When the amount of TiO2 was changed, the sintered compacts showed various CTEs, but the detailed trend was not clear. Additional research is needed to clarify the effect of TiO2 on CTE and
33 domain size in reaction-sintered cordierite.
Fig. 3-8 Effect of domain size on CTE
34
Fig. 3-9 Thermal expansion of the crystal axes of cordierite
35
Figure 3-9 shows the thermal expansion of sintered cordierite ceramics measured via high-temperature X-ray diffraction. There are many reports27, 29-33 about the lattice thermal expansions of cordierite including both hexagonal and orthorhombic crystals (- and -type, respectively). The sintered cordierite ceramics obtained in this study were hexagonal crystals, as confirmed by the X-ray diffraction patterns, which agreed well with the X-ray diffraction data reported for the hexagonal crystal (JCPDS 13-0294). Therefore, the lattice expansions shown in Fig.
3-9 were determined using the diffraction data for the hexagonal crystal (JCPDS 13-0294). The lattice CTE of each crystal axis in sintered cordierite ceramics are shown in Table 3-2 along with those from previous studies27, 29, 32 in which the thermal expansion was measured to above 900 °C.
The lattice CTE that we determined for sintered compact A was slightly different from the results reported by Milberg and Blair, 32 even though they reported the same hexagonal crystal. On the other hand, the lattice CTE and mean CTE from our results were in good agreement with the results reported by Mirwald29 and Bruno. 27 In this study, the lattice CTEs from our results, a = 3.36 × 10⁻⁶ K-1 and c = -1.61 × 10⁻⁶ K-1, were used for theoretical calculations.
Table 3-2 The lattice CTE of cordierite ceramics and of previously reports measured at the temperature range between room temperature and 900 °C
Hexagonal Orthorhombic Lattice CTE
(×10-6 K-1) A B Lattice CTE
(×10-6 K-1) C D
a 3.36 2.64 a 3.91 2.87
a 3.36 2.64 b 2.41 3.56
c -1.61 -1.49 c -1.03 -0.92
1.70 1.26 1.76 1.84
(A) This study, (B) Milberg and Blair, 32 (C) Mirwald, 29 and (D) Bruno et al.27
36
The observed domains can be regarded as single crystals because the domains were composed of primary grains aligned in the same crystal orientation. Assuming the domains distributed randomly and statistically in the sintered cordierite ceramics, the domain boundaries consist of many combinations of crystal axes. As the simplest approximation, domain boundaries are supposed to be composed of the following nine combinations of crystal axes:
(1) a-a, (2) a-b, (3) a-c, (4) b-a, (5) b-b, (6) b-c, (7) c-a, (8) c-b, (9) c-c
These combinations can be classified into the following three groups according to the CTE values between domains:
Group 1, large CTE: (1) (2) (4) (5) Group 2, small CTE: (3) (6) (7) (8) Group 3, negative CTE: (9)
The average CTE of microcrack-free cordierite ceramics can be calculated as a mean value of nine combinations of groups 1, 2, and 3 constituting the domain boundaries as follows:
1 6 1
10 7 . 3 1
9
2 2 2 2
2 2 2 2
2
c K
b a
c b c
a b
a c
c b b a a
The calculated result of 1.7 × 10⁻⁶ K-1 from room temperature to 900 °C was in good agreement with the result obtained for sintered polycrystals shown in Fig. 3-8. Also, the calculated average thermal expansion curve in Fig. 3-9 was in good agreement with the thermal expansion curve of the dilatometric curve of microcrack-free specimen A in Fig. 3-4.
By the energy criterion proposed by Cleveland and Bradt,34 the critical grain size at which formation of microcracks initiates was inversely proportional to the square of thermal expansion difference and temperature difference TWhen the small domains are exposed to stresses caused by the thermal expansion anisotropy, microcracks will not occur during cooling since
and T are too small for a fracture to initiate. On the other hand, when the large domains are exposed to stresses caused by the expansion anisotropy at cooling, microcracks occur at the domain boundaries having the largest CTE (group 1) first. In contrast, microcracks do not occur yet at the domain boundaries in groups 2 and 3 since the CTEs of these boundaries are small or negative. In this case, the CTE of the ceramics corresponds to an average of group 2 and 3, hereafter designated as 2, and is calculated as follows:
1 6 2
10 4 . 5 0
3
5
2 2 2
2 2
c K
b a
c b c
c c a
37
This value agreed well with the lower limit of the CTE shown in Fig. 3-8. These results indicate that the simple partial microcrack model proposed in this paper is applicable to thermally anisotropic ceramics that have microcracks.
3-4 Conclusions
Dense cordierite ceramics were prepared from sol mixtures, and the domain structures could be easily observed by optical polarizing microscopy and quantified by digital image analysis. After examining the relationship between CTE and the average domain size of the cordierite, the following conclusions were obtained:
1 Dense sintered compacts of single-phased cordierite can be prepared from nanosized particles of Mg(OH)2, alumina sol, and silica sol.
2 In sintered cordierite compacts, large domain structure could be observed by optical polarizing microscopy and the domains were composed of primary submicron grains aligned in the same crystal orientation.
3 It could be inferred that the critical domain size at which microcracks began to appear was around 40 m.
4 The lower CTE limit of sintered cordierite ceramics at around 0.4 × 10⁻⁶ K-1 was attributed to the appearance of partial microcracking caused by stresses arising from thermal expansion anisotropy and domains larger than 40 m.
References
1 C. Panda, W. M. Mobley, and R. Raj, J. Am. Ceram. Soc., 72 [12] 2361–4 (1989) 2 H. Suzuki, K. Ota, and H. Saito, J. Ceram. Soc. Jpn., 95 [2] 163–9 (1987)
3 H. Suzuki, K. Ota, and H. Saito, J. Ceram. Soc. Jpn., 95 [2] 170–5 (1987)
4 N. Kikuchi, T. Sei, T. Tuchiya, S. Hayashi, and K. Hayamizu, J. Ceram. Soc. Jpn., 101 [7]
824–9 (1993)
5 J. Rokoh, H. Imai, and H. Hirashima, J. Ceram. Soc. Jpn., 105 [1] 43–7 (1997) 6 K. Sumi, Y. Kobayashi, and E. Kato, J. Am. Ceram. Soc., 81 [4] 1029–32 (1998) 7 K. Sumi, Y. Kobayashi, and E. Kato, J. Ceram. Soc. Jpn., 106 [7] 693–7 (1998) 8 U. Selvaraj, S. Komarneni, and R. Roy, J. Am. Ceram. Soc., 73 [12] 3663–9 (1990) 9 S. J. Lee and W. M. Kriven, J. Am. Ceram. Soc., 81 [10] 2605–12 (1998)
10 J. Banjuraizah, H. Mohamad, and Z. A. Ahmad, Int. J. Appl. Ceram. Technol., 8 [3] 637–
45 (2011)
11 W. R. Buessem, N. R. Thielke, and R. V. Sarakauskas, Ceram. Age, 60 [3] 8–40 (1952) 12 J. A. Kuszyk and R. C. Bradt, J. Am. Ceram. Soc., 56 [8] 420–3 (1973)
13 K. Hamano, Y. Ohya, and Z. Nakagawa, Yogyo-Kyokai-Shi, 91 [2] 94–101 (1983) 14 Y. Ohya, K. Hamano, and Z. Nakagawa, Yogyo-Kyokai-Shi, 92 [5] 261–7 (1984) 15 D. F. Qian, Y. Ohya, K. Hamano, and Z. Nakagawa, Yogyo-Kyokai-Shi, 93 [6] 315–21