2019 年 4 月 25 日発行
原著論文 Original Paper
1〒 625–0086 京都府舞鶴市字長浜 京都大学フィールド科学教育研究センター舞鶴水産実験所 2〒 005–8601 北海道札幌市南区南沢 5 条 1–1–1 東海大学生物学部海洋生物科学科 3〒 085–0802 北海道釧路市桂恋 116 水産研究・教育機構北海道区水産研究所 4〒 608–737 大韓民国釜山市南区 釜慶大学校海洋生物学部 (2018 年 10 月 12 日受付;2018 年 11 月 28 日改訂;2018 年 11 月 30 日受理;2019 年 2 月 4 日 J–STAGE 早期公開) キーワード:ガンギエイ目 , Beringraja pulchra, ミトコンドリア DNA, COI, 保全単位Japanese Journal of Ichthyology © The Ichthyological Society of Japan 2019
Ryo Misawa*, Nozomu Muto, Tomonori Hamatsu, Jin-Koo Kim and Yoshiaki Kai. 2019. Genetic population structure and morphological differences in the mottled skate Beringraja pulchra. Japan. J. Ichthyol., 66(1): 23–35. DOI: 10.11369/jji.18-042.
Abstract The mottled skate Beringraja pulchra, distributed in the western North Pacific,
is a commercially important species, directly targeted by Japanese and Korean fisheries. Despite a recently decreasing catch rate, no studies of population structure, crucial to sustainable fisheries management and conservation practices, are known to have been made. Because skates generally have low dispersal ability and are likely to have an extensive population structure, due to large benthic egg capsules and no pelagic larval stage, the population structure of the species was assessed on the basis of sequence variations of the mitochondrial DNA cytochrome c oxidase subunit I (COI) 592 bp (in 166 individuals) and morphological variations in seven morphometric characters (in 192 individuals), representing five areas, including Hokkaido, Japan [coasts along Sea of Okhotsk, Pacific Ocean, and Sea of Japan (the East Sea of Korea)], western Sea of Japan, and Yellow Sea. The genetic analysis detected 12 haplotypes, six being shared among the sampling areas, although significant pairwise ΦST estimates indicated restricted gene flow
among the sampling areas (excluding those off the Hokkaido). The extensive population structure of the species was also supported by morphological differences in several characters, such as disc length, disc width, and eye diameter. Beringraja pulchra was concluded as being clearly structured into three populations for future management, viz. Hokkaido, western Sea of Japan, and Yellow Sea populations. This population structure may have been shaped by the Tsushima Current flowing between the Korean Peninsula and the Japanese Archipelago, the species generally inhabiting colder water.
*Corresponding author: Maizuru Fisheries Research Station, Filed Science Education and Research Center, Kyoto University, Nagahama, Maizuru, Kyoto 625–0086, Japan (e-mail: [email protected])
生
物資源を適切に保全するためには,その実 施単位となる遺伝的に独立した地域集団を 識別するとともに,その遺伝的多様性や歴史的背 景の推定といった集団遺伝学的手法が重要な役割 を果たすと考えられる(小池・松井,2003).水 産生物においても有効な資源管理のためには管理 単位の基礎となる遺伝的集団構造の理解が重要で ある(Palsbøll et al., 2006). ガ ン ギ エ イ 目 ガ ン ギ エ イ 科 の メ ガ ネ カ ス ベ Beringraja pulchra は,西部北太平洋の北海道全沿 岸,青森県から島根県の日本海沿岸,青森県から 千葉県銚子までの太平洋沿岸,中国の東シナ海・メガネカスベにおける遺伝的集団構造と形態的差異
三澤 遼
1・武藤望生
2・濱津友紀
3・金 眞久
4・甲斐嘉晃
1黄海沿岸,朝鮮半島全沿岸,そしてロシアのサハ リ ン か ら ピ ー タ ー 大 帝 湾 の 日 本 海 沿 岸 の 水 深 5–700 m に出現する比較的大型の底生性軟骨魚類 である(Ishiyama, 1967;Antonenko et al., 2011;波 戸 岡 ほ か,2013;Panchenko and Boiko, 2015; 鄭, 2018).本種は,日本では北海道のオホーツク海 沿岸と日本海沿岸に多く,主に刺網や延縄,底曳 網で漁獲されるほか,太平洋側の噴火湾沿岸でも 漁獲されている(前田,2003).主に北海道で マ カスベ(真カスベ) の名前で流通し,煮付けや 煮こごり,ぬた,から揚げなどで食されるほか, 干物や練り製品として利用される(前田,2003; 尼岡ほか,2011).また,韓国では食用としてと くに珍重され,高値で取引されており,主に黄海 と 鬱 陵 島 沖 の 日 本 海 で 多 く 漁 獲 さ れ て い る (Ishihara et al., 2009;Im et al., 2017).
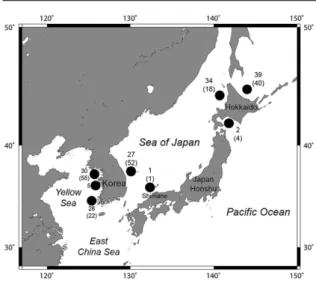
ガンギエイ目魚類を含む軟骨魚類は成熟までに 時間がかかること,産卵・産仔数が少なく繁殖力 が低いことから,混獲を含む漁獲圧に対して脆弱 で,資源管理の必要性が指摘されている(Brander, 1981;Walker and Hislop, 1998;Dulvy et al., 2000; Griffiths et al., 2010;Griffiths et al., 2011).メガネカ スベの年齢や成熟,繁殖に関する知見は少ないが, 平均的な成熟サイズは雄で全長 966–1,052 mm,雌 では 962–1,119 mm と見積もられており(Ishiyama, 1958),成熟に長い年数を要すると考えられる.ま た,年間の産卵数は平均 240 個程度と推定されて いる(Ishihara et al., 2009).通常,ガンギエイ目魚 類は 1 個の卵殻に 1 個の胚を含むのに対して,本 種および同属の Beringraja binoculata のみ 1 卵殻内 に複数の胚を含み(Ishihara et al., 2012),本種の場 合 で は 通 常 2–5 個 の 胚 を 含 む が(Kang et al., 2013),産卵から孵化までに 5ヶ月以上を要するた め(Kang et al., 2013),繁殖力は低いと考えられる. さらに,本種の資源量は,過去 15 年間で 30% 以 上減少したと推定されており,IUCN(国際自然保 護連合)のレッドリストでは VU(絶滅危惧 II 類) に指定されている(Ishihara et al., 2009).実際,韓 国における漁獲量は 1993 年から 2000 年代にかけ て約 90% 減少している(Ishihara et al., 2009;Jo et al., 2011).日本では本種の漁獲量に関する詳細な 長期的データが不足しているが,漁業者の報告か らは資源量の減少が示唆されており(Ishihara et al., 2009),環境省の海洋生物レッドリストでは NT (準絶滅危惧)とされている(環境省,2017).以 上のことから,本種の資源状態のモニタリングお よび保護が必要であると考えられる. ガンギエイ目魚類は付着性の卵殻卵を海底に生 みつけること,普段は海底に横たわり活発な遊泳 をしないと考えられることから,その分散能力は 低く,結果として何らかの集団構造が存在する場 合が多いと考えられる.実際,これまで本目魚類 のミトコンドリア DNA(mtDNA)の分析に基づ いた集団構造に関する報告では,多くの種で地理 的な集団構造をもつことが知られている(Chevolot et al., 2006;Cariani et al., 2017;Im et al., 2017; Vargas-Caro et al., 2017;Ferrari et al., 2018).メガネ カスベでは,朝鮮半島の日本海沿岸と黄海沿岸の 両地点間で mtDNA の cytochrome c oxidase subunit I (COI)領域の塩基配列および形態に地理的な変 異 が あ る こ と が 明 ら か に な っ て い る(Im et al., 2017).しかし,Im et al.(2017)の研究では解析 対象とした個体の採集地点が朝鮮半島沿岸のみに 限られており,本種全体の集団構造が明らかに なっているとは言い難い.そこで,本研究では採 集範囲を拡大し,より詳細な集団構造を遺伝的・ 形態的差異から推定した.さらに,推定した集団 構造をもとに本種の適切な管理・保全単位につい て考察した. 材 料 と 方 法 標本 遺伝的分析には日本および韓国沿岸の 5 海域で採集された合計 166 個体[北海道オホーツ ク海沿岸(OSH)39 個体;北海道太平洋沿岸(POH) 2 個体;北海道日本海沿岸(SJH)34 個体;日本 海西部(SJW)28 個体(島根県沿岸 1 個体,朝鮮 半島東岸の慶尚北道沿岸 27 個体);朝鮮半島西岸 の黄海(YSK)63 個体(仁川沿岸 30 個体,忠清 南道沿岸 5 個体,全羅南道沿岸 28 個体)]を用い た(Fig. 1).なお,朝鮮半島の黄海沿岸から得ら れた個体の多くは Im et al.(2017)の遺伝的分析 (COI の 471 塩基対)に用いられているが,より 長い塩基配列を決定するために,本研究で再度分 析を行った. 形態解析では,COI 解析に用いた標本と同様の 5 海域から得られた合計 192 個体[北海道オホー ツク海沿岸 40 個体;北海道太平洋沿岸 4 個体; 北海道日本海沿岸 18 個体;日本海西部 53 個体 (島根県沖 1 個体,朝鮮半島東岸の慶尚北道沿岸 52 個体);朝鮮半島西岸の黄海 77 個体(仁川沿 岸 55 個体,全羅南道沿岸 22 個体)]を用いた(Fig. 1).なお,朝鮮半島東岸および西岸の標本は,Im et al.(2017)で用いられているものと同じである.
本研究の遺伝解析および形態解析に用いた標本 の一部は以下の研究機関に保存されている[高知 大学(BSKU), 京都大学(FAKU), 北海道大学 (HUMZ),国立科学博物館(NSMT-P),釜慶大学 (PKU)]. 北 海 道 オ ホ ー ツ ク 海 沿 岸:FAKU 137712,FAKU 137969–137970,FAKU 138173– 138174,FAKU 138550–138551,FAKU138836– 138841,FAKU 141136–141137,FAKU 141139, FAKU 141694,FAKU 141912–141916,FAKU 141975–141976,FAKU 141982,FAKU 141986– 141987,FAKU 141989,FAKU 142277–142282, FAKU 142286–142287,FAKU 142805–142807, FAKU 201459–201461,FAKU 201465–201476, HUMZ 20300,HUMZ 20311,HUMZ 131142, HUMZ 131193,HUMZ 132502,NSMT-P 59390;北 海 道 太 平 洋 沿 岸:BSKU 116211,FAKU 141782, HUMZ 13609,HUMZ 22316;北海道日本海沿岸: BSKU 123774,FAKU 141489–141498,FAKU 141772–141773,FAKU 143146–143148,FAKU 143968,HUMZ 109905,HUMZ 109957;日本海西 部:FAKU 142782,PKU 6126,PKU 6969–6970, PKU 58276,PKU 58278,PKU 58282,PKU 58284, PKU 58286,PKU 58288,PKU 58372,PKU 58374, PKU 58376,PKU 58378,PKU 58380,PKU 58382, PKU 58384,PKU 58386,PKU 58388,PKU 58390, PKU 58392,PKU 58452,PKU 58454,PKU 58456, PKU 58458,PKU 58460,PKU 58462,PKU 58464;
黄 海:FAKU 75281,FAKU 86535,PKU 1758– 1762,PKU 5439–5466,PKU 5469–5498.
mtDNA 解析 DNA の抽出は 99.5% エタノール
中に保存した体側筋から DNeasy Blood & Tissue Kit (Qiagen)もしくは Wizard Genomic DNA Purification
Kit(Promega)を用いて行った.遺伝的分析には, Im et al.(2017)で集団間にある程度の変異が認め られている COI 遺伝子領域の部分塩基配列を用い た.COI の部分配列は Fish F2(5'- TCGACTAATCA TAAAGATATCGGCAC-3')および Fish R2(5'-ACTT CAGGGTGACCGAAGAATCAGAA-3')のプライマー セット(Ward et al., 2005)を用いて PCR 増幅した. PCR 反応液の組成は KAPA2G Robust HotStart Ready Mix(KAPA Biosystems)5 μl, 滅 菌 蒸 留 水 2.2 μl, 各プライマー(5 μM)1.0 μl,鋳型 DNA1.0 μl を含 む合計 10.2 μl であり,PCR の温度条件は最初に 94˚C で 5 分 間 熱 変 性 さ せ た 後,94˚C で 15 秒, 57˚C で 15 秒,72˚C で 30 秒の温 度 サイクルを 30 回繰り返し,最後に 72˚C で 7 分加熱した.増幅産 物のうち 3.0 μl を 1% アガロースゲルを用いて電 気泳動することで増幅を確認した.増幅産物は ExoSAP-IT(Affymetrix)を用いて精製後,BigDye Terminator Cycle Sequencing Kit v. 1.1(Applied Biosystems)と PCR 増幅の際に使用したものと同 じプライマーを用いて反応を行い,ABI Prism 310 Genetic Analyzer で塩基配列を決定した.本研究に て 決 定した 塩 基 配 列 は日本 DNA デ ータバンク (DDBJ)に登録した(アクセッションナンバー: LC414185–LC414350). 得られた塩基配列は BioEdit v. 7.2.5(Hall,1999) で編集し,Clustal W v. 2.1(Larkin et al., 2007)でア ライメントを行った.ハプロタイプ間の類縁関係 を 示 す ハ プ ロタ イ プ ネットワ ー ク は Network v. 5.0.0.1(Fluxus Technology Ltd)を用いて,median-joining 法に基づいて作成した.遺伝的多様性の指 標であるハプロタイプ多様度(h)と塩基多様度(π) は Arlequin v. 3.5.1.3(Excoffier and Lischer, 2010)を 用いて海域ごとに算出した.海域間の遺伝的分化 の指標となるペアワイズ ΦST値は Arlequin を用い て算出した.ペアワイズ ΦSTは 10,000 回の再抽出 を繰り返して検定し,得られた P 値は,多重比較 によるタイプ I エラー率の増大を防ぐため,シー ケンシャル・ボンフェローニ補正(Rice,1989) により補正した.さらに,各海域間の遺伝的距離 を視覚的に把握するために,Past v. 3.21(Hammer et al., 2001)を用いて p-distance に基づいた多次元 尺度構成法(MDS)でプロットを図示した.また,
Fig. 1. Sampling area and number of examined
specimens of Beringraja pulchra. Each symbol represents sampling site. Numbers indicate number of specimens used in mitochondrial COI analysis. Numbers in parenthesis indicate number of specimens used in morphological analysis.
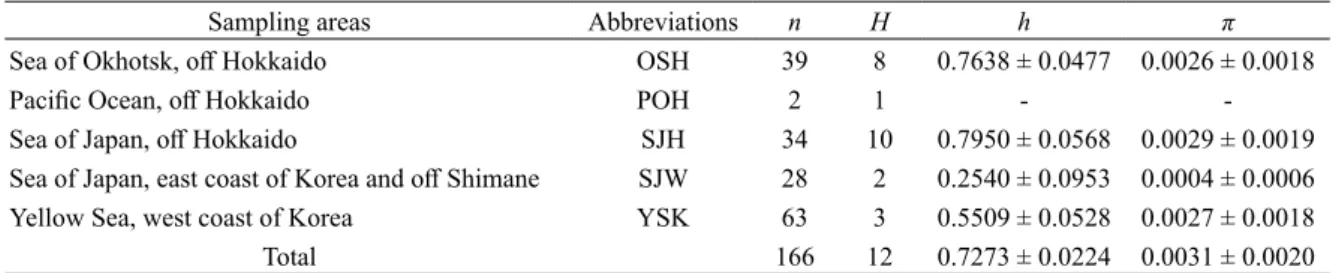
各海域における過去の集団動態を評価するため, Arlequin を用いてミスマッチ分布解析(Rogers and Harpending, 1992)を行った.ミスマッチ分布解析 では,集団拡大モデルの下で期待されるハプロタ イプ間の差異の頻度分布と,実際観測された頻度 分布の間の適合度を求め,偏差平方和(SSD)と Harpending s raggedness index(Hri) から 両 者 の 当 てはまりを 10,000 回のブートストラップにより評 価した.また,集団動態に関するパラメーターとし て,集団拡大以降の推定世代数,すなわち集団拡 大が始まってからの期間を示す τ 値と,集団拡大 前の集団サイズを示す θ0値および拡大後の集団サ イズを示す θ1値を 10,000 回のブートストラップに より算出した.加えて,Arlequin を用いて Tajima s D(Tajima,1989)と Fu s FS(Fu,1997)の中立性 検定を行い,それぞれを 10,000 回のブートストラッ プによって評価し,ミスマッチ分布解析と同じく集 団動態の指標とした.なお,個体数が 2 個体と少 ない北海道太平洋沿岸は ΦST値の算出,ミスマッ チ分布解析および中立性検定から除いた. 形態解析 形態解析に用いた個体は 70% エタ ノールもしくは 50% イソプロピルアルコールに 保存したものを用いた.計測方法は先行研究の Im et al.(2017)と同じく,中坊(2013)に従い, 全長,体盤長,体盤幅,眼径,眼前吻長,口前吻 長,尾前長の外部形態 7 形質を測定した.まず, 海域間の形態的差異の概要について把握するため に,7 計測形質に基づいて Past v. 3.21 を用いて主 成分分析を行った.さらに,全長を除く 6 計測形 質について,海域間での差異を確認するために, 全長を共変数として共分散分析を行った.主成分 分析には計測値を対数変換した数値を用いた.共 分散分析では,Orr et al.(2011)に従い,全長を 除く 6 形質は全長に対する 100 分率をアークサイ ン変換した数値を,全長は全体の平均および標準 偏差から求めた標準化変量を用いた.共分散分析 において海域間での有意差が認められた場合, Kruskal-Wallis 検定による多重比較を行い,Steel-Dwass 法で P 値を補正した.共分散分析および計 測 形 質 の 多 重 比 較 に は R v. 3.1.2(R Core Team, 2014)を用いた.なお,個体数が 4 個体と少ない 北海道太平洋岸は共分散分析および多重比較から 除いた. 結 果 mtDNA 解析 遺伝的解析に用いた 166 個体に ついて,COI の部分塩基配列 592 塩基対が決定さ れた.このうち,12 箇所に合計 14 通りの塩基置 換があった.個体数が 2 個体と少ない北海道太平 洋沿岸を除いて,4 海域におけるハプロタイプ数 は 2–10 の範囲であり,北海道日本海沿岸で最も 多かった(Table 1).ハプロタイプ多様度,塩基
Table 1. Genetic diversity indices of Beringraja pulchra from five sampling areas calculated from 592 bp of mitochondrial
COI gene
Sampling areas Abbreviations n H h π
Sea of Okhotsk, off Hokkaido OSH 39 8 0.7638 ± 0.0477 0.0026 ± 0.0018
Pacific Ocean, off Hokkaido POH 2 1 -
-Sea of Japan, off Hokkaido SJH 34 10 0.7950 ± 0.0568 0.0029 ± 0.0019
Sea of Japan, east coast of Korea and off Shimane SJW 28 2 0.2540 ± 0.0953 0.0004 ± 0.0006 Yellow Sea, west coast of Korea YSK 63 3 0.5509 ± 0.0528 0.0027 ± 0.0018
Total 166 12 0.7273 ± 0.0224 0.0031 ± 0.0020
n: number of individuals; H: number of haplotypes; h: haplotype diversity; π: nucleotide diversity.
Fig. 2. Haplotype network for Beringraja pulchra from
five sampling areas based on 592 bp of mitochondrial COI gene. Each circle represents a single haplotype. Circle size represents number of individuals. Each bar represents one substitution. The two sets of perpendicular bars along the branches indicate two substitutions. Letters with numerals indicate haplotype codes.
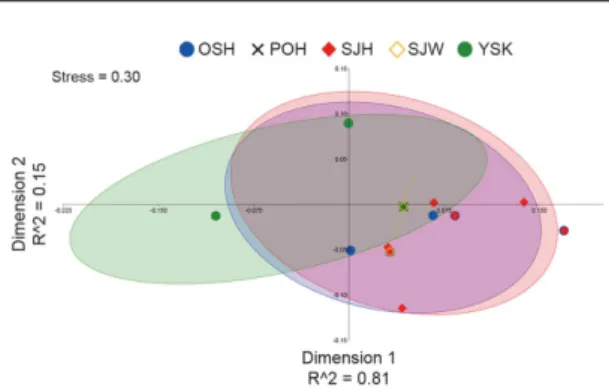
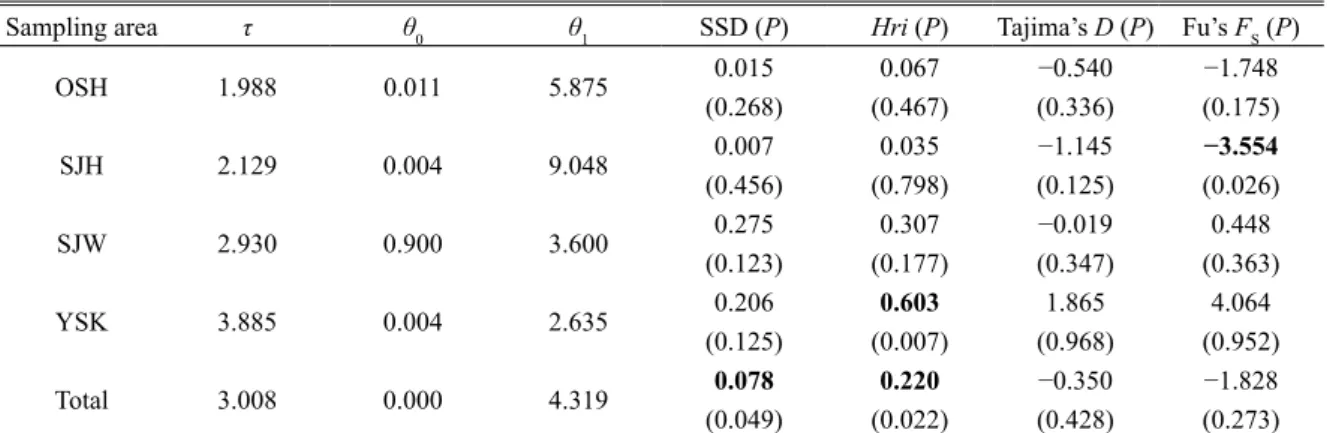
多様度ともに北海道日本海沿岸で最も高く,北海 道オホーツク海沿岸でもそれに近い値を示した. 一方,日本海西部ではハプロタイプ多様度,塩基 多様度ともに最も低い値であった(Table 1).得 られた 12 種類のハプロタイプのうち,6 種類は 複数の海域から確認され(Bp1–6),単一の海域 のみから確認された 6 種類のハプロタイプ(Bp7– 12) の う ち 4 種 類(Bp8,Bp10–12) は 1 個 体 の みが保有するシングルトンであった(Fig. 2).4 種類のシングルトンは北海道オホーツク海沿岸と 北海道日本海沿岸からのみ確認された.Bp1 には 本研究で扱った全 5 海域からの個体が確認された. また,Bp2 には黄海からの個体が最も多く確認さ れた.ハプロタイプネットワークは,Bp2 を除く と中心的なハプロタイプ(Bp1)の周囲にマイナー なハプロタイプがいくつかある星状に近い形状と なった. 海域間のペアワイズ ΦSTでは,黄海と解析に含 めた他の 3 海域全てとの間には 1% 水準で有意差 (ボンフェローニ補正後)が認められ,黄海と他 海域間の遺伝子流動が制限されていることが示唆 された(Table 2).さらに,日本海西部と北海道 オホーツク海沿岸および北海道日本海沿岸の間に も 5% 水準で有意差が認められた.一方,北海道 オホーツク海沿岸と北海道日本海沿岸の間には有 意差は認められなかった.また,多次元尺度構成 法を用いた結果では,各海域のプロットの範囲は 重複しており,とくに黄海を除く 4 海域はよくま とまっていた.そのなかで黄海はそれらの 4 海域 からプロットが部分的に分離しており,その異質 性が確認された(Fig. 3). ミスマッチ分布解析では,全解析個体を 1 集団 とした場合, 二峰型の分布を示した(Fig. 4a). そ れ ぞ れ の 海 域 で は, 北 海 道 日 本 海 沿 岸(Fig. 4c)と日本海西部(Fig. 4d)の 2 海域はいずれも 単峰型を示し,黄海(Fig. 4e)では明確な二峰型 の分布を示した.北海道オホーツク海沿岸(Fig. 4b)は置換数 2 の頻度がやや低いが,単峰型に近 い分布を示した.ピークの位置は日本海西部では 置換数 0,北海道オホーツク海沿岸と北海道日本 海沿岸の 2 海域では置換数 1–2 の範囲にあった. 黄海では置換数 0 と 3 の 2 箇所にピークをもって いた.また,SSD と Hri の値から,北海道オホー ツク海沿岸,北海道日本海沿岸,そして日本海西 部の 3 海域では,集団拡大モデルからの有意な逸 脱は確認されなかった(Table 3).一方,黄海で は Hri の値から,1% 水準で集団拡大モデルから の逸脱が確認された.集団動態に関するパラメー ターについて,τ 値は黄海で,θ0値は日本海西部 で,θ1値は北海道日本海沿岸でそれぞれ最も大き かった.Tajima s D の値は黄海を除き,負の値で あった(Table 3).また,Fu s FSの値は日本海西 部と黄海を除き負の値を示し,とくに北海道日本 海沿岸では 5% 水準で有意な値であった. 形態解析 形態解析に用いた標本の全長の範 囲,平均値,標準偏差は以下の通りであった:北 海道オホーツク海沿岸 336–1041mm(646 ± 177 mm),北海道太平洋沿岸 199–741 mm(547 ± 211 mm),北海道日本海沿岸 245–785 mm(434 ± 162 mm),日本海西部 420–978 mm(686 ± 175 mm), 黄海 336–1230 mm(614 ± 203 mm).メガネカス ベ 192 個体の 7 計測形質に基づいた主成分分析の 結果,第 1 主成分の寄与率は約 94% と高かった が,その因子負荷量は全ての形質で正の値であり,
Table 2. Pairwise ΦST values between sampling areas
(except POH) (below diagonal) and associated P values (above diagonal) of Beringraja pulchra based on 592 bp of mitochondrial COI gene
OSH SJH SJW YSK
OSH 0.999 0.046 0.001
SJH −0.015 0.050 0.001
SJW 0.077 0.065 0.001
YSK 0.329 0.337 0.524
Bold type indicates significant values (P < 0.05), after sequential Bonferroni correction.
Sampling area abbreviations given in Table 1 and Fig. 2. Fig. 3. Plots of first two components (Dimension 1 and 2) of multidimensional scaling (MDS) analysis for Beringraja pulchra from five sampling areas based on p-distance of 592 bp of mitochondrial COI gene. For each sample, 95% concentration ellipses illustrating the probabilistic distribution space of each sampling area are shown. Sampling area abbreviations given in Table 1 and Fig. 2.
Fig. 4. Mismatch distributions for Beringraja pulchra from four sampling areas (except POH), based
on 592 bp of mitochondrial COI gene. (a) Total, (b) Sea of Okhotsk, off Hokkaido (c) Sea of Japan, off Hokkaido (d) Western Sea of Japan, east coast of Korea and off Shimane (e) Yellow Sea, west coast of Korea.
Table 3. Mismatch distribution analysis and neutrality tests for Beringraja pulchra from four sampling areas (except POH)
based on 592 bp of mitochondrial COI gene
Sampling area τ θ0 θ1 SSD (P) Hri (P) Tajima’s D (P) Fu’s FS (P)
OSH 1.988 0.011 5.875 0.015 0.067 −0.540 −1.748 (0.268) (0.467) (0.336) (0.175) SJH 2.129 0.004 9.048 0.007 0.035 −1.145 −3.554 (0.456) (0.798) (0.125) (0.026) SJW 2.930 0.900 3.600 0.275 0.307 −0.019 0.448 (0.123) (0.177) (0.347) (0.363) YSK 3.885 0.004 2.635 (0.125)0.206 (0.007)0.603 (0.968)1.865 (0.952)4.064 Total 3.008 0.000 4.319 (0.049)0.078 (0.022)0.220 (0.428)−0.350 −1.828(0.273) τ: units of mutational time; θ0: population size before expansion; θ1: population size after expansion.
Fit between the observed and expected distributions was tested using the sum of squared deviations (SSD) and Harpending’s rag-gedness index (Hri).
Sampling area abbreviations given in Table 1 and Fig. 2. Bold type indicates significant values (P < 0.05).
これらはサイズ要素を含むものであると考えられ た(Table 4).一方,第 2 主成分の寄与率は約 5% で,因子負荷量は眼径で著しく高かった.また, 第 3,第 4 主成分の寄与率は 0.5% 未満と低い値 であった.主成分分析においては,5 海域間で明 確に分離されることはなかったが,第 2 主成分に おいて海域ごとにまとまる傾向がみられ,北海道 オホーツク海沿岸・北海道太平洋沿岸・北海道日 本海沿岸と日本海西部,そして黄海の 3 グループ に分離する傾向がみられた(Fig. 5). 海域間の形態的な差異について,個体数が 4 個 体と少ない北海道太平洋沿岸を除く 4 海域の標本 で共分散分析を行った結果,全長を除く 6 計測形 質のうち体盤長・体盤幅・眼径(の切片)におい て,1% 水準で海域間での有意差が認められた. これら 3 形質と全長の関係を Fig. 6 に示した.体 盤長(Fig. 6a)は,体盤幅(Fig. 6b)や眼径(Fig. 6c)の場合と比較してプロットの重複が多かった が,北海道オホーツク海沿岸および北海道日本海 沿岸の個体では大きく,日本海西部と黄海の個体 では小さい傾向がみられた(Kruskal-Wallis 検定 による多重比較で P < 0.01).また,体盤幅(Fig. 6b)は,日本海西部の個体では小さく,北海道オ ホーツク海沿岸,北海道日本海沿岸,および黄海 の個体では大きいことから,プロットが分離する 傾向がみられた(同様の多重比較で P < 0.01).と くに,眼径(Fig. 6c)は,各海域のプロットの重 複が少なく,日本海西部の個体では大きく,北海 道オホーツク海沿岸および北海道日本海沿岸の個 体では中間的,黄海の個体では小さい傾向がみら れた(同様の多重比較で P < 0.01). 考 察 集団構造 本研究では,北海道周辺(オホーツ ク海,太平洋,および日本海),日本海西部,黄 海のメガネカスベ集団が遺伝的に区別され,形態 的にもこれらの海域の集団ごとに差異がみられた. このなかでもとくに,黄海集団は遺伝的にも形態 的にも他の 2 集団からの分化が顕著であった. 黄海集団の分化について,対馬暖流の温暖な水 温が他の集団との交流を妨げる障壁となっている
Fig. 5. Plots of principal component (PC) scores for Beringraja pulchra from five sampling areas,
based on seven measurements. Sampling area abbreviations given in Table 1 and Fig. 2.
PC1 PC2 PC3 PC4
Total length 0.399 -0.104 0.402 0.039 Disc length 0.390 -0.109 0.122 0.263 Disc width 0.374 -0.186 0.350 0.091 Preorbital snout length 0.403 -0.106 -0.008 -0.862 Eye diameter 0.265 0.958 0.091 0.009 Preoral snout length 0.377 -0.023 -0.824 0.046 Pretail length 0.418 -0.117 -0.117 0.421 Eigenvalue 0.129 0.005 0.001 0.000 Contribution rate (%) 95.265 3.800 0.435 0.328
Table 4. Factor loadings for principal component (PC)
analysis for Beringraja pulchra from five sampling areas based on seven measurements
可能性が考えられた.黄海と日本海を隔てる対馬 海峡は対馬暖流の流路であり,その周辺海域にお いて,1985 年から 2010 年までの 100 m 深におけ る平均水温は 2,5,8,11 月のいずれの時期にお いてもおおむね 15˚C 以上を保っていた(気象庁, 2018).一方,メガネカスベは冷水温を好み,こ れまでに知られている平均的な生息水温はサハリ ン西岸で 1.1˚C(Antonenko et al., 2011),韓国の黄 海沿岸で 8.8˚C(Jang et al., 2014),韓国の日本海 沿岸では 12.2˚C(Im et al., 2017) とされている. さらに,本研究で用いた北海道オホーツク海沿岸 の標本は,底水温 1.0–5.7˚C の範囲(平均 3.5˚C, 標準偏差 1.3˚C)から採集されている.また,黄 海における標識放流の結果からも,韓国の黄海南 部に位置する黒山島より南方に回遊する個体は確
認されていないことから(Im and Jo, 2015),黄海 集団が対馬暖流を横断して日本海側に侵入するこ と は ほ と ん ど な い と 考 え ら れ て い る(Im et al., 2017).このように,対馬暖流によって黄海と日 本海の間で集団の分断や,種の分布域が制限され ると示唆される例は,マダラ Gadus macrocephalus の集団構造(Gwak and Nakayama, 2011), イカナ ゴ Ammodytes japonicus とオオイカナゴ Ammodytes heian の朝鮮半島沿岸における分布パターン(Han et al., 2012;Kim et al., 2015;Orr et al., 2015)など, 他の魚類でも知られている. 日本海西部集団の分化については,朝鮮半島東 岸における複雑な海流と,本種の日本海西部にお ける局所的な分布パターンが影響していると考え られた.日本海西部では対馬暖流,リマン海流, 北鮮海流が複雑に流れており,特に朝鮮半島東岸 の魚類相を特徴付けている(Kafanov et al., 2000). 本研究における日本海西部集団は主に韓国の鬱陵 島付近から得られており,採集努力や現地の水産 関係者への聞き取りを行ったが,対馬暖流の影響 を強く受ける北海道以南の本州日本海沿岸で本研 究をとおして確認された個体は非常に少ない[島 根県沖(1 個体,FAKU 142782),兵庫県沖(5 個体, FAKU 131487),富山湾(1 個体,証拠標本なし)]. また,近年,河野ほか(2011, 2014)などによっ て日本海産の魚類目録がまとめられており,本種 は山口県,鳥取県,石川県,青森県の出現種リス トに含まれているが,証拠標本に基づいた確かな 記録が欠けているため,確かな出現状況について は再検討の余地がある.さらに,ロシアのピーター 大帝湾周辺の沿海州南部でも本種の出現は稀であ るとされている(Antonenko et al., 2011;Panchenko and Boiko, 2015).なお,日本海西部集団は遺伝的 分化(Table 2,Fig. 3)に対して形態的分化(Figs. 5–6)が顕著であり,COI 領域にみられた遺伝的 変異と形態的変異の間には部分的な不一致と考え られる点もみられた.ガンギエイ目魚類において は,生息環境に適応するために,遺伝的な変異を 伴わず,表現型や生理的な変化が生じる例が大西 洋のガンギエイ科の Leucoraja ocellata で知られて いる(Kelly and Hanson, 2013;Lighten et al., 2016). 上述のように,日本海西部集団は他の集団よりも やや水温の高い海域に生息しているため,今後, 水温などの環境要因が本種の形態に与える影響や, mtDNA の異なる領域を調査することでこの不一 致についての要因を把握することが必要である. 北海道沿岸ではオホーツク海,太平洋,および
Fig. 6. Plots of proportional morphometric characters (as
% of total length) of Beringraja pulchra, which differed significantly among four sampling areas (except POH) in ANCOVA. (a) disc length, (b) disc width, (c) eye diameter. Sampling area abbreviations given in Table 1 and Fig. 2.
日本海の 3 海域間で遺伝的な分化は認められず, 形態的にも 3 海域で類似していた.北海道太平洋 沿岸は解析に用いたサンプルが少なく,詳細な比 較に含められなかったが,確認されたハプロタイ プは全て中心的なハプロタイプ[Fig. 2(Bp1)] であること,形態解析の主成分分析における第 2 主成分の得点が北海道オホーツク海沿岸および北 海道日本海沿岸と近いことから(Fig. 5),遺伝的・ 形態的にこれら 2 海域の個体と同じ北海道集団に 属すると考えられた.オホーツク海と日本海は狭 く浅い(最大水深約 60 m)宗谷海峡で接続され ている.そのため,ノロゲンゲ Bothrocara hollandi やマツバラゲンゲ Lycodes matsubarai,アバチャン Crystallichthys matsushimae などの深海性もしくは やや深場に生息する魚類では集団の分化が生じて いる例が知られる(Kodama et al., 2008;Sakuma et al., 2014;Tohkairin et al., 2016). し か し, 本 種 は 北海道沿岸では水深 5 m 程度の浅い海域にも出現 し,稚内沖では水深 10–60 m が主漁場であること から(前田,2003),宗谷海峡は本種にとって明 確な障壁として機能していないと考えられる.同 様に,太平洋と日本海の間の津軽海峡(最大水深 約 150 m)やオホーツク海と太平洋の間の千島列 島の浅海部も,本種の移動を妨げる要因とはなら ないと考えられる. 集団動態 本研究において,いずれの海域にお いても,メガネカスベではハプロタイプ多様度に 対して塩基多様度が低いことが確認された.一般 的に,軟骨魚類では mtDNA の塩基置換速度が遅 いことから(Martin et al., 1992;Martin, 1999),と くに塩基多様度は他の硬骨魚類よりも低くなりや すいと考えられる.集団レベルでは,黄海集団の ミスマッチ分布図はボトルネック型もしくは二次 的接触型の分布を示した(Fig. 4e).とくに,北 海道集団にみられるようなマイナーなハプロタイ プが存在せず(Fig. 2),塩基多様度に対してハプ ロタイプ多様度が低いこと(Table 1),さらに集 団 拡 大 モ デ ル か ら の 有 意 な 逸 脱 が 確 認 さ れ た (Table 3)ことからも,ボトルネックの影響が示 唆された.実際,黄海は平均水深が 50 m 程度と 浅く,最終氷期において海水準が低下した際には 大 部 分 が 陸 化 し た と 考 え ら れ る た め(Wang, 1999),生息域が減少したと推測される.一方, 形態的には北海道集団と明確に異なる(Figs. 5, 6) ものの,ハプロタイプネットワークは北海道集団 とも高い頻度でハプロタイプを共有するダンベル 型に近い構造[Fig. 2(Bp1,Bp2)]を示したこと から,北海道集団あるいは同じハプロタイプをも つ日本海西部集団との二次的接触の影響も考えら れる.今後,mtDNA とは異なる遺伝様式をもつ 核ゲノムを調査することで,より詳細な集団動態 の把握が期待できる. 日本海西部集団は遺伝的多様性が極めて低く (Table 1),ミスマッチ分布図もボトルネック型の 分布(Fig. 4d)を示したことから,ボトルネック を経験したことによる遺伝的多様性の低下も考え られた.一方,集団拡大モデルからの有意な逸脱 は確認されず,Tajima s D と Fu s FSにおいても集 団サイズの縮小は示唆されなかった(Table 3). 日本海は最終氷期において外海から孤立し,外部 からの海水流入がほぼ停止し,大陸から流入した 淡水による成層化によって深海域の無酸素化と, それに伴う深海生物の衰退があったとされる(Oba et al., 1991;Tada et al., 1999;小島ほか,2007;甲斐, 2018).しかし,本種は浅海域に分布するため, このような日本海における環境変化の影響は比較 的少なかったと考えられる.一方,日本海西部集 団は θ1値が北海道集団よりも小さく(Table 3), この遺伝的多様性の低さは集団成立後も比較的小 さな集団サイズを維持してきたことに起因する可 能性が考えられた. これは先述の Kafanov et al. (2000)が朝鮮半島東岸の比較的狭い海域に周辺 海域から区別可能な魚類相がみられるとしている こととも一致し,温暖な対馬暖流によって分布域 が制限されていることが示唆される. 北海道沿岸におけるオホーツク海と太平洋,お よび日本海から構成される北海道集団は遺伝的多 様性と θ1値の高さから,他の集団よりも集団サ イズが大きいと推定された(Tables 1, 3).このこ とは,本種の主要な漁場が北海道周辺であること (前田,2003)とも一致すると考えられる.また, ミスマッチ分布図が安定型(もしくは指数増加型) の分布(Fig. 4b, c)を示したことや,集団拡大モ デルからの逸脱は認められなかったことから(Table 3),北海道集団の過去の集団拡大が示唆された. とくに,北海道日本海沿岸では Fu s FSが有意に 負の値であったことからも過去の集団拡大が支持 された(Table 3).これらのことから,北海道集 団は安定した集団を維持してきており,北海道周 辺海域も本種の生息に適した環境を維持してきた と考えられた.なお,これまでガンギエイ科魚類 の COI 領域における塩基置換速度は推定されて おらず,本研究では集団拡大年代について推定す ることができなかった.今後,集団拡大年代を推
定することによって,この集団形成過程について の詳細が明らかになることが期待できる. 管理・保全単位 多くの水産生物は産卵場所や 時期,成長,回遊などの生活史が地域集団ごとに 異なり,同種内であっても独立した資源変動を示 すことから,そのような地域集団に従って管理単 位(management unit:MU) が 設 定 さ れ て お り, この管理単位の識別には分子遺伝学的手法も用い られている(Carvalho and Hauser, 1994;Begg et al., 1999;Palsbøll et al., 2006;Pope et al., 2010).また, 保全分野では遺伝的に分化した種内集団における 単系統群は進化的重要単位(ESU)と呼ばれ,個 別の遺伝的管理が必要であるとされる(Moritz, 1994;Fraser and Bernatchez, 2001).この管理単位 や進化的重要単位においては現在の遺伝的集団構 造だけでなく,過去の集団形成史も重要であると される(Moritz, 1994;Palsbøll et al., 2006).また, 種の過去の分布変遷や適応を反映した遺伝的多様 性は一度失われると回復できないため,注意が必 要である(Moritz, 2002).軟骨魚類においても, 漁獲もしくは混獲などの影響による個体数の減少 に対して,近年では遺伝的な集団構造に基づいて 保全単位を設定することが望ましいとされている (Domingues et al., 2018). 本種の場合,遺伝的・形態的に北海道集団,日 本海西部集団,黄海集団の 3 集団の存在が示唆さ れ,これらを区別して管理・保全を行う必要があ ると考えられる.さらに,管理・保全単位を集団 遺伝学的手法から決定する場合,上述のように, 現在の集団構造だけでなく集団の歴史的背景を把 握することも重要である.本研究におけるメガネ カスベの場合,ミスマッチ分布解析からこれら 3 集団は集団形成史も異なっていることが示唆され, この点からも本種の保全活動はこれら 3 集団を区 別して行う必要がある.日本では,主に本種を漁 獲しているのは北海道のみで,現在のところ新た に管理・保全単位を設定する必要はないと考えら れた.しかし,日本における本種の漁獲量や生物 学的な知見はほとんどなく,今後の管理・保全活 動のためにも資源状態のモニタリングや生態につ いての理解が必要であろう.一方,本種を積極的 に漁獲・利用している韓国の沿岸では,日本海沿 岸と黄海沿岸で異なる集団が出現するため,Im et al.(2017)で指摘されているように,2 つの集団 を区別して管理・保全を行う必要がある.本種の ように遺伝的多様性の低い種において,漁業はそ の種の進化的潜在能力に対して長期的な影響を与
えるとされる(Pinsky and Palumbi, 2014).韓国に おいては本種の漁獲量が多く,とくに遺伝的多様 性が低い,もしくは集団サイズ減少の痕跡が残る 日本海西部集団と黄海集団は過剰な漁獲によって 遺伝的多様性の崩壊の恐れもあるため,慎重な対 応が求められる. 謝 辞 本研究を進めるにあたり,サンプルの採取にご 協力頂いた第五開洋丸(海洋エンジニアリング) の船長ならびに乗組員の皆様,北海道区水産研究 所の山下夕帆氏,京都府海洋センターの東海林 明氏,島根県水産技術センターの向井哲也氏に厚 く御礼申し上げる.また,標本調査などにご協力 頂いた遠藤広光氏,内藤大河氏,水町海斗氏(高 知大学理工学部),矢部 衞氏,今村 央氏,河 合俊郎氏(北海道大学水産学部),松浦啓一氏, 篠原現人氏,中江雅典氏(国立科学博物館動物研 究部)に心より感謝の意を表する.なお,本研究 の一部は,水産庁委託「我が国周辺水域漁業資源 調査・資源評価対象事業」(ズワイガニオホーツ ク海系群等,底魚類資源調査)により実施された. 引 用 文 献 尼岡邦夫・仲谷一宏・矢部 衞.2011.北海道の全 魚類図鑑.北海道新聞社,札幌.482 pp.
Antonenko, D, V., S. F. Solomatov, A. A. Balanov, K. S. Tok and P. V. Kalchugin. 2011. Occurrence of skate Raja pulchra (Rajidae, Rajiformes) in Russian waters of the Sea of Japan. J. Ichthyol., 51: 426–431.
Begg, G. A., K. D. Friedland and J. B. Pearce. 1999. Stock identification and its role in stock assessment and fisheries management: an overview. Fish. Res., 43: 1–8. Brander, K. 1981. Disappearance of common skate Raia
batis from Irish Sea. Nature, 290: 48–49.
Cariani, A., S. Messinetti, A. Ferrari, M. Arculeo, J. J. Bonello, L. Bonnici, R. Cannas, P. Carbonara, A. Cau, C. Charilaou, N. E. Ouamari, F. Fiorentino, M. C. Follesa, G. Garofalo, D. Golani, I. Guarniero, R. Hanner, F. Hemida, O. Kada, S. L. Brutto, C. Mancusi, G. Morey, P. J. Schembri, F. Serena, L. Sion, M. Stagioni, A. Tursi, N. Vrgoc, D. Steinke and F. Tinti. 2017. Improving the conservation of Mediterranean chondrichthyans: The Elasmomed DNA barcode reference library. PLoS ONE, 12: e0170244.
Carvalho, G. R. and L. Hauser. 1994. Molecular genetics and the stock concept in fisheries. Rev. Fish. Biol. Fish., 4: 326–350.
Chevolot, M., G. Hoarau, A. D. Rijnsdorp, W. T. Stam and J. L. Olsen. 2006. Phylogeography and population structure of thornback rays (Raja clavata L., Rajidae). Mol. Ecol., 15: 3693–3705.
Domingues, R. R., A. W. S. Hilsdorf, and O. B. F. Gadig. 2018. The importance of considering genetic diversity in shark and ray conservation policies. Conserv. Genet., 19: 501–525.
Dulvy, N. K., J. D. Metcalfe, J. Glanville, M. G. Pawson and J. D. Reynolds. 2000. Fishery stability, local extinctions, and shifts in community structure in skates. Conserv. Biol., 14: 283–293.
Excoffier, L. and H. E. L. Lischer. 2010. Arlequin suite ver. 3.5: a new series of programs to perform population genetics analyses under Linux and Windows. Mol. Ecol. Res., 10: 564–567.
Ferrari, A., F. Tinti, V. B. Maresca, A. Velonà, R. Cannas, I. Thasitis, F. O. Costa, M. C. Follesa, D. Golani, F. Hemida, S. J. Helyar, C. Mancusi, A. Mulas, F. Serena, L. Sion, M. Stagioni and A. Cariani. 2018. Natural history and molecular evolution of demersal Mediterranean sharks and skates inferred by comparative phylogeographic and demographic analyses. Peer J., 6: e5560.
Fraser, D. J. and L. Bernatchez. 2001. Adaptive evolutionary conservation: towards a unified concept for defining conservation units. Mol. Ecol., 10: 2741–2752. Fu, Y. W. 1997. Statistical tests of neutrality of mutations
against population growth, hitchhiking and background selection. Genetics, 147: 915–925.
Griffiths, A. M., D. W. Sims, S. P. Cotterell, A. E. Nagar, J. R. Ellis, A. Lynghammar, M. McHugh, F. C. Neat, N. G. Pade, N. Queiroz, B. S. Pereira, T. Rapp, V. J. Wearmouth and M. J. Genner. 2010. Molecular markers reveal spatially segregated cryptic species in a critically endangered fish, the common skate (Dipturus batis). Proc. R. Soc. B, 277: 1497–1503.
Griffiths, A. M., D. W. Sims, A. Johnson, A. Lynghammar, M. McHugh, T. Bakken and M. J. Genner. 2011. Levels of connectivity between longnose skate (Dipturus oxyrinchus) in the Mediterranean Sea and the north-eastern Atlantic Ocean. Conserv. Genet., 12: 577–582. Gwak, W. S. and K. Nakayama. 2011. Genetic variation
and population structure of the Pacific cod Gadus macrocephalus in Korean waters revealed by mtDNA and msDNA markers. Fish. Sci., 77: 945–952.
Hall, T. A. 1999. BioEdit: a user-friendly biological sequence alignment editor and analysis program for Windows 95/98/NT. Nucl. Acids Symp. Ser., 41: 95–98. Hammer, Ø., D. A. T. Harper, P. D. Ryan. 2001. Past:
Paleontological statistics software package for education and data analysis. Palaeontologia Electronica, 4: 403– 417.
Han, Z., T. Yanagimoto, Y. Zhang and T. Gao. 2012. Phylogeography study of Ammodytes personatus in
Northwestern Pacific: Pleistocene isolation, temperature and current conducted secondary contact. PLoS ONE, 7: e37425.
波戸岡清峰・山田梅芳・藍澤正宏・山口敦子・柳 下直己.2013.ガンギエイ目.中坊徹次(編), pp. 205–216,1771–1773.日本産魚類検索 全種の 同定.第 3 版.東海大学出版会,秦野.
Im, Y. J. and H. S. Jo. 2015. Migration and growth rate of mottled skate, Beringraja pulchra by the tagging release program in the Yellow Sea, Korea. J. Kor. Soc. Fish. Tech., 51: 227–234.
Im, Y. J., H. S. Jo, H. S. Ji, S. H. Myoung and J. K. Kim. 2017. Geographic variations of the mottled skate, Beringraja pulchra (Liu, 1932) (Rajidae) in the Yellow and East seas based on molecular and morphometric data. J. Appl. Ichthyol., 33: 950–956.
Ishihara, H., M. Treloar, P. H. F. Bor, H. Senou and C. H. Jeong. 2012. The comparative morphology of skate egg capsule. Bull. Kanagawa Prefect. Mus., 41: 9–25. Ishihara, H., Y. Wang, S. Tanaka, K. Nakaya and C. H.
Jeong. 2009. Beringraja pulchra. The IUCN Red List of Threatened Species 2009. Ver. 3.1. http://www. iucnredlist.org.(参照 2018-7-28).
Ishiyama, R. 1958. Studies on the rajid fishes (Rajidae) found in the waters around Japan. J. Shimonoseki Coll. Fish., 7: 193–394, pls. 1–3.
Ishiyama, R. 1967. Fauna Japonica. Rajidae (Pisces), vi+82 pp., 32 pls. Biogeographical Society of Japan, Tokyo. Jang, M. H., H. S. Jo, D. H. Kweon, B. Y. Cha, J. H.
Hwang, K. N. Han and Y. J. Im. 2014. Geographical distribution and catch fluctuations of mottled skate, Beringraja pulchra in the eastern Yellow Sea. Korean J. Ichthyol., 11: 198–210.
鄭 忠勲.2018.ガンギエイ目.中坊徹次(編),pp. 46–51.小学館の図鑑 Z 日本魚類館 精緻な写真 と詳しい解説.小学館,東京.
Jo, H. S., H. J. Hwang, D. H. Kwon, G. S. Jeong, K. H. Choi, B. Y. Cha and Y. J. Im. 2011. Fishing characters of skate ray, Raja pulchra by the offshore longline fishery in Heuksan-do, Korea. J. Kor. Soc. Fish. Tech., 47: 403– 410.
Kafanov, A. I., I. G. Volvenko, V. V. Fedorov and D. L. Pitruk. 2000. Ichthyofaunistic biogeography of the Japan (East) Sea. J. Biogeogr., 27: 915–933.
甲斐嘉晃.2018.日本海の魚類相―海水魚.日本 魚類学会(編),pp. 190–191. 魚類学の百科事典. 丸善出版,東京.
Kang, H. W., Y. R. Jo, D. Y. Kang, G. S. Jeong and H. S. Jo. 2013. Spawning characteristics and artificial hatching of female mottled skate, Beringraja pulchra in the west coast of Korea. Dev. Reprod. 17: 247–255.
環境省.2017.環境省版海洋生物レッドリストの 公 表 に つ い て.http://www.env.go.jp/press/103813. html.(参照 2018-11-12).
類目録(予報).山口県水産研究センター研究報 告,9: 65–94. 河野光久・三宅博哉・星野 昇・伊藤欣吾・山中 智之・甲本亮太・忠鉢孝明・安澤 弥・池田 怜・ 大慶則之・木下仁徳・児玉晃治・手賀太郎・山 崎 惇・森 俊郎・長濱達章・大谷徹也・山田 英明・村山達朗・安藤朗彦・甲斐修也・土井啓行・ 杉山秀樹・飯田新二・船木信一 . 2014. 日本海産 魚類目録 . 山口県水産研究センター研究報告 , 11: 1–30.
Kelly, J. T., and J. M. Hanson. 2013. Maturity, size at age and predator-prey relationships of winter skate Leucoraja ocellata in the southern Gulf of St Lawrence: potentially an undescribed endemic facing extirpation. J. Fish Biol., 82: 959–978.
Kim, J. J., S. J. Lee, W. C. Lee, J. B. Kim and H. C. Kim. 2015. Restricted separation of the spawning areas for the two lineages of sand lance, Ammodytes personatus (Pisces, Ammodytidae) in the Yellow and East Seas and taxonomic implications. Biochem. Syst. Ecol., 61: 319– 328.
気象庁.2018.対馬暖流とは.https://www.data.jma. go.jp/kaiyou/data/db/maizuru/knowledge/tsushima_ current.html#fig2.2.4-2.(参照 2018-8-15).
Kodama, Y., T. Yanagimoto, G. Shinohara, I. Hayashi and S. Kojima. 2008. Deviation age of a deep-sea demersal fish, Bothrocara hollandi, between the Japan Sea and the Okhotsk Sea. Mol. Phylogenet. Evol., 49: 682–687. 小池裕子・松井正文.2003.保全遺伝学.東京大
学出版会,東京.299 pp.
小島茂明・足立健郎・児玉安見.2007.日本海に おける深海生物相形成と海洋環境変動―深海性 底魚を例として―.化石,82: 67–71.
Larkin, M. A., G. Blackshields, N. P. Brown, R. Chenna, P. A. McGettigan, H. McWilliam, F. Valentin, I. M. Wallace, A. Wilm, R. Lopez, J. D. Thompson, T. J. Gibson and D. G. Higgins. 2007. Clustal W and Clustal X version 2.0. Bioinformatics, 23: 2947–2948.
Last, P. R., B. Séret, M. F. W. Stehmann, and S. Weigmann. 2016. Family Rajidae. Pages 204–363 in P. R. Last, W. T. White, M. R. de Carvalho, B. Séret, M. F. W. Stehmann and G. J. P. Naylor, eds. Rays of the world. CSIRO Publishing, Victoria.
Lighten, J., D. Incarnate, B. J. Ward, C. V. Oosterhout, I. Bradbury, M. Hanson, and P. Bentzen. 2016. Adaptive phenotypic response to climate enabled by epigenetics in a K-strategy species, the fish Leucoraja ocellata (Rajidae). R. Soc. Open Sci., 3: 160299.
前田圭司.2003.メガネカスベ.上田吉幸・前田 圭司・嶋田 宏・鷹見達也(編),pp. 52–53. 新 北のさかなたち.北海道新聞社,札幌.
Martin, A. P. 1999. Substitution rates of organelle and nuclear genes in sharks: implicating metabolic rate (again). Mol. Biol. Evol., 16: 996–1002.
Martin, A. P., G. J. P. Naylor, and S. R. Palumbi. 1992.
Rates of mitochondrial DNA evolution in sharks are slow compared with mammals. Nature, 357: 153–155. Moritz, C. 1994. Defining Evolutionarily Significant
Units for conservation. Trends Ecol. Evol., 9: 373–375. Moritz, C. 2002. Strategies to protect biological diversity
and evolutionary processes that sustain it. Syst. Biol., 51: 238–254.
中坊徹次(編).2013.日本産魚類検索 全種の同定. 第 3 版.東海大学出版会,秦野.xlix + 2431 p. Oba, T., M. Kato, H. Kitazato, I. Koizumi, A. Omura, T.
Sakai and T. Takayama. 1991. Paleoenvironmental changes in the Japan Sea during the last 85,000 years. Paleoceanography, 6: 499–518.
Orr, J. W., D. E. Stevenson, G. R. Hoff, I Spies and J. D. McEachran. 2011. Bathyraja panthera, a new species of skate (Rajidae: Arhynchobatinae) from the western Aleutian Islands, and resurrection of the subgenus Arctoraja Ishiyama. NOAA Prof. Pap. NMFS, 11: 1–50. Orr, J. W., S. Wildes, Y. Kai, N. Raring, T. Nakabo, O.
Katugin and J. Guyon. 2015. Systematics of North Pacific sand lances of the genus Ammodytes based on molecular and morphological evidence, with the description of a new species from Japan. Fish. Bull., 113: 129–156.
Palsbøll, P. J., M. Bérube and W. Allendorf. 2006. Identification of management units using population genetic data. Trends Ecol. Evol., 22: 11–16.
Panchenko, V. V. and M. I. Boiko. 2015. On discovery of the mottled skate Raja pulchra off the coast of Primorye (Sea of Japan). J. Ichthyol., 55: 747–749.
Pinsky, M. L., and S. R. Palumbi. 2014. Meta-analysis reveals lower genetic diversity in overfished populations. Mol. Ecol., 23: 29–39.
Pope, K. L., S. E. Lochmann and M. K. Young. 2010. Methods for assessing fish populations. Pages 325–351 in M. C. Quist and W. A. Hubert, eds. Inland fisheries management in North America, 3rd edn. American Fisheries Society, Maryland.
R Development Core Team. 2014. R: a language and environment for statistical computing. R Foundation for Statistical Computing, Vienna, Austria. https://www. r-project.org.
Rice, W. R. 1989. Analyzing tables of statistical tests. Evolution, 43: 223–225.
Rogers, A. R. and H. Harpending. 1992. Population growth makes waves in the distribution of pairwise genetic differenced. Mol. Biol. Evol., 9: 552–569.
Sakuma, K., Y. Ueda, T. Hamatsu and S. Kojima. 2014. Contrasting population histories of the deep-sea demersal fish, Lycodes matsubarai, in the Sea of Japan and the Sea of Okhotsk. Zool. Sci., 31: 375–382. Tada, R., T. Irino and I. Koizumi. 1999. Land-ocean
linkages over orbital and millennial timescales recorded in late Quaternary sediments of the Japan Sea. Paleoceanography, 14: 236–247.
Tajima, F. 1989. Statistical method for testing the neutral mutation hypothesis by DNA polymorphism. Genetics, 123: 585–595.
Tohkairin, A., Y. Kai, Y. Ueda, T. Hamatsu, M. Itoh and T. Nakabo. 2016. Genetic population structure of Crystallichthys matsushimae (Cottoidei: Liparidae) with comments on color variation. Ichthyol. Res., 63: 370– 381.
Vargas-Caro, C., C. Bustamante, M. B. Bennett and J. R. Ovenden. 2017. Towards sustainable fishery management for skates in South America: the genetic population structure of Zearaja chilensis and Dipturus trachyderma (Chondrichthyes, Rajiformes) in the south-east Pacific
Ocean. PLoS ONE, 12: e0172255.
Walker, P. A. and J. R. G. Hislop. 1998. Sensitive skates or resilient rays? Spatial and temporal shifts in ray species composition in the central and north-western North Sea between 1930 and the present day. J. Mar. Sci., 55: 392– 402.
Wang, P. 1999. Response of Western Pacific marginal seas to glacial cycles: paleoceanographic and sedimentological features. Mar. Geol., 156: 5–39.
Ward, R. D., T. S. Zemlak, B. H. Innes, P. R. Last and P. D. N. Hebert. 2005. DNA barcording Australia s fish species. Phil. Trans. R. Soc. B, 360: 1847–1857.