FATIGUE AND RESIDUAL STRESS IN CARBON STEEL
by
Koichi MITSUNAGA Yoshiomi OTSUKA Shigeru Doi
(Received October 31, 1977)
SYNOPSIS
It has been reported that the compressive residual stress in the surface is useful for im- provement of fatigue strength. In order to produce residual stress in the surface layer of specimens, the various surface treatments have been adopted. Whenever the residual stress is generated by the surface treatment, it is not possible to avoid the change of material properties in the surface layer such as work hardening and structural change.
Residual stress has been thought to be equivalent to mean stress. HowÅíver, it has been shown in the recent investigations that the residual stress varies during fatigue process. Accordingly, it is unsuitable to discuss the effect to fatigue strength with the value of the residual stress measured before the fatigue test. Hence 'the following investigations have conducted and are reported in this paper ;
(a) variation of residual stress during fatigue process,
(b) seperating rough!y the factor contributing to fatigue strength due to change of material properties in the surface•layer from factors contributing due to surface treatment, and (c) behavior of crack growth on the surface during fatigue process.
It was obtained that, in rotating bending test, the change of material properties in the surface layer of smooth, notched and cracked specimens contributed much more to fatigue strength in the tufftrid-surface-treatment.
1. INTRODUCTION
It has been reported that the compressive residual stress in the surface of specimen is effective as the fatigue strength of materials, but that the tensile residual stress is not, In order to produce the residual stress in the surface of specimens, the various surface treatments plastic working, heat treatment, chemical treatment, etc., have been adopted. Whenever the residual stress is generated by the surface treatments, it is not possible to avoid the change of material properties in the surface layer of specimens. Therefore, the improvement of fatigue strength of a surface- treated material is generally made by the interaction between the residual stress and change of material properties in the surfacei). From a point of view of the residual stress, there are many reports on the fatigue strength of materials2) and a few refer to the effect of the change of material properties, but few to the quantitative effects of the above-mentioned factors.
Accordingly, the authors made experimentaly researches into the rotating bending tests with the smooth, various notched and a cracked carbon steel specimens, S15C, with the tufftrid-surface treatment. It has been shown in the recent investigations3) that the residual stress varies during fatigue process and the behavior of residual stress in the surface layer depends on each surface treatment. Therefore, it is unsuitable to discuss the effects on fatigue strength of the initial value of residual stress before testing.
In the present paper, the authors report the results they obtained on the contribution due to the residual stress and that due to the change of material properties in the surface layer.
Further, the behaviors of growth of fatigue cracks on the surface of specimen are investigated.
-19-
2 MATERIAL and SPECIMENS
The material is a round steel bar of the following properties (Table 1).
Table 1. Mechanical propenies and chemical composition
mechanicalproperties chemicalcomposition yieldpointOs 32.9kglmi C O.17SO)6
tensilestrengthoB 44.2kg/mm2 si O.26%o
percentage
elongationq 40.7906, lh O.57%
g.eA2fs.teig:gb
69.2% P O.023906,
truetensile
strengthOT 1O3.5kg!mm2 s O.O13SO)6,
The specimens were turned from a round bar of dia. 22mm. Before turning, all bars were heated to 9050C for 30 min. and cooled in the air. The solid smooth specimens as shown at the full lines in Fig. 1 were prepared. The turning conditions were a cutting speed of 2m/min, feed of O.05 min/rev, and depth of cut of O.03 mm. The notch sizes of specimens, each with a diametrical circular hole, are the five varieties;" 2.0, "1.0, "O.8,Åë O.5 and " O.3. The form- factor in each specimen is given in Table 2, which is calculated by Ishibashi.i)
Smooth specimen ,
L-- . es -r st-
40 85
i:l
Notched specimen not-th
r-T-::1-T=--- - :- -':--M'T=".:-. Ishibashi
notched Notched
$peclrnen c[asifi-
cation slze
di2,enotch Ca) di2.0
ip1.Unotch Ca) Åë1,O
diO,8notch Ca) toO8
diO,5notch Cb) diO.5X3 diO,3notch Cb) ipO,3XL5
Table 2. Form factor
ip2.0 Åë1.0 ipO.8 ipO.5 ipO.3
Ishibashi 2.12 2.46 2.57 2.70 2.80
(a) Åqb)
Fig.1 specimens
After turning, all the smooth and notched solid specimens were grinded with emery paper from No. F to No. O/6 and polished with Cr203 powder and further electrolytic-polished about 20 pt in depth from the surface in order to eliminate the working layer. The cracked specimens were prepared by making a crack of about O.2 mm length at the root of notch•with radius O.15 mm.
All the smooth, notched and cracked specimens were again annealed in a vacuum to 6500C for an hour. These specimens were named "the annealed specimen". The trufftrided specimens were prepared by tufftrid-surface-treating on the smooth and notched specimens annealed. The conditions of this tufftrid-surface-treatment were given in Table 3. The treatment period was 10 minutes at a part of the ÅëO,3 notched and all the creacked specimens, but was 90 minutes at
the rest,
Table 3. Conditions of tufftrided treatment Heat
treatment
570Åé, 90min or 10min Water cooled Conposition of
tufftriding salt bath
KCN 45906
KCNO 45SO)6
NaFe(CN)6 O.05SO)6,
Further, the tubular specimens were prepared by making the thin wall cylinder from solid specimens as shown by the broken lines in Fig. 1. These specimens were maked in order to remove the macroscopic residual stress in the surface layer of specimens and to investigate only the contribution to fatigue strength due to change of material properties in.the surface layer.
The inside surface of tubular specimen was electrolytic-polished about 30pt in depth.
3. EXPERIMENTAL METHOD
3.1 Measurement of residual stress
Residual stress in the surface of specimen was measured by the X-ray stress measuring device.
Stress measurement was performed by using the sin2w method with Cr-Ka radiation. The diffraction peaks were determined by the half-value breadth method. The conditions of X-ray siress measurement were given in Table 4. In order to make accurate measurement, the follow- ing pretest was carried out : a smooth plate specimen, on the one side of surface of which')a strain gauge was stuck, was bent and the bending stress was measured by X-ray stress measurement on the other surface. (Fig. 2) The measured values were compared with those by the strain gauge method, The experimental results obtained in that way described above are shown in Fig. 3. The ordinates express the stresses (o. - o..) which subtracted the values of stress o.. in unstrained state from those o. in strained state by X-ray stress measurement. The abscissas are mechanical stresses oM calculating by E•E, where E is the modulus of elasticity and Åí is the strain measured by strain meter. It is clearly evident from the Figure that both values agree very well. During X-ray stress measuring, the specimen was covered with a thin lead plate having a square hole. A side of the hole was 1.5 and 3 mm in length. The former was used in the
" O.3 notched specimens tufftridtreated for 10 minutes and the cracked specimens, the latter in
the rest.
Table4. Conditions of X-Ray technique (pararell beam method)
CharacteristicX-Ray Cr-Ka
Diffractionplane (211)
Tubevoltage 30kV
Tubecurrent 8mA
Irradiatedarea o3,ol.5
2eScanningspeed 1"lmin
Chartspeed 20mm/min
Timeconstant 4,8
Measurementofpeakposition Half-valuemethod
Filter Vanadium
- 21 -
-L-.
NÅqr5 Åq{ll-
i06
40 4-Åë6
- -- Ri -- O- O,v)
E Å~
.eP 2o i9
EE/iiEll:.:, iitt r`) si3io
It ll 11 It lt lt Jt tt le 1,
ilT llT' O 'O aM(kg2iOrrnf) 30
ee : : :---:: :: : : :: :: --. --cLP
Fig. 3 Comparison with the
. mechanieal stress and
Fig.2 Test specimen to calibrate in the mesured by X-
X-Ray stress measurement Ray method
20
10
tttttt-
o 102030
3.2 Fatigue test
Fatigue test was done by the rotating bending tester of Ono's type, The speed of revolution was about 32oo r.p.m. The fatigue limits were dicided by drawing each of the S-N curve. The variation of residual stress in the surface was measured often in fatigue process, when the specimen was detached from the tester. In the " O,3 notched specimens, the occurence and the behavior of propagation of cracks on the surface in fatigue process were subsequently observed the metalic microscope.
4. RESULTS
4.1 Fatigue test
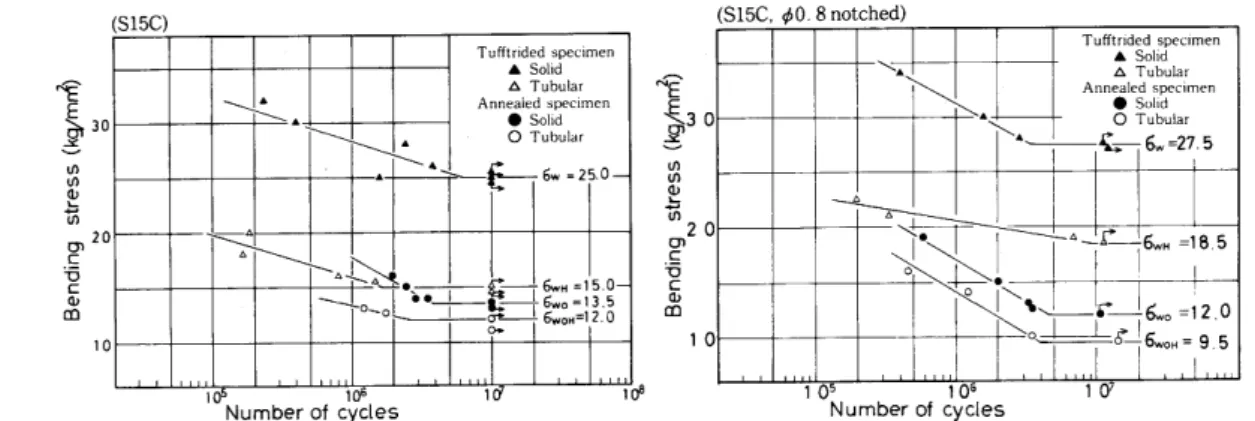
From Fig, 4 to 11 show each of the S-N curves of the annealed and the tufftrided specimens.
In the case of the tufftrided specimens the fatigue limits of the solid and the tubular specimens are represented by ow and owH, in the case of annealed specimens by owo and o"•oH,
"E Na"40E
5$ 9
-tA
boa!
fi
o[ an
20
(S15C).
tsi -r-h-s}-h-"LL-k 6N-38•O
AsA 2C
lo5 lo6 lo7
dw,=29.0
A
Åé Å~E
X30a
v-
ut ut
69
292o
,l
10
(S15C, di2.0notched)
Å~.
Tufftridedspecimen ASolid ATubular Annealedspec:men
eso]Ld OTubuinr xÅqi
xÅq.
e "t: 6w=29.0
'hs-.A
ANA
-e A
o
k 6wH=19.0
esoel.l . gi E;woH=10,56we=12,5,
lo5lo6Numberofcyctes 107 10B
Fig.4 S-N curve of smooth specimens Fig.5 S-N curve of notched specimens
t•"E
E b3o 5 ut ut o -L m 20 a .E v [ o m
10 (S15C)
-St.xi
Tufftridedspecimen ASolid ATubular Annealedspecimen
OSolid OTubular
i
.4 e6w-2s.o
Axli)S M-NLoso
..
ee
S.Ig,g":,,L.lig•
o.
1 06
(S15C, ipO. 8 notched)
N?
Åq3O vg
$
e.
ut2O
ge 8 10
xÅqi
x.
A
Tufftrided specimen A Solid A Tubular Annealed specimen O Sutid O Tubular ]C-s, 6.-27.5
)iiiÅr XkÅrtÅqr
A..-ilt-6., =18,5 1 i
SLr 6.,=12.oo-8rL! 6woH= 9.5
105 1
Number of cyctes Number of cycles06 107
Fig. 11 S-N curve of cracked specimens Fig.7 S-N curve of notched specimens
(S15C, diO. 5 notched)
tw?
g, ,
e
.ut H'L
g2 o
{
,IS
(S15C, ipO. 3 notchedO)
A
"E
53oE
iut co
os
ut 20 aE ci
om 10
TutTtrided speeirnen
A Solid A Tubular Annealed speeimen e so]id O Tubular
XA
] A x.
A A
len K.-Å~.
xKgo 1..
en oLl
r- 6. -26.0
"- (S.,-20 .0
-"- 6., =13.0 c
[
o- -6.oH=10,5 ,
10
i05Number o+"eyOc6 tes iO' Number of cyctes
-i A
N` ii ft (s,-2s.o
-"-'IN-
h
TufftridedspecimenoeA---A ASolid""'-'-t'-'
NgÅr-Åq
.iS"xi ,gtM 6wH=17,O
6woH`13.5 ATubuiar
Annea]edspecimen esolid OTubular
o oN.,1-
,Ft-6wo'15,O-
105106107
Fig.8 S-n curve of notched specimens Fig•9 S-N curve of notched specimens
(S15C,ipO.3notchedC)) (S15C, ip1.0notched) A
eyE )3 OE
uti
ut ot
ut 20 o.g
cv
om 10
'
Tufftrided speclmen
ASolid ATubular
XA Annealedspecl;nen
Soiid
o e
i oTubu]ar
Å~ i "
i 6.=25.5
A
ci
AXA dbo dwH=2lLO
o
e L
'-x-L-..
o 'rs=,sse,,.
s "-6..=15.0
oyge 6vvoH=13,5
o
,CIE'
gdg3o
t
s,
uto2 O
{
&
10
I Å~"sK.ix.
1
,'s-`. , , ; ?E;r rf l i"
L-t-- -n .- .
ii! A,1)N=1.r
6w'27.5
TufftAildesTdoutgdifaCr)Men ....oeXk-i;h.xe.. -r-6.,=19.0
Anneaied specimen 'e solid N'T ehNÅq e -
O Tubu]ar r
-r
/ /
OX .X 16..-i3.0
-
g
- --v8-6woH=10.0
i05Number of ciy02tes ity iOSNumber of e92tes iOil
Fig. 10 S-N curve of notched specimens Fig.6 S-N curve of notched specimens
- 23 -'
The increase of fatigue strength due to the tufftrid-surface-treatment is represented by Ao=ow -o... This increase is caused by the interaction of the residual stress and the change of material properties in the surface layer due to the surface-treatment. If the residual stress in the surface layer was perfectly removed by drilling the solid specimen, it is considered possible to take out only the contribution Aoq to fatigue strength due to the change of material properties in the surface layer. So the increase of fatigue strength of tubular specimen tufftrided, owH-owoH, is equivalent to the contribution due to the change of material properties in the surface layer and is represented by Aoq. But if the residual stress was not perfectly removed and a little left in the surface, it is not considered possible to take out that contribution. The increase of fatigue strength,opvH- owoH, includes a little effect of the residual stress in the surface and it is represented by Ao,'.
In the following we describe the results of fatigue tests in detai1 :
1) Smooth specimens
The fatigue limits and the increase of fatigue strength of each smooth specimen were as follows ;
orv =38.0 kg/mm2,owH =29.0 kg/mm2, owo = 21.5 kg/mm2, awHo= 20.5 kg/mm2, Ao =16.5 kg/mm2,Ao, = 8.5 kg/mm2,
By drilling the solid specimen tufftrided to the tubular specimen the residual stress in the
surface was removed from --24.2 kg/mm2 to -3.7 kg/mm2, therefore the residual stress was almost perfectly removed. So owH--orvHo = 8.5 kglmm2 is equivalent to Aoq.
2) " 2.0 notched specimens
The fatigue limits and increase of fatigue strength were as follows ;
ow =29.0 kg/mm2,owH =19.0 kglmm2, owo= 12.5 kg/mm2, owoH = 10.5 kg/mm2, Ao =16.5 kg/mm2,Ao, = 8.5 kg/mm2,
In this case, also, orvH-(pwoH = 8.5 kg/mm2 is equivalent to Aoq, because the residual stress was removed from -40.9 kg/mm2 to --4.2 kg/mm2 by drilling to tubular specimen.
3) e 1.0 notched specimens
The fatigue limits and the increase of fatigue strength were as follows :
ow = 27.5 kg/mm2 , owH = 19.0 kg/mm2 , owo = 13.0 kg/mm2, owoH = 10.0 kg/mm2, Ao =14.5 kg/mm2,Ao, = 9.0 kg/mm2.
Also in this case, owH -owHo = 9.0 kg/mm2 is equivalent to Aoq by the similar reason.
4) " O.8 notched specimens
The fatigue limits and the increase of fatigue strength were as follows ;
ow == 27,5 kg/mm2,uwH == 18.5 kg/mm2, owo = 12.0 kg/mm2, owoH= 9.5 kg/mm2, Ao =15.5 kg/mm2, Aa6 --- 9.0 kg/mm2.
By drilling the solid specimen tufftrided the residual stress in the surface was removed from -47.4 kg/mm2 to -13.2 kg/mm2. In this case the residual stress .was not perfectly removed.
Therefore, the increase of fatigue strength of tubular specimens due to the surface-treatment, owH-owoH =9.0 kg/mm2, includes slightly the value due to the influence of residual stress in the surface and so equivalent to Ao4.
5) Åë O.5 notched specimens
The fatigue limits and the increase of fatigue strength were as follows ;
orv = 26.0 kg/mm2,owH = 20.0 kg/mm2, owo = 13.0 kg/mm2, owoH= 10.5 kg/mm2, Aa =13.0 kg/mm2,Ao,' = 9.5 kg/mm2.
In this case also, the increase of fatigue strength of tubular specimen due to the surface- treatment, owH-owHo= 9.5 kg/mm2, includes the value due to the influence of residual stress by the similar reason.
6) - O.3 notched specimens (1)(tufftrid-treating at 5700C for 90 min.)
The fatigue limits and the increase of fatigue strength of each notched specimen (- O.3) tufftrid-treated at 5700C for 90 min. were as follows ;
ow =25.0 kg/mm2,owH =17.0 kg/mm2, owo = 15.0 kg/mm2, ouroH= 13.5 kg/mm2, Ao =10.0 kg/mm2',Ao6 -- 3,5 kg/mm2.
By drilling the solid specimen tufftrided to the tubular specimen, the residual stress is removed
from -32.0 kg/mm2 to -15.4 kg/mm2, therefore, owH-owoH = 3.5 kg/mm2 includes the value due to the considerable influence of residual stress.
7) " O.3 notchedJspecimens (2) (t.ufftrid-treating at 5700C for•10 min.) The fatigue limits and the increase of fatigue strength were as fbllows :
aw = 25 .0 kg/mm2 , owH = 21 .0 kg/mm2 , owo = 15.0 kg/mm2, owoH= 13.5 kg/mm2, Ao = 10.5 kg/mm2, Ao,' ---- 7.5 kg/mm2.
By drilling the solid specimen tufftrided to the tubular speciman, the residual stress i,s removed from -38.1 kg/mm2 to -11.0 kg/mm2, and so owH-owHo = 7.5 kg/mm2 correspond to Aoq'.
8) Cracked specimens (tufftrid-treating at 5700C for 10 min.)
ow =25.0 kg/mm2,orvH = 15.0 kg/mm2, owo :13.5 kg/mm2, owoH= 12.0 kg/mm2, Ao == 11.5 kg/mm2,Ao6 = 3.0 kg/mm2.
In the tubular specimen tufftrided the residual stress is -15,Okg/mm2 and in solid specimen tufftrided-36.2kg/mm2, so owH-owoH = 3.0 kg/mm2 includes th considerable effect of residual stress and correspond to Aoq'. The values of residual stresses in the solid and the tubular specimen cracked, which has been annealed, were about-11.0kg/mm2 and a little higher than those of the annealed specimens with a notch only.
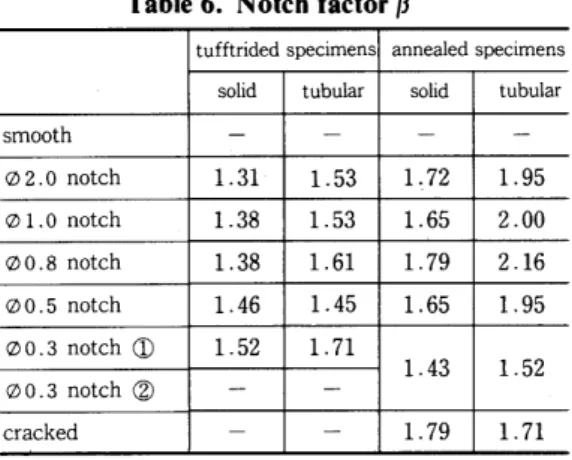
In the tufftrided and the annealed specimens the results of the fatigue strength and the fatigue notch factor are given in Table 5 and 6.
Table 5. Fatigue Strength Table 6. Notch factorB
tufftridedspecimens annealedspecimens
solid tubular solid tubulaf
smooth 38.0 29.0 21.5 20.5
Åë2.0notch 29.0 19.0 12.5 10.5
O1.0notch 27.5 19.0 13.0 10.0
ÅëO.'8notch 27.5 18.5 12.0 9.5
OO.5notch 26.0 13.0 13.0 10.5
Åëo.3notchCD 25.0 17.0
15.0 13.5
ÅëO.3notch@ 25.5 21.0
cracked 25.0 15.0 13.5 12.0
20.5 smooth
12.0 cracked kg/mm2
tufftridedspecimens annealedspecimens
solid tubular solid tubular
smooth - ' ' -
O2.0notch 1.31 1.53 1.72 1.95
O1.0notch 1.38 1.53 1.65 2.00
ÅëO.8notch 1.38 1.61 1.79 2.16
OO.5notch 1.46 1.45 1.65 1.95
Åëo.3notch(D 1.52 1.71 1.43
ÅëO.3notch@ - -
cracked - - 1.79 1.71
-25-
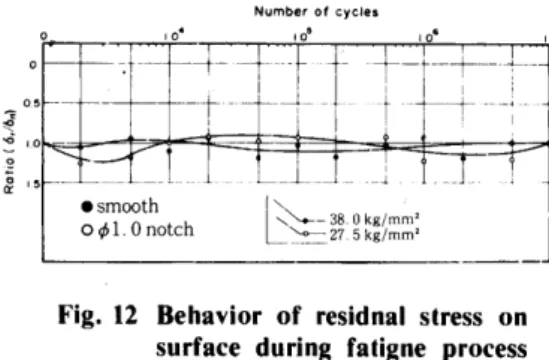
4.2 Behavior of the residuan stress in the surface in fatigue process'
Because the fatigue strength of material depends mainly on the condition of stress in the surface layer, the residual stress in the surface layer is considered to correspond to the effect of mean stress. While the material has received the repeated stress (or strain), the residual stress in the surface layer generally changes. Therefore we need to take account of the behavior of the residual stress in the surface layer in the fatigue process, in particular, the behavior at the amplitude of stress of the fatigue limit.
Fig. 12 shows the behavior of residual stress in the surface in fatigue process at the stress of the fatigue limit in a smooth a.nd a Åë 1.0 notched specimen. The ordinate axis indicates the ratio R of the residual stress o. in fatigue process to that.p,i before testing. In the following, R will be named briefly "a remaining ratio". The value of R becomes the important factor in order that the fatigue limit is estimated later.
3. 05 t- ,o :t
E ,s
Number of cycles
o io4 ioe 4o6 ioT
i-- ---H---
m-1".m
:S,M,08t.h.,,, txl'iijg::iM.,Mi
Fig. 12 Behavior of residnal stress on surface during fatigne process in tufftrided specimens
In the tufftrided specimens the residual stress in the surface can be considered nearly to be constant in fatigue process at the fatigue limit. But, generally, at the fatigue limit the residual stress in the surface decreases rapidly in the early part of fatigue process and is nearly constant during the most part of the subsequent process4)5).
In the annealed specimens the absolute value of residual stress in the surface is very small and at the fatigue limit there is not very much change of the residual stress in fatigue process.
Consequently the annealed specimens can be considered as the standard specimens in the fatigue
test4).
From Table 7 to 10 give the ,initial residual stress o,i in the surface of specimens and the remaining ratio R in each solid and tubular specimens, and in the tubular specimens give the change of residual stresses before and after making tubular specimen, too. The remaining ratio R was measured with nonbroken specimen after the stress amplitude was repeated more than 107 cycles.
In the solid and the tubular specimens annealed o,i and R were given in Table 7and 8.
These values of o,i were small with except of the annealed specimen with cracks. As for the annealed specimen with cracks it is necessary to consider the remaining ratio, because the compressive value of residual stress was larger than that of the other anneaied specimens.
In the solid and tubular specimens tufftrided o,i and R are given in Table 9 and 10. These values of o,i scatter from-50 kg/mm2 to-20kg/mm2 and they did little change after testing, therefore the remaining ratioR is nearly equal to 1.0.
Table7. Residual stress before testing and Fig.8• Residual stress before testing and remaining ratio in solid specimens reMaining ratio in annealed tubular .
annealed ' specimensorikg/mm2 R
smooth -O.7 .--.1.0
O2.0notch. -O.8 Z-1.0
Åë1.0notch -2.5 =-1.0
ÅëO.8notch -O.4 ---.1.0
OO.5notch -4.5 =-1.0
OO.3notch -O.4 Z-1.0
cracked -9.4"- O.6
t---.1.o i smooth
O.6 cracked
beforedrillingkglmm2 afterdrillingkglmm2 R
smooth -O.7 -O.5 1.0
Åë2.0notch -4.6 -3.7 1.0
O1.0notch -2.5 -O.7 1.0
OO.8notch -4.2 -5.0 1.0
OO.5notch - -O.2 1.0
OO.3notch -o.o -2.4 1.0
cracked -9.4 -9.4 1.0
Table9. Residual stress before testing and Table 10. Residual stress before testing and
r.emaining ratio solid specimens remaining ratio in tubular
turrtrided specimens tufftrided
orikg/mm2 R beforedrillingkg/mm2 afterdrillingkglmm2 R
smooth -24.7 1.0smooth -24.2 -3.7 -
O2.0notch -45.4 O.902.0notch -40.9 -4.2 -
O1.0notch -23.8 1.0•Åë1.0notch -23.8 -5.5 -
ÅëO.8notch -46.4 O.9oo.snotch -47.4 -13.2 O.9
ÅëO.5notch -49.0 '1.0OO.5notch -48.5 -34.4 1.0
oo.3notchO -32.0 1.2OO,3notch -32.0 -15.4 O.5
oo,3notch(l) -41.5 1.0OO.3notch -38.1 -11.0 3.0
cracked -35.6 1.4cracked -36.2 -15.0 O.6
In the tubular smooth specimen and the tubular specimen with a notch (dia. of a notch;
2.0 mm, 1,O mm) which were tufftrided, the residual stress in the surface layer was nearly perfectly removed. But, in the tubular specimens with a notch (dia. of a notch ; O.8 mm, O.5 mm, O.3 mm) and with micro-cracks which were tufftrided, the residual stresses in the surface layer were no't perfectly removed. Accordingly, the latter specimens yet include the value due to the influence of residual stress in the surface layer as before-mentioned. In the next chapter, we will eliminate the effect of residual stress in the surface layer and refer only to the contribution on fatigue strength due to the change of material properties in the surface layer of specimen.
4.3 Non-propagating crack Table ll. Strength of non-propagated crack
An existence of non-propagating cracks was checked at the notch-root of non-
broken specimens after the stress was SMOOth repeated more than 107 cycles. Then the 02•O notch limit of generation of non-propagating oi.onotch cracks- was found. The results are given Åëo.s notch
in Table ll• oo.s notch
' tufftridedspecimens annealedspecimens
solid tubular solid tubular
smooth
- - ' '
O2.0notch - - - -
O1.0notch
- - - -
ÅëO.8notch 27.5
- 11.0 -
OO.5notch 24.0 - 12.0 10.5
oo.3notch(D - - 10.0 11.0
Åëo.3notch(i) 24.0 19.0
cracked År13.0 År9.5 8.0 6.5
kg/mm2
-27-
4.4 Behavior of crack growth on the surface in fatigue process
Fig. 13 (a) and (b) show the behavior of crack growth on the surface during the fatigue testing in the annealed and the tufftrided solid specimen with a notch (dia. of notch ; O.3 mm).
Fig. 14(a) and (b) also show the behavior of crack growth at the ends of pre-cracks in the annealed and the tufftrided solid specimens with pre-cracks. In the pre-cracked specimens the length of propagating crack is the length from the end of pre-crack. As in these Figures the rate of growth of fatigue crack suddenly increases directly before breaking in the tufftrided specimens as comparison with in the annealed specimens.
?t 1,o
E
g
Fe x O,5 x
6
,/.,gll•'j ,/A
1/' . ,.x-.-. {E'o 1
]]7/tt:
e =I8.oto,dee A .16,O ig)fuK e =I5.5 tothK v .IS.O igni
as
-- O.5
'i!i
o9 /
`!
1
/
.
1
3e s
25
Å~"x.-
1pt N I07
A 6 =2 9t O k9/mm2 e 6 =27•O kp/..?
e 6=26•5 k9tfmtT?
l
/
i e ye2 !
-te=;S t=e----.-
1 a 3 4x(ts5 O 1 2 3 4xle6 5
Numer of cyctes Number of cycles
Fig.3(a) Behavior of crack growth in Fig.13(b) Behavior of erack grovvth in annealed specimen withanotch surface-treated specimen with (dia. of notch, O.3mm) a notch (dia. of notch, O.3mm)
'E i•o
5`
6S
-x-O.5
b8
1.0 s]o
15 x
/"' i,611)5a,Egg/."r,si'O' tll,, i,10i,iggg•:"ttlilEl•1 /'
-i5
s
U
Nu i /
r
,it .//l y i-e- . ISlyiSC--e.e--
1 2 3 4xlo6 5
Mmber of cycLes
1 2 3 Lxlo6 5
Number of cyctes
Fig. 14(b) Behavior of crack grovvth in
Fig. 14(a) Behavior of crack grovvth in surface-treated specimen with annealed specimen with precrack precrack
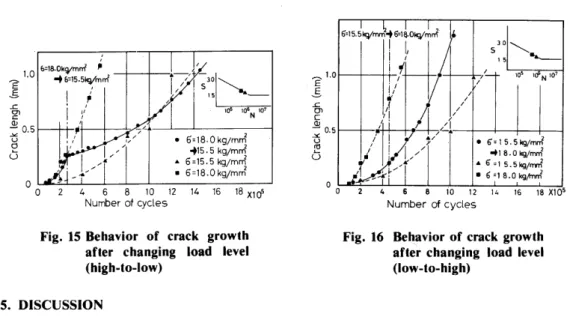
4.5 Behavior of grovvth of fatigue crack after changing load level
In the solid specimens with a notch (dia. of notch ; O.3 mm) which were annealed, both a high-to-low and a low-to-high change of load level were experimented in order to research the behavior of growth of fatigue crack at the root of notch. The results are shown in Fig. 15 and 16.
In the high-tb-low change the rate of growth of crack under high load level became temporarily slow after changing int6 the low level, and shifted gradually to the rate under the low load level (Fig. 15).
In the low-to-high change, on the other hand, the rate under the low level did not remain the same by changing into the high load level and the rate gradually shifted to that under the high
level.
1.0
3s
=9
- O,5o
ti
9
o
o
tl
V-18•OkglmrriP '-5:15•5kg,trmm2
xniv-13015/15
z
.zz
lo5lo6107N
ti
L..-
'6=18•Okglmm2
.,t.:::g,k&im/6e6=18.0kg/mm
A 1.0 EE
v`a[
- O.5o
-is LO
U
o
O 2 4 6 8 10 12 14 16 18 xlof O 2 4 6 e 10 12 14 16 ls XI05
Number of cycles Number of cydes
6=t5,5kg,(mmmm2S-S=18.0kglI!1if
30
S15Å~L
xj/i'7'17
4/
Z
lo51diNlo7
i/!l.--
`
1!!7p./ . '6:15•5nglmm2 -18•Onglrrvn2 A6;1s.5nglrTvn2 e6;1s.okgrtnK
Fig. 15 Behavior of crack grovvth Fig. 16 Behavior of crack grovvth
after changing load level afterchanging load level
(high-to-low) (low-to-high)
5. DISCUSSION
The relationships between the fatigue limit or the limit of generation of crack and the form factor in the tufftrided and the annealed solid specimens are shown in Fig. 17.
40
30NE
Å~.E
t
f=bO Q -O.20
8
&
lo
10
Q
o oeoutM
N '-o. .od . "e-e
o ee
+-p s,.1Se.,
e.
N
Q
o'oo-o.
ol ,•s-, I6h
v
Tufftnded specimen Q Smooth and notched O Smooth and notched(crack) v cracked
V cracked(crack)
Annealed specimen o Smooth and notched o Smooth and notched(crack) v cracked
v cracked(crack)
1,O ZO 3.0
a
Fig. 17 Relationships between form factor and fatigue strength
The value of form factor at the branch point was equal to about 2.5 in the annealed specimens and also in the tufftrided specimens.
In carbon steel, the value of notch radius at the branch point generally have a tendency to become small with the increase of strength of materia16), on the other hand, to become large with the increase of compressive residual stress at the root of notch. Therefore it is considered that
the value of form factor in the tufftrided specimen became almost equal to that of the annealed as a result of the interaction of above-mentioned two effects,
Later, the contribution to fatigue strengthdueto the surface treatment will be roughly divided into two parts, the effects of the residual stress and the change of mechanical properties in the surface layer, and the fatigue strength of surface-treated specimen is estimated approximately.
-29-
In the previous report4), the authors assumed that the effect of change of material properties in the surface layer of smooth specimen surface-treated did not depend on the mean stress and was nearly constant, in other words that both endurance limit diagrams of the surface-treated and .the annealed smooth specimen were parallel to each other. And thus estimated fatigue strength
of smooth specimen surface-treated agreed with the experimental results.
In present paper the case of the surface-treated specimens with a notch is discribed. If a fatigue limit is represented by ow in the smooth specimens, which are made of certain material and mean stress is not applied, a fatigue limit is equal to ow/B in the notched specimens, where P is the fatigue notch factor. Applying the mean stresses, two extreme ideas on the endurance limit diagram of notched specimen are as follows ;
a) the endurance limit diagrams of the smooth and the notched specimen are parallel to each other,
b) the endurance limit diagrams of the smooth and the notched specimen intersect in a point on the abscissa axis.
Ishibashii) pointed out, however, that Nishihara's experimental results showed approximately the case of (a). Sinclair's experimental results7} show that the hardness of material has an effect on the endurance limit diagram in connection with the mean stress, and that the slope of diagram becomes steep with increasing hardness. The case of (a) is convenient from this standpoint.
From these reasons, the authors assumed that the endurance limit diagram of surface-treated specimen with a notch is too parallel to that of the smooth specimen annealed as shown in Fig. 18.
s. i" ..O -{ nnnea]ed spectmen withanotchAOq *
AOr l t-". ').tsa' g.wo
x
ROri-Oro o bU
N-).År..- ..- .g ow Åëannealed smooth s, pec]men
"X-xlovvo ttt)' S• Urfiice-treated specimen -,]thanotch X-. ... d t 2 x. /, ....
x.. ÅqllP t ''' 1 ttt ttt tttt tt
1 ''- t "s 1 t, ss 'x.
i X'NNN ''...
ROrt-oro O -T L' -L' '6Ig77-'M- N'L' ':-o'Jf- Om
Fig. 18 Fatigue limit diagrams in surface- treated specimens
As the behavior of residual stress in fatigue process, the variation of residual stress in the early period of fatigue process was neglected and the nearly constant value of the residual stress in the most part of fatigue process, R•o,i, is considered to be equivalent to the effect of mean stress. This consideration is the same as that described for the smooth specimen.
By these assumption the fatigue strength of the surface-treated specimen with a notch is estimated similar to that of the case of the smooth specimen surface-treated.
In the surface-treated specimen with a notch the fatigue limit, ow, is expressed by the formula
Ow=ofoo+aoq+ao. (1)
,where ofoo is the fatigue limit of annealed specimen with a notch, Aoq the contribution to fatigue strength due to the change of material properties and Ao, that due to the residual stress or mean stress in the surface layer. Then we obtain
o. = oBwo(1+Bg.o,q+xg:,) (2)
,where owo is the fatigue limit of the smooth specimen annealed, B the fatigue notch factor of annealed specimen with a notch, oT the true tensile strength of that material and o, is expressed by the formula o, =R•o,i-o,.. If the residual stress of annealed specimen, o,., is completely removed, o,.=O. The third term in parenthesis of formula (2) representes the effect of compressive residual stress in the surface layer.
When the residual stress in the surface layer was not perfectly removed in the case of the tubular specimen surface-treated, the increase of fatigue strength Aoq includes the value due to the influence of residual stress and corresponds to Ao6. Accordingly, in order to remove this influence from Aoe, the formula (2) is used again.
Then it is
aoq == o.H-o';voH-OrHo'TO•VHO (3)
,where Aoq is the net contribution due to the change of material properties in the surface layer and the subscript H represents the case of tubular specimen.
The fatigue strength of solid specimen with a notch which were surface-treated can be estimated by the formulas (2) and (3).
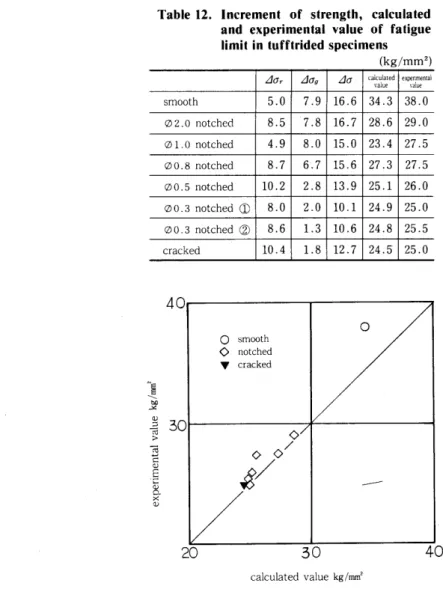
The calculated values which were obtained in the way described above and the experimental results are shown in Table 12. As is evident from this Table the calculated values approximately agree with the experimentalVvalues. Fig. 19 shows this results too and it is seen that the estimated values are in the safety side of design.
Table 12. Increment of strength, calculated and experimental value of fatigue limit in tufftrided specimens (kg/mm2)
AOr Aag ao calcu[atedvalue
expenmental value
smooth 5.0 7.9 16.6 34.3 38.0
O2.0notched 8.5 7.8 16.7 28.6 29.0 Åë1.0notched 4.9 8.0 15.0 23.4 27.5 OO.8notched 8.7 6•.7 15.6 27.3 27.5 OO.5notched 10.2 2.8 13.9 25.1 26.0 oo.3notched(D 8.0 2.0 10.1 24.9 25.0 Åëo.3notched(2) 8.6 1.3 10.6 24.8 25.5
cracked 10.4 1.8 12.7 24.5 25.0
40
NE itu
2=. 3o
k
g
-:
#
o
Osrnooth o
Qnotched Vcracked
/Q
s/QO
/
calculated value kg/mm2
Fig. 19 Experimental and calculated value oÅí fatigue strength
-31-
The ratio of increase of fatigue strength due to the change of material properties to the total increase of fatigue strength by tufftrid-treating, Aoq/Ao, is shown in Fig. 20. As is evident from this Figure it is seen that the contribution due to the change of material properties decrease rapidly with sharpening the notch size, on the other hand, the contribution due to the compressive residual stress increases relatively and it becomes remarkable in the larger form factors than the branch point. Such a result can be anticipated on physical grounds which the generation of fatigue crack in notch root is considerably governed by both material properties and residual stress, but the propagation of fatigue crack generated once is dominated by the residual stress in' the front of crack.
e
"l). O.5 Åq
.o
gs 2•s gsgsgs
50 o o
o
Osmooth Onotched ecracked
ooNS
. o
Fig.20 Relationships between form factor and contribution to fatigue strength due to change of materiat properties in surface
6 CONCLUSION
The following became clear after the investigation of the fatigue strength and the residual stress of carb.on steel (S15C) .in the rotating bending test.
1) The residual stress in the surface layer of tufftrided specimen was nearly constant during fatigue process under the stress amplitude of fatigue limit.
2) The value of form factor at the branch point was equal to about 2.5 in the annealed specimen, and was nearly equal to the former in the tufftrided specimen too.
3) Making use of the remaining ratio R on the behavior of the residual stress during fatigue process and assuming the endurance limit diagrams as shown in Fig. 18, the close agreement between the experimental and the estimated values of fatigue strength was obtained in the tufftrided specimens.
4) The contribution to fatigue strength due to the change of material properties by surface- treatment decreased rapidly with sharpening the notch size, on the other hand, the contribution due to the compressive residual stress in the surface layer increased relatively and it became remarkable beyond the branch point.
5) In the behavior of growth of fatigue crack under the near stress amplitude of fatigue limit, the rate of growth of fatigue crack in the tufftrided specimens suddenly increased immediately before breaking as compared with the annealed specimens.
6) In the high-to-low change the rate of growth of crack under high load level became tempo- rarily slow after changing into the low level, and shi.fted gradually to the rate under the low load
• level. In the low-to-high change, on the other hand, the rate under the low level did not remain the same by changing intO the high load level and the rate gradually shifted to that under the high level.
7) It is considered that the generatiQn of fatigue crack in notch root is considerably governed by both material properties and residual stress, but the propagation of fatigue crack generated once is mainly dominated by the residual stress in the front of crack.
REFARENCES
1) e,g., T. Ishibashi, Fatigue and Prevention of Fracture in Metals, Yokendo Co., Lte. (1973) P. 21 and P. 76.
2) e.g., S. Taira, H. Murakami, Journal of the Society of Material Test (Japanese), vol. 10 (1961) P. 610.
3.) K. Hayashi et al., Journal of the Society of Materiats Science (Japanise), vol. 40, No. 195 (1964)P.1105.
H. Nakamura et al., Transactions of the Japan Society of Mechanical Engineers (Japanese), vol. 34, No. 257, Jan. (1968)p. 9.
H. Nakamura, Induction to Hardening and Fatigue Strength, Nikkan Shinbun Co., Ltd. (l963) P. 41 and p. 80.
4) K. Mitsunaga, A. Fukutake, Paper Presented at JSME (Japanese), No. 718-2, May (1971) p. 9.
5) S. Taira et al., Journal of the Society ,of Material Test (Japanesel, vol. 11, (1965) p. 707 and p.699.
S. Taira et al., Journat of the Society of Materials Science (Japanese), vol. 12, No. 123 (1963) p. 894.
M. Motoyama et al., Journal of the Society of Materials Science (Japanese), vol. 17. No. 182 (1968)p.24.
6) H. Nishitani, I. Chiyo, Transactions of the Japan Society of Mechanical Engineers (Japanese), vol. 40 No. 329, Jan. (1964) p. 49.
7) Jo Dean Morrow, G. M. Sinclair, ASTM, STP, No. 237 (1959?p. 83.
- 33 -