去勢が雄ヤギの成長、肉生産ならびに臭気に及ぼす影響
誌名
誌名 Animal behaviour and management ISSN
ISSN 18802133 著者
著者 長嶺, 樹
砂川, 勝徳 巻/号
巻/号 53巻4号
掲載ページ
掲載ページ p. 137-150 発行年月
発行年月 2017年12月
農林水産省 農林水産技術会議事務局筑波産学連携支援センター
Tsukuba Business-Academia Cooperation Support Center, Agriculture, Forestry and Fisheries Research Council Secretariat
- Original article-
Effects of the castration on the growth, meat production and odors in male goats
Itsuki NAGAMINE*, Katsunori SUN A GAW A
Faculty of Agriculture, University of the Ryukyus, Nishihara, Okinawa 903-0213, Japan
*Corresponding author. E-mail address: [email protected]
Summary
Two experiments were conducted to clarify the effect of castration on meat quality and odor content. In experiment 1, twelve goats (crossbred of Japanese-Saanen/Nubian, 3-mo-old) were allocated into two groups (NCG: Non-castrated group, CG: Castrated group). Animals in the CG were castrated at 2.5-mo-old. Formulated feed and alfalfa hay cubes were fed twice daily (10:00 and 16:00 h).
Kleingrass hay and water were fed ad libitum. Body weight was measured and body measurements were recorded monthly. At 12-month post-partum, animals were slaughtered to determine the carcass trait and loin characteristics. In experiment 2, eight goats (the above crossbred, 2-yr-old) were allocated into two groups. Animals were fed alfalfa hay cubes (10:00 h), formulated feed and Kleingrass hay (16:00 h).
Water was fed ad libitum. The feed intake measurement was conducted daily. The odor intensity measurement of meat was executed. The weight of intra-abdominal fat in the CG was heavier (p<0.05) than the NCG. The concentrations of some functional compounds such as taurine in the CG were lower (p<0.05) than the NCG. The odor intensity in the CG was lower (p<0.05) than the NCG. It was elucidated that the castration of male goat resulted in lower quality of the meat and reduction of the peculiar odor.
Keywords: Castration, Growth, Male goat, Meat production, Odor contents
Animal Behaviour and Management, 53 (4): 137-150, 2017 (Received 29 May 2017; Accepted for publication 26 July 2017)
Introduction
Most breeds of goats have breeding season which starts at the end of summer and terminate at the beginning of winter (Shelton 1960).
The male matured goat shows sexual behavior during breeding season which includes mounting behavior, taking a sniff of pubic region of the female, rubbing his nose against pubic region of the female, flashing the urine onward to wet his beard and chest, pulling up upper lip following drinking urine (Flehmen). Their hair has gotten dirty and browned, and then intense and peculiar odor is emitted (Price et al. 1986). This odor acts as pheromone which provokes estrus activity of female (Sasada et al. 1983). The peculiar odor is produced in sebaceous glands of matured male
goat by action of testosterone (Sugiyama et al.
1986). Branched-chain fatty acids in the serum is identified as the odor components, and it is thought that the peculiar odor transfers from blood to meat. It is possible to improve meat quality by castration, for example, marbling score of the meat is improved and the peculiar odor is reduced. Thus, the meat of castrated steer and boar is widely distributed. While, the commercial goat meat is non-castrated (intact) matured male goat's one in Okinawa, Japan, because transaction prices of castrated male goat in the market are cheaper than those of intact animal. The reason is thought that the meat quality of castrated male goat is lower than that of intact one. However, the effect of castration on goat meat quality is still unclear. The meat of male goats from 2 to
Effects of the castration on male goats
3 years old is used for cooking goat meat soup.
Goat meat soup emits the strong odor. Recently in Okinawa, the number of people who have never eaten the goat meat is increasing because of its peculiar odor. Thus, the odor reduction is necessary. It is thought that. the peculiar odor of goat meat is reduced by castration such as steer and boar, but the effect of castration on the peculiar odor of goat meat is not well-known.
In this study, two experiments were conducted to clarify the effect of castration on meat quality and odor content of male goats. In experiment 1, effect of castration on growth and meat productivity of male kids was investigated. In experiment 2, effect of castration on feed intake, blood property, and odor of hair and meat of matured male goats (over 2-yr-,-old) was studied because their meat is used for goat meat soup in Okinawa.
Materials and Methods
Experiment 1 Effect of castration on growth and meat production in male kids
Animals
Twelve goats (J apanese-Saanen/Nubian crossbred, 3-mo-old, BW 20. 7
±
1.5 kg) were used in this experiment. All goats were the kids (Fl) derived from genetically different male and female goat. All experiment procedures and animal's care were in compliance with the Japanese code of practice for the care and use of animals for scientific purposes.Experimental design
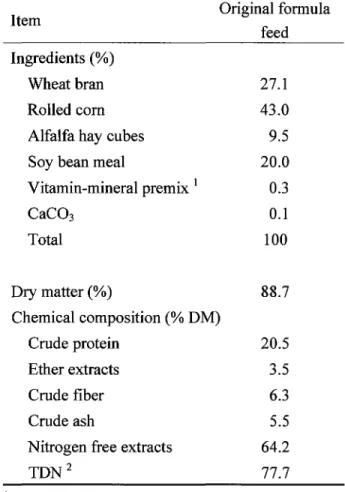
The goats were allocated into two groups of six animals (NCG:Non-castrated group, CG:Castrated group). The animals in the CG were castrated at 2.5-mo-old. They were given formulated feed and crushed alfalfa hay cubes twice a day (10:00 and 16:00 h). Kleingrass (Panicum coloratum L.) hay and water were fed ad libitum. The volume of mixed feed given to animals was formulated to provide a l00g/d increase in body weight (Table 1) based on NRC feeding standard (National Research Council 2007). For the first 2-mo, the animals were given an allocation of 355.0 g DM per animal per day. From 5 to 10-mo-old, the animals were given an allocation of 443.3 g DM per animal per day. Following this period, the allocation was increased to 532.2 g DM per animal per day and offered to the animals in equal portions at 10:00 and 16:00 h. The roughly
Table 1. Ingredients and chemical composition of original formula feed
Item
Ingredients (%)
Original formula feed
Wheat bran 2 7 .1
Rolled com 43.0
Alfalfa hay cubes 9.5
Soy bean meal 20.0
Vitamin-mineral premix 1 0.3
CaCO3 0.1
Total 100
Dry matter (%) 88.7
Chemical composition (% DM)
Crude protein 20.5
Ether extracts 3.5
Crude fiber 6.3
Crude ash 5.5
Nitrogen free extracts 64.2
TDN2 77.7
1 Vitamin-mineral premix contained (DM basis):
Fe, 2,511 mg/kg; Cu, 750 mg/kg; Mn, 250 mg/kg;
Zn, 2,501 mg/kg; Choline chloride, 50,000 mg/kg;
vitamin A, 1,000,000IU/kg; vitamin D3, 150,000IU/
kg; vitamin 81, 300 mg/kg; vitamin 82 , 1000 mg/
kg; vitamin 83, 1,300 mg/kg; vitamin 85, 1,100 mg/
kg; vitamin 86 , 600 mg/kg; vitamin 89 , 125 mg/
kg; vitamin 812, 1.5 mg/kg; vitamin E, 5,000 mg/kg;
vitamin K, 267 mg/kg.
2 Total digestible nutrients.
crushed alfalfa hay cubes was fed 148.3 g DM/
animal/d from 3 to 4-mo-old, 296.7 g DM/animal/
d from 5 to 12-mo-old. The alfalfa hay cubes (84.30% DM) contained, on a DM basis, 18.7%
crude protein, 2.4% crude fat, 29.7% crude fiber, 39.7% nitrogen-free extracts. Kleingrass hay (92.8% DM) contained, on a DM basis, 8.4% crude protein, 1.6% crude fat, 31.0% crude fiber, 50.3%
nitrogen-free extracts. The animals were all given free access to water and vitamin-mineral block (E-100, Nippon Zenyaku Kogyo Co. Ltd., Fukushima, Japan). This block contained 380 g/
kg Na, 1,232 mg/kg Fe, 150 mg/kg Cu, 500 mg/
kg Mn, 500 mg/kg Zn, 25 mg/kg Co, 15 mg/kg Se, 50 mg/kg I and 2,000 IU/kg vitamin E.
NAGAMINE, SUNAGA WA
Over the 9-mo of the experiment, the index of growth of the animals was determined by taking monthly measurements of body weight, body length, withers height, hip height, chest depth, chest width, chest girth, and hip width (Nagamine et al. 2015).
Chemical analysis of feed
Original formula feed, alfalfa hay cubes and klein grass hay were ground with a Wiley mill (type 40-525P, screen size 1 mm, Ikemoto Rika Kougyou, Tokyo, Japan). The chemical components of these feeds were quantified using the procedures described by the Japanese Feed Association (Kato 1988) and AOAC methods (Association of Official Analytical Chemists International 2007). The detailed procedure is described in the previous report (Nagamine et al.
2012).
Analysis of the carcass
At the end of the experiment (12-mo post- partum), the animals were slaughtered to
determine the physical and chemical characteristics of the carcass. The dressed carcass was divided in five cuts including chuck, brisket, loin, plate and flank, and round (Nagamine et al. 2013). The weights of chuck, brisket, loin, plate and flank, round, and intra-abdominal fat were measured using the methods reported previously (Nagamine et al. 2013).
After the contents of the alimentary canal were removed, the weights of rumen, reticulum, omasum, abomasum, large and small intestines, liver, heart, spleen, lungs and trachea were measured. The lengths of the small and large intestines were also measured using a measuring tape.
Analysis of the physical characteristics and chemical property in longi,ssimus thoracis
Using methods adopted previously (Nagamine et al. 2013), cooking loss, tenderness, water holding capacity and compressed meat juice ratio were measured as indexes of meat juice retention, tenderness, water retention and juiciness in loin meat. Total lipid content, melting point of fat, composition of fatty acids and concentration of free amino acids in loin meat were also measured.
Experiment 2 Effect of castration on feed intake, blood property, and odor of hair and meat in matured male goats
Animals
Eight goats (crossbred of Japanese-Saanen/
Nubian, 2-yr-old, BW 85.1±10.0 kg) were allocated into two groups of four animals (NCG and CG). Each animal was maintained in an individual metabolic cage (length 2 m, width 1 m, height 2 m) that allows the animal to move freely under thermoneutral conditions (room temperature 23.1±2.1°C, relative humidity 77.2
±6.1%). The animals were fed crushed alfalfa hay cubes at 10:00 h and formulated feed (100 g/
animal), Kleingrass hay (300 g/ animal) and vitamin-mineral premix (Table 1) at 16:00 h.
Water and vitamin-mineral block were fed ad libitum.
Feed intake measurement
During the experiment from 26 to 33-months of age, the measurement of feed intake was conducted daily. Daily intake of alfalfa hay cubes was measured. Daily intake was defined as intake from 10:00 to 16:00 h in this experiment. The residual alfalfa hay cubes were removed from the feed trough and their weight was measured at 16:00 h. The amount of feed consumed was determined by subtracting the weight of the remaining alfalfa hay cubes from the total weight given to the animals.
Biochemical analysis of blood parameters
Blood was taken monthly from jugular vein of the animals and stored in ice for later analysis.
Hematocrit, plasma osmolality, and plasma concentration of total protein, glucose, Na, K, Cl and lipids were measured using the same methods as that adopted by Thang et al. (2012).
Measurement of odor intensity
The odor intensity measurements of hair and meat were executed using odor measuring device (XP-329III, NEW COSMOS ELECTRIC CO.
LTD., Osaka). The odor intensity was expressed as value from O to 2000. The odor intensity of each sample was measured for 1 min and peak value was adopted as odor intensity value of the sample.
At the 32-month of age in the breeding season, total 10 g of hair was taken from parietal region where many sebaceous glands exist (Smith &
Sherman 2009), dirty region around the head (glabella, neck), and back using clipper. Hair samples were put into a plastic bag and sealed, and warmed at 38 °C for 30 min. Then, the odor
Effects of the castration on male goats
intensity of hair was measured in the room where it was ventilated over half an hour. At the 33-month post-partum, the animals were slaughtered to determine the order intensity and components in meat. The frozen minced loin meat of goats of two groups was used for the odor intensity measurement. The 80 g of meat thawed in the refrigerator overnight and 1000 mL of distilled water were put into the pan, and the covered pan was heated until boiling. Then, steam escaped from the pan was collected with plastic bag for 1 min and sealed. Shortly thereafter, the odor intensity of meat was measured in the ventilated room.
Identification and quantification of odor components
Identification and quantification of volatile odor compounds of meat were conducted using following methods. Distilled water (500 mL) and minced meat of intact or castrated goat (25 g) were mixed in the pear-shaped flask, and the distillate (300 mL) was obtained in the conical flask by steam distillation. The 10 µ L of internal standard (1.016% cyclohexanol aqueous solution) was added to collected distillate. This solution was used for odor component identification.
According to the methods mentioned by Zhan et al. (2013), separation and identification of odor component were practiced by injection of this solution (1 µ L) into the gas chromatography mass spectrometer (Gas Chromatograph GC-2010 · GC-MS-QP2010 ULTRA, Shimadzu, Kyoto).
The capillary column (Inert Cap Pure Wax, i.d. 0.25 mm, length 30 m, GL Sciences, Tokyo) was used. The odor component was separated and identified under the following conditions:
injector and detector temperature 230.0°C, carrier gas (He) flow rate 28.8 mL/min. The rising temperature program was that the oven was held at 40.0°C for first 2 min, continued at a velocity of 5°C/min until the temperature reached 230°C, and then maintained at 230°C for 5 min.
Condition for the GCMS(QP2010) was ion source temperature 200.0°C, interface temperature 240.0°C and elution time of solvent 2.50 min.
Unknown substance was identified using retention time of samples. The concentration of detected substances calculated using peak area of internal solution and detected substances.
Statistical analysis
Fisher's LSD method was used to compare the
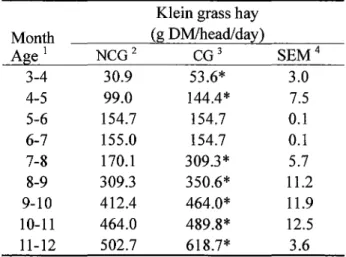
Table 2. Effect of castration on intake of klein grass hay in male kids
Klein grass hay
Month (g DM/head/day)
Age 1 NCG2 CG3 SEM4
3-4 30.9 53.6* 3.0
4-5 99.0 144.4* 7.5
5-6 154.7 154.7 0.1
6-7 155.0 154.7 0.1
7-8 170.1 309.3* 5.7
8-9 309.3 350.6* 11.2
9-10 412.4 464.0* 11.9
10-11 464.0 489.8* 12.5
11-12 502.7 618.7* 3.6
* Means in castrated group in the same row are significantly different from non-castrated group (p<0.05).
1 Age of animals.
2 Non-castrated group.
3 Castrated group.
4 Standard error of the mean.
daily intake of hay and hay cubes in each month, body measurements, meat parameters, blood parameters and odor parameters between NCG and CG. For statistical analysis, GLM procedure (SAS 2012) was used. All data were analyzed using the following model:
Yij = µ + Ti + C ij
Where Yij
=
the measured variable; µ=
the overall mean; Ti=
the effect of the ith treatment;c ij
=
the random error effect.Results
Experiment 1 Effect of castration on growth and meat production in male kids
Effect of castration on growth in male kids The entire amount of mixed feed and alfalfa hay cubes given to the animals in the NCG and CG were consumed. Table 2 shows daily intake of Klein grass hay. The hay intake in the CG was significantly higher (p<0.05) than the NCG except for the value of 5-7 months of age. The TDN and CP intakes of the both groups were calculated from mixed feed, alfalfa hay cubes and hay intakes. The TDN and CP intakes in the NCG and CG met (TDN adequacy: NCG 110.5%, CG 111.1 %; CP adequacy: NCG 134.8%, CG 137.0%) the nutrient requirements for growing male goats as specified in the feeding standards (National Research Council 2007).
NAGAMINE, SUNAGAWA
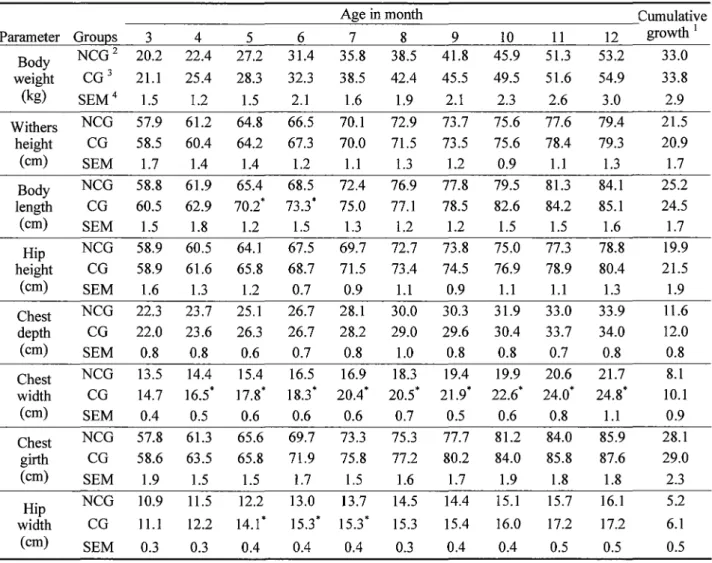
Table 3. Effect of castration on the growth of male kids
Age in month Cumulative
Parameter Grou~s 3 4 5 6 7 8 9 10 11 12 growth I
Body NCG2 20.2 22.4 27.2 31.4 35.8 38.5 41.8 45.9 51.3 53.2 33.0 weight CG3 21.1 25.4 28.3 32.3 38.5 42.4 45.5 49.5 51.6 54.9 33.8
(kg) SEM4 1.5 1.2 1.5 2.1 1.6 1.9 2.1 2.3 2.6 3.0 2.9
Withers NCG 57.9 61.2 64.8 66.5 70.1 72.9 73.7 75.6 77.6 79.4 21.5 height CG 58.5 60.4 64.2 67.3 70.0 71.5 73.5 75.6 78.4 79.3 20.9
(cm) SEM 1.7 1.4 1.4 1.2 1.1 1.3 1.2 0.9 1.1 1.3 1.7
Body NCG 58.8 61.9 65.4 68.5 72.4 76.9 77.8 79.5 81.3 84.1 25.2 length CG 60.5 62.9 10.2· 73.3* 75.0 77.1 78.5 82.6 84.2 85.1 24.5
(cm) SEM 1.5 1.8 1.2 1.5 1.3 1.2 1.2 1.5 1.5 1.6 1.7
Hip NCG 58.9 60.5 64.1 67.5 69.7 72.7 73.8 75.0 77.3 78.8 19.9 height CG 58.9 61.6 65.8 68.7 71.5 73.4 74.5 76.9 78.9 80.4 21.5
(cm) SEM 1.6 1.3 1.2 0.7 0.9 1.1 0.9 1.1 1.1 1.3 1.9
Chest NCG 22.3 23.7 25.1 26.7 28.1 30.0 30.3 31.9 33.0 33.9 11.6 depth CG 22.0 23.6 26.3 26.7 28.2 29.0 29.6 30.4 33.7 34.0 12.0
(cm) SEM 0.8 0.8 0.6 0.7 0.8 1.0 0.8 0.8 0.7 0.8 0.8
Chest NCG 13.5 14.4 15.4 16.5 16.9 18.3 19.4 19.9 20.6 21.7 8.1 width CG 14.7 16.5* 17.8* 18.3* 20.4* 20.5* 21.9* 22.6* 24_0· 24.8* IO.I
(cm) SEM 0.4 0.5 0.6 0.6 0.6 0.7 0.5 0.6 0.8 1.1 0.9
Chest NCG 57.8 61.3 65.6 69.7 73.3 75.3 77.7 81.2 84.0 85.9 28.1 girth CG 58.6 63.5 65.8 71.9 75.8 77.2 80.2 84.0 85.8 87.6 29.0
(cm) SEM 1.9 1.5 1.5 1.7 1.5 1.6 1.7 1.9 1.8 1.8 2.3
Hip NCG 10.9 11.5 12.2 13.0 13.7 14.5 14.4 15.1 15.7 16.1 5.2 width CG 11.1 12.2 14.i* 15.3* 15.3* 15.3 15.4 16.0 17.2 17.2 6.1
(cm) SEM 0.3 0.3 0.4 0.4 0.4 0.3 0.4 0.4 0.5 0.5 0.5
Values are mean of six animals (n=6).
1 Cumulative growth for 9 months (kg/9 month, or cm/9 month).
2 Non-castrated group. 3 Castrated group. 4 Standard error of the mean.
* Means of CG in the same row are significantly different from NCG (p<0.05).
Table 3 shows the monthly body weight and Table 4. Nutrient intake and growth performance of size measurements of the animals in the NCG and intact and castrated male kids
CG. During the experiment, monthly body weight, Parameter NCG1 CG2 SEM3 withers height, chest depth and chest girth were
TDN intake (gDM/d/head) 626.5 654.1 8.8 not significantly different between the NCG and
CG. The body length in the CG was similar to Initial body weight (kg) 20.2 21.l l.5 that of the NCG except 5 and 6 months of age. Final body weight (kg) 53.2 54.9 3.0 The hip width in the CG was similar to that of Body weight gain (kg) 33.0 33.8 2.9 the NCG except 5-7 months of age. However,
Average daily gain (g/d) 122.2 125.2 10.9 the chest width of the animals in the CG after
4-mo-old was significantly larger (p<0.05) than Feed conversion ratio 5.1 5.2 0.8 the NCG. The cumulative growth in body weight Values are mean of six animals (n=6).
and body measurements in the both NCG and CG 1 Non-castrated group. 2 Castrated group.
were similar. 3 Standard error of the mean.
Table 4 shows the nutrient intake and growth * Means of CG in the same row are significantly performance of intact and castrated male goats. different from NCG (p<0.05).
The average daily gain and feed conversion ratio in the CG were similar with those of the NCG.
Effects of the castration on male goats
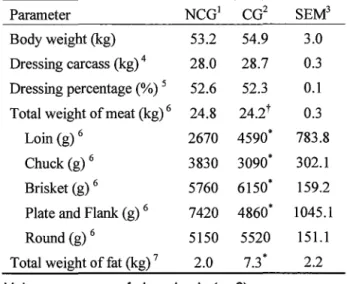
Table 5. Effect of castration on meat production in male kids
Parameter NCG1 CG2
Body weight (kg) 53.2 54.9 Dressing carcass (kg) 4 28.0 28.7 Dressing percentage (%) 5 52.6 52.3 Total weight of meat (kg) 6 24.8 24.2t
Loin (g) 6 2670 4590*
Chuck (g) 6 3830 3090*
Brisket (g) 6 5760 6150*
Plate and Flank (g) 6 7420 4860*
Round (g) 6 5150 5520
Total weight of fat (kg) 7 2.0 7.3*
Values are mean of six animals (n=6).
1 Non-castrated group. 2 Castrated group.
3 Standard error of the mean.
SEM3 3.0 0.3 0.1 0.3 783.8 302.1 159.2 1045.1
151.1 2.2
4 Combined weight of left and right carcasses after removing head and internal organs.
5 Weight of dressing carcass (kg) / body weight (kg) X 100.
6 Weight without bone.
7 Intra-abdominal fat.
* Means of CG in the same row are significantly different from NCG (p<0.05).
t Means of CG in the same row are significantly different from NCG (p<0.1 ).
Effect of castration on meat production in male kids
Carcass characteristics are shown in Table 5. There was no significant difference in the body weight before slaughter between the NCG and CG. The weight of the dressed carcass and dressing percentage in the CG were similar with those of the NCG. Compared to the NCG, the weights of the loin and brisket in the CG were significantly higher (p<0.05), but the weights of the chuck, and plate and flank were significantly lower (p<0.05). There was no significant difference in the weight of the round areas of carcasses between the NCG and CG. Therefore, total weight of meat in the CG tended to be lower than the NCG (p<0.1). However, the weight of intra-abdominal fat in the CG was significantly heavier (p<0.05) than the NCG and was more than three times of the NCG.
Physical characteristics of the loin
The physical characteristics of the loin are shown in Table 6. The cooking loss in the CG
Table 6. Effect of castration on physical characteristics of loin in male kids
Parameter NCG1 CO2
Cooking loss (%) 30.3 28.1 Tenderness (kgf/cm2) 70.6 46.5*
Water holding capacity 78.6 so.1 • Compressed meat juice ratio(%) 34.3 36.2*
Values are mean of six animals (n=6).
1 Non-castrated group. 2 Castrated group.
3 Standard error of the mean.
SEM3 1.3 2.3 0.6 0.8
* Means of CG in the same row are significantly different from NCG (p<0.05).
was not significantly different from the NCG. The tenderness of the meat in the CG was significantly lower (p<0.05) than the NCG. The water holding capacity and the compressed meat juice ratio of the meat from the CG were significantly higher (p<0.05) than those in the NCG.
Chemical property of the loin
The fatty acid composition of the loin is shown in Table 7. The melting point of fat in the loin of the CG was similar with that in the NCG.
Compared with the NCG, the total lipid content in the loin of the CG was significantly higher (p<0.05). The ratio of saturated fatty acids in the CG was significantly lower (p<0.05) than that in the NCG. Palmitic acid (C16:0) and stearic acid (C18:0) ratios in the CG were significantly lower (p<0.05) than those in the NCG. There were no differences in the ratios of other saturated fatty acids between CG and NCG. In contrast, the ratio of unsaturated fatty acids in the CG was significantly higher (p<0.05) than that in the NCG. The ratios of oleic acid (C18:l), eicosenoic acid (C20:1), arachidonic acid (C20:4) and eicosapentaenoic acid (C20:5) in the CG were significantly higher (p<0.05) than those in the NCG. In contrast, the ratios of myristoleic acid (C14:1), palmitoleic acid (C16:1), cis-vaccenic acid (C18:1 cis-11) and alpha-linolenic acid (C18:3) in the CG were significantly lower (p<0.05) than those in the NCG. The ratios of other unsaturated fatty acids in the CG were similar with the NCG.
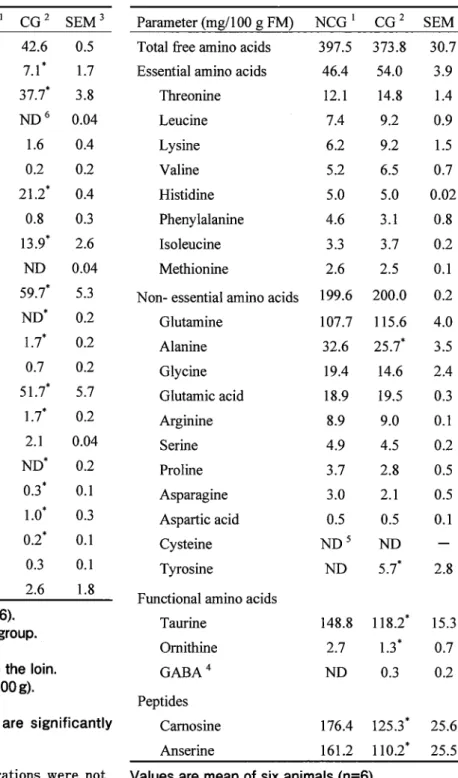
Free amino acids concentration in the loin is shown in Table 8. Free amino acids concentration in the loin of the CG was similar with that in the NCG. Also, the total concentration of essential amino acid in the CG was not significantly different from that in the NCG. All
NAGAMINE, SUNAGA WA
Table 7. Effect of castration on fatty acid composition Table 8. Effect of castration on free amino acids
of loin in male kids content of loin in male kids
Parameter NCG 1 CG2 SEM3
Melting point of fat (0C) 4 43.8 42.6 0.5 Total lipid content (g/100 g)5 3.0 7.1* 1.7 Saturated fatty acids(%) 47.1 37_7* 3.8
Cl0:0 0.1 ND6 0.04
Cl4:0 2.5 1.6 0.4
Cl5:0 0.6 0.2 0.2
Cl6:0 22.1 21.2* 0.4
Cl7:0 1.5 0.8 0.3
Cl8:0 20.2 13.9* 2.6
C20:0 0.1 ND 0.04
Unsaturated fatty acids(%) 46.8 59.7' 5.3
Cl4:l 0.5 ND* 0.2
Cl6:l 2.2 1.7* 0.2
Cl7:l 1.3 0.7 0.2
Cl8:l 37.8 51.7* 5.7
Cl8:l cis-11 2.1 1.7' 0.2
Cl8:2 2.2 2.1 0.04
Cl8:3 0.4 ND* 0.2
C20:l ND o.3' 0.1
C20:4 0.2 1.0* 0.3
C20:5 ND 0.2* 0.1
C22:5 0.1 0.3 0.1
Not identified(%) 6.9 2.6 1.8
Values are mean of six animals (n=6).
1 Non-castrated group. 2 Castrated group.
3 Standard error of the mean.
4 Melting point of fat extracted from the loin.
5 Total content of lipid in the loin (100 g).
6 Not detected.
* Means of CG in the same row are significantly different from NCG (p<0.05).
the essential amino acid concentrations were not significantly different between CG and NCG.
The total concentration of non-essential amino acid in the CG was not significantly different from that in the NCG. Of the non-essential amino acid, concentration of alanine in the CG was significantly lower (p<0.05) than the NCG, but tyrosine concentration was significantly higher (p<0.05). The concentrations of other non-essential amino acids in the CG were similar with the NCG. Of the functional amino acids and peptides, concentrations of taurine,
Parameter (mg/100 g FM) NCG 1 CG 2 SEM 3 Total free amino acids 397.5 373.8
Essential amino acids 46.4 54.0
Threonine 12.1 14.8
Leucine 7.4 9 .2
Lysine 6.2 9.2
Valine 5.2 6.5
Histidine 5.0 5.0
Phenylalanine 4.6 3.1
Isoleucine 3.3 3.7
Methionine 2.6 2.5
Non- essential amino acids 199.6 200.0
Glutamine 107.7 115.6
Alanine 32.6 25.7*
Glycine 19.4 14.6
Glutamic acid 18.9 19.5
Arginine 8.9 9.0
Serine 4.9 4.5
Proline 3.7 2.8
Asparagine 3.0 2.1
Aspartic acid 0.5 0.5
Cysteine ND 5 ND
Tyrosine ND 5. 7*
30.7 3.9 1.4 0.9 1.5 0.7 0.02
0.8 0.2 0.1 0.2 4.0 3.5 2.4 0.3 0.1 0.2 0.5 0.5 0.1
2.8 Functional amino acids
Taurine 148.8 118.2* 15.3
Omithine GABA4 Peptides
Camosine Anserine
2.7 1.3* 0.7
ND 0.3 0.2
176.4 125.3' 25.6 161.2 110.2* 25.5 Values are mean of six animals (n=6).
1 Non-castrated group. 2 Castrated group.
3 Standard error of the mean.
4 y -aminobutyric acid. 5 Not detected.
* Means of CG in the same row are significantly different from NCG (p<0.05).
ornithine, carnosine and anserine in the CG were significantly lower (p<0.05) than the NCG.
Size of various organs
The size of various organs is shown rn
Effects of the castration on male goats
Table 9. Effect of castration on various organs in male kids
Parameter NCG1 CG2
Weight (g)
Liver 1520 1000*
Kidneys 200 200
Heart 550 300
Lungs and trachea 1760 1510
Spleen 150 140
Rumen 1570 2400*
Reticulum 250 240
Omasum 190 140*
Abomasum 440 420
Large and small intestine 4570 4410 Length (cm)
Large intestine 1048 800·
Small intestine 2348 1745*
Values are mean of six animals (n=6).
1 Non-castrated group. 2 Castrated group.
3 Standard error of the mean.
SEM3
212.3 0.1 102.1 102.1 4.1 338.9
4.1 20.4
8.2 65.3
101.3 246.2
* Means of CG in the same row are significantly different from NCG (p<0.05).
Table 9. The weight of rumen in the CG was significantly larger (p<0.05) than the NCG. In contrast, the weight of liver and omasum in CG was significantly smaller (p<0.05) than the NCG.
There was no significant difference in the weight of other visceral organs between CG and NCG.
The length of the large and small intestines in the CG was significantly shorter (p<0.05) than the NCG.
Experiment 2 Effect of castration on feed intake, blood property, and odor of hair and meat in matured male goats
Feed intake
Table 10 shows the changes in daily intakes of alfalfa hay cubes throughout the experiment.
The intake of the animal in NCG decreased from 30 months of age (September). However, intake in CG was almost stabled during experiment.
The intakes in the CG from 30 months of age (September) to 32 months of age (November) in the breeding season were significantly larger (p<0.05) than those in the NCG.
Blood parameters
Table 10. Effect of castration on daily intake of alfalfa hay cubes in matured male goats
Age in Alfalfa hay cubes (g DM/head/day)
month NCG1 CG2 SEM3
26 1311.2 1388.4 41.7
27 1440.0 1608.5 77.1
28 1594.4 1625.5 42.7
29 1627.5 1516.6 56.0
30 1019.9 1465.9* 75.3
31 816.3 1380.7* 56.1
32 651.4 1372.1* 44.5
33 1289.8 1314.0 32.1
Values are mean of four animals (n=4).
1 Non-castrated group. 2 Castrated group.
3 Standard error of the mean.
* Means of CG in the same row are significantly different from NCG (p<0.05).
Table 11 shows the monthly change of blood parameters in the NCG and CG. The hematocrits in the CG from 27 months of age (June) to 29 months of age (August) were significantly higher (p<0.05) than those in the NCG. The concentration of glucose in the CG was significantly higher (p<0.05) than that in the NCG for most of the experimental periods. On the other hand, the plasma total protein concentration in the CG was significantly lower (p<0.05) than that in the NCG except 31 and 32 months of age (October and November). The plasma osmolality in the CG was similar with that in the NCG.
The plasma Na concentration in the CG was also similar with that in the NCG throughout the experiment. The plasma K concentrations in the CG at 28, 29 and 31 months of age (July, August and October) were significantly lower (p<0.05) than those in the NCG. By contrast, the plasma Cl concentrations in the CG at 28, 30 and 32 months of age (July, September and November) were significantly higher (p<0.05) than those in the NCG. The plasma concentrations of total cholesterol, HDL cholesterol, LDL cholesterol and phospholipids in the CG were significantly higher (p<0.05) than those in the NCG during experiment. In addition, the plasma concentration of triglyceride in the CG was significantly higher (p<0.05) than that in the NCG for most of the experimental periods. The plasma concentration of non-esterified free fatty acid in the CG was not significantly different from that in the NCG
NAGAMINE, SUN A GAW A
Table 11. Effect of castration on blood parameters in adult goats
Age in month
Parameter Grou2s 26 27 28 29 30 31 32 33
Hematocrit NCG1 31.0 29.9 27.9 30.4 31.3 30.6 32.8 32.0
CG2 33.3 35_0· 35_9• 34.8* 33.9 31.3 33.2 33.0
(%) SEM3 1.6 1.4 1.5 1.6 1.7 2.5 2.2 2.3
Plasma total NCG 7.8 8.2 8.2 8.5 8.5 8.0 8.1 8.0
protein CG 6.6* 6.4* 6.5* 6.8* 7.0* 6.9 7.5 6.5·
(g/dL) SEM 0.3 0.4 0.4 0.5 0.5 0.7 0.7 0.3
Plasma NCG 287.8 289.0 290.8 286.8 288.8 289.5 292.0 292.3
osmolality CG 288.0 289.8 291.3 288.8 288.0 289.7 292.0 294.5
(mOsm/L) SEM 1.0 1.2 1.0 1.3 1.2 1.8 1.7 0.7
Plasma NCG 57.0 59.3 56.8 59.8 57.5 60.0 60.5 57.5
glucose CG 60.5 66.8* 72.5* 68.8 69.3* 66.o· 69.3* 65.5*
(mg/dL) SEM 1.4 2.4 2.9 4.3 2.0 1.5 2.9 1.6
Plasma Na NCG 139.3 137.3 137.5 139.0 136.5 134.5 135.0 135.8
(mmol/L) CG 137.3 137.0 136.3 135.0 136.3 135.0 134.0 134.5
SEM 1.2 0.9 0.5 1.9 1.1 1.3 0.7 0.4
PlasmaK NCG 4.9 4.8 4.9 4.7 4.6 4.6 4.8 4.6
(mmol/L) CG 4.8 4.6 4.3* 4.2* 4.5 4.2* 4.5 4.5
SEM 0.2 0.1 0.1 0.1 0.1 0.1 0.2 0.3
Plasma Cl NCG 97.5 96.8 96.0 96.0 94.5 93.8 93.5 94.5
(mmol/L) CG 98.0 99.3 98.8* 98.3 97_5* 95.3 96.o· 98.0
SEM 1.2 1.0 0.8 1.0 1.0 0.5 0.7 1.3
Plasma total NCG 32.5 28.6 26.2 24.5 23.0 22.7 24.3 27.2
cholesterol CG 58.6* 58.8* 59.8* 56.4* 53_5* 58.3* 60.9* 60.9*
(mg/dL) SEM 4.1 2.5 3.4 1.9 4.1 3.9 5.5 1.8
Plasma NCG 12.5 13.6 7.2 8.1 10.0 9.2 9.2 7.8
triglyceride CG 20.8 28.7* 27.4* 28.5* 24.9* 21.2 23.4* 19_0·
(mg/dL) SEM 3.3 3.3 2.5 2.3 4.4 5.4 3.5 2.2
PlasmaHDL NCG 24.2 22.5 20.0 17.7 16.5 15.5 18.0 19.1
cholesterol CG 37. 1 • 40.2* 40.5* 38.3* 35_3• 35.o* 38.5* 40.6*
(mg/dL) SEM 1.7 2.1 2.3 2.5 3.4 4.2 3.6 2.5
Plasma LDL NCG 5.8 3.4 4.7 5.1 4.4 5.4 4.4 6.5
cholesterol CG 17.4* 12.9* 13.8* 12.4* 13.2* 19.i* 11.1· 16.4*
(mg/dL) SEM 2.5 1.7 1.8 2.3 1.3 2.0 2.1 3.4
Plasma free NCG 127.7 195.9 240.2 382.3 353.1 418.5 359.0 342.2
fatty acid CG 260.9* 276.6 306.9 339.5 294.1 341.6 474.6 304.0
(µEq/L) SEM 21.5 45.7 53.0 33.2 36.1 58.8 92.6 87.4
Plasma NCG 47.6 50.7 39.0 39.0 38.6 36.4 43.5 44.4
phospholipids CG 76.o* 81.7* 84.6*
n.o·
68.5* 69.8* 74_9* 96.2*(mg/dL) SEM 4.1 4.9 4.9 6.4 7.4 8.6 7.7 5.0
Values are mean of four animals (n=4).
1 Non-castrated group. 2 Castrated group. 3 Standard error of the mean.
* Means of CG in the same row are significantly different from NCG (p<0.05).
for most of the experimental periods. (p<0.05) than that in the NCG.
Table 12 shows the odor component Odor intensity of hair and meat, and identification concentrations of the loin meat in the NCG and of meat odor components CG. In the present study, 21 volatile components Figure 1 shows the odor intensity of hair and were identified as the meat odor components.
meat in the NCG and CG during breeding season. The concentrations of 3-pentanol, 2-pentanol, The odor intensity of hair in the CG was 67.2% acetoin, di-sec-butyl ether, 4-methyl octanoic lower (p<0.05) than that in the NCG. The odor acid, 2,3-butanediol, diisooctyl phthalate and intensity of meat in the CG was also 62.4% lower cyclopentadecanone in the CG were significantly
Effects of the castration on male goats
500 450 400 e350
"'
5
300S
250; 200
'Cl I
O 150 100 50 0
I I
*
DNCG
•CG
*
Hair Meat
Figure 1. The odor intensity of hair and meat in non-castrated (NCG) and castrated groups (CG).
* Means of CG in the hair or meat sample are significantly different (p<0.05) from NCG.
lower (p<0.05) than those in the NCG. While, the concentrations of tetradecanoic acid ethyl ester, palmitate, stearate, (E)-9-octadecanoic acid ethyl ester and 9,12-octadecadienoic acid were significantly higher (p<0.05) than those in the NCG. The concentrations of all other components were not significantly different between the NCG and CG.
Discussion
Effect of castration on growth and meat production in male kids
Castrated male animals are feminized by increase in secretion of female hormones such as follicle-stimulating hormone and luteinizing hormone (Liptrap et al. 1986). Female animals grew more slowly than male animals and mature body weight and sizes in female animals were smaller than those in male animals (Nagamine et al. 2012; 2013). From these facts, it was assumed that mature body weight and sizes in the castrated male goat became smaller than those in the intact male goat. However, in the Experiment 1, the body weight and body measurements at the end of the experiment, and the growths in the body weight and body measurements were not different significantly between NCG and CG.
Also, hay intake in the CG was larger than that in the NCG. In addition, the animals in the CG grew at higher rate than NCG animals during the breeding season. It was reported that feed intake in intact male decreased and the growth rate also became lower (Nagamine et al. 2013). Thus, it was suggested that the increase of growth rate of the CG animals in the breeding season resulted in the same body weight and sizes as those in NCG
Table 12. Concentration of compounds identified from loin meat in non-castrated and castrated adult male goats
Compounds NCG1 CG2 SEM3
-ppm-
2-Butanol 209.0 763.0 226.2
2-Propanone 87.5 11.1 31.2
3-Pentanol 93.5 20.1 * 30.0
2-Ethoxy-3-chlorobutane 1960.3 207.2 715.7
2-pentanol 109.9 18.0* 37.5
Acetoin 667.1 162.8* 205.9
Di-sec-butyl ether 446.3 68.o* 154.4
Cyclohexanol 4 40.4 40.4
Acetic acid 292.4 135.2 64.2
Ethane 918.3 963.2 18.3
4-methyl octanoic acid 10.3 ND* 4.2 2,3-Butanediol 844.8 480.3* 148.8 Tetradecanoic acid ethyl ester ND 112.0• 45.7
Palmitate ND 817.6* 333.8
Stearate ND 162.4* 66.3
(E)-9-Octadecanoic acid ethyl ester ND 75.4* 30.8 9, 12-Octadecadienoic acid ND 192.6* 78.6 Tetradecanoic acid 54.4 38.2 6.6 Diisooctyl phthalate 493.0 ND' 201.3 Pentadecanoic acid 19.8 3.5 6.7 Hexadecanoic acid 106.3 135.8 12.0 Cyclopentadecanone 32.5 3.6* 11.8 Values are mean of four animals (n=4).
1 Non-castrated group. 2 Castrated group.
3 Standard error of the mean.
4 Internal standard. 5 Not detected.
* Means of CG in the same row are significantly different from NCG (p<0.05).
animals at the end of experiment.
The animals in the CG got rounder than those in the NCG (Table 3). While no significant difference was found in total weight of the meat between NCG and CG, the weight of intra- abdominal fat in the CG was three times as heavy as that in the NCG (Table 5). Schanbacher et al. (1980) reported that the fat content in the dressed carcass of the castrated male lamb was higher than that of the intact male. Based on these, it was suggested that the chest width in the CG became larger than that in the NCG due to the increase of intra-abdominal fat deposition
NAGAMINE, SUNAGA WA
in the CG. As the lipogenic enzyme activity in the castrated male goat is higher than that in the intact male, the former has more body fat content than the latter (Gimenez et al. 1989). It was also reported that castration of bovine shifts transcription of lipid metabolism genes, and intramuscular fat deposition was favored due to an increase of adipogenesis and lipogenesis (Jeong et al. 2013). Furthermore, Prescott and Lamming (1964) and Haddad et al. (2006) have reported that the castrated male sheep has more visceral fat than the intact male. Thus, our results (Tables 6 and 7) suggested that in the CG, the increase of intra-abdominal fat content caused the increase of fat content in the loin, and resulted in the production of juicy meat.
Okinawan people who believe that goat meat is effective to recover from physical exhaustion often eat goat meat dishes as the medicinal foodstuff after farm and construction works (Shimabukuro 1989, Hirakawa 2009).
The functional amino acids and peptides such as taurine and anserine which is effective to recover from physical exhaustion were contained in the loin of NCG and CG. Those contents in NCG were higher than those in the CG. From these facts, it is thought that the meat from non-castrated male goat have larger recovery effect than that from castrated male. Thus, it is assumed that this is the reason for eating non- castrated goat's meat in Okinawa.
The weight of rumen in the CG was about 1.5 times as heavy as that in the NCG (Table 9). The forage intake in the CG was larger than that in the NCG (Table 2). When the goats consumed more forage which contained much fibers, their rumen became more vigorous (Nagamine et al.
2015). Therefore, it was suggested that in the CG, the animals consumed more forage, thereby rumen wall was more stimulated physically and resulted in more vigorous rumen.
Effect of castration on feed intake, blood property, and odor of hair and meat in matured male goats
In the Experiment 2, reduction of feed intake in the NCG was confirmed during breeding season, but no reduction was observed in the CG (Table 11). Female sheep indicates the decrease of feed intake when a copious amount of the estrogen is infused into the lateral ventricle (Forbes 197 4). Nagamine et al. (2013) reported that the male goat also indicated low feed intake during
breeding season. In addition, plasma concentration of testosterone in the male goat increases in the breeding season (Muduuli et al. 1979; Delgadillo et al. 1992). Based on these, it was suggested that plasma testosterone concentration in the NCG during breeding season increased and resulted in low feed intake, while that in the CG was low even for breeding season and feed intake suppression did not occur. Therefore, our result indicated that castration makes it possible to improve low feed intake in male goat during breeding season.
The most of plasma concentrations of lipids in the CG in experiment 2 were higher than those in the NCG (Table 11). Steers show lower proliferation and differentiation in myogenic satellite cells, and higher formation of lipids, and result in increase of serum fatty acid concentrations (Lee et al. 2011). Thus, it is suggested that in the CG, lipid formation rate may become higher and result in increase of plasma concentration of fatty acids.
Odor intensity of the meat in the CG was about 38% of that in the NCG. Components of the peculiar odor are the branched fatty acids such as 4-ethyl octanoic acid and 4-methyl octanoic acid (Madruga et al. 2009). In this experiment, 4-methyl octanoic acid was detected in the NCG but not in the CG (Table 12). Thus, it is suggested that 4-methyl octanoic acid was disappeared by castration in the CG and resulted in low intensity of meat odor (Figure 1).
By the way, half of the animals in the CG of Experiment 2 were also developed the urolithiasis.
Results of an autopsy of the animal who died from severe urolithiasis, it was confirmed that many calculi were accumulated in the bladder.
The diameter of the urethra in male goat becomes smaller by castration and thus the castrated male goat is easy to develop urolithiasis (Kumar et al. 1982). Therefore, it was suggested that the castrated male goat in present study developed urolithiasis due to reduction in the diameter of urethra caused by castration.
In conclusion, it was elucidated that the castration of male goat resulted in lower quality of the meat and reduction of the peculiar odor.
Recently in Okinawa, the number of people who have never eaten the goat meat is increasing because of its peculiar odor. It is necessary to develop the new methods or techniques for reduction of the peculiar odor without a decrease in the meat quality.
Effects of the castration on male goats
Acknowledgments
We thank Dr. Thang Van Thang, Mis. Rutsuko Hazama and Mr. Daiki Nagai for their helpful assistance in experiments and recording the data.
We thank Dr. Takako Tamamura for her helpful assistance in analysis of odor components in meat.
References
Association of Official Analytical Chemists International. 2007. Official methods of analysis, 18th edn. AOAC International, Arlington, VA.
Delgadillo JA, Chemineau P. 1992. Abolition of the seasonal release of luteinizing hormone and testosterone in Alpine male goats (Capra hircus) by short photoperiodic cycles. Journals of Reproduction Fertility 94, 45-55.
Forbes JM. 1974. Feeding in sheep modified by intraventricular estradiol and progesterone.
Physiology & Behavior 12, 741-747.
Gimenez MS, Ponce de Ascheri AM, Elorza de Orellano ME, Oliveros L, Zirulnik de Hodara F, Bonomi MR, Gimenez LA. 1989. Lipids and lipogenic enzymes in adipose tissue of castrated male goats. Lipids 24, 985-987.
Haddad SG, Husein MQ, Sweidan RW. 2006.
Effects of castration on growth performance and carcass characteristics of Awassi lambs fed high concentrate diet. Small Ruminant Research 65, 149-153.
Hirakawa M. 2009. Okinawa de naze yagi ga aisarerunoka. Border ink, Okinawa.
Jeong J, Bong J, Kim GD, Joo ST, Lee HJ, Baik M. 2013. Transcriptome changes favoring intramuscular fat deposition in the longissimus muscle following castration of bulls. Journal of Animal Science 91, 4692-4704.
Kato Y. 1988. Shiryo Bunseki Kijun Chuukai.
Nihon Shiryo Kyoukai, Tokyo.
Kumar R, Kumar A, Singh H, Singh B, Prakash P. 1982. Effect of castration on urethra and accessory sex glands on goats. Indian Veterinary Journal 59, 304-308.
Lee DM, Bajracharya P, Lee EJ, Kim JE, Lee HJ, Chun T, Kim J, Cho KH, Chang J, Hong SK, Choi I. 2011. Effects of gender-specific adult bovine serum on myogenic satellite cell proliferation, differentiation and lipid accumulation. In Vitro Cellular & Developmental Biology - Animal 47, 438-444.
Liptrap RM, Doble E, Cheng KW. 1986. Plasma concentration profiles of gonadotrophins and
testosterone in the adult boar. Canadian Journal of Veterinary Research 50, 427-432.
Madruga MS, Elmore JS, Dodson AT, Mottram DS. 2009. Volatile flavor of goat meat extracted three widely used techniques. Food Chemistry 115, 1081-1087.
Muduuli DS, Sanford LM, Palmer WM, Howland BE. 1979. Secretory patterns and circadian and seasonal changes in luteinizing hormone, follicle stimulating hormone, prolactin and testosterone in the male Pygmy goat. Journal of Animal Science 49, 543-553.
Nagamine I, Sunagawa K, Kishi T. 2012. Use of Awamori-pressed lees and Tofu lees as feed ingredients for growing female goats. Asian- Australasian Journal of Animal Sciences 25, 1701- 1711.
Nagamine I, Sunagawa K, Kina T. 2013. Use of Awamori-pressed lees and Tofu lees as feed ingredients for growing male goats. Asian- Australasian Journal of Animal Sciences 26, 1262- 1275.
Nagamine I, Sunagawa K, Naito Y, Miyahira B, Kawano H. 2015. Use of barley grain as main feed ingredient for growing male goats. Journal of Warm Regional Society of Animal Science 58,
165-178.
National Research Council (US). 2007. Nutrient Requirements of Small Ruminants: Sheep, Goats, Cervids, and New World Camedids, The National Academies Press; Washington, D.C., USA.
Prescott HD, Lamming GE. 1964. The effects of castration on meat production in cattle, sheep and pigs. Journal of Agricultural Science 63, 341- 357.
Price EO, Smith VM, Katz LS. 1986. Stimulus conditions influencing self-enurination, genital grooming and flehmen in male goats. Applied Animal Behaviour Science 16, 371-381.
SAS. 2012. SAS Software for PC. Release 9.3, SAS Institute Inc, Cary, NC.
Sasada H, Sugiyama T, Yamashita K, Masaki J.
1983. Identification of specific odor components in mature male goat during the breeding season.
Japanese Journal of Zootechnical Science 54, 401- 408
Schanbacher BD, Crouse JD, Ferrell CL.
1980. Testosterone influences on growth, performance, carcass characteristics and composition of young market lambs. Journal of Animal Science 51, 685-691.
Shelton M. 1960. Influence of the presence of a male goat on the initiation of estrous cycling
NAGAMINE, SUN A GAW A
and ovulation of angora does. Journal of Animal Science 19, 368-375.
Shimabukuro M. 1989. Okinawa no buta to yagi.
Hirugi-sha, Okinawa.
Smith MC, Sherman DM. 2009. Goat Medicine.
2nd edn. pp. 552-553. Wiley-Blackwell, Ames, Iowa.
Sugiyama T, Matsuura H, Sasada H, Masaki J, Yamashita K. 1986. Characterization of fatty acids in the sebum of goats according to sex and age. Agricultural and Biological Chemistry 50, 3049-3052.
Thang TV, Sunagawa K, Nagamine I, Kishi T, Ogura G. 2012. The main suppressing factors of dry forage intake in large-type goats. Asian- Australasian Journal of Animal Sciences 25, 341- 352.
Zhan P, Tian H, Zhang X, Wang L. 2013.
Contribution to aroma characteristics of mutton process flavor from the enzymatic hydrolysate of sheep bone protein assessed by descriptive sensory analysis and gas chromatography olfactometry. Journal of Chromatography B921- 922, 1-8.
Effects of the castration on male goats
去勢力ゞ雄ヤギの成長、肉生産ならびに臭気に及ほす影響
長嶺樹*.砂川勝徳
琉球大学農学部、沖縄県西原町千原1, 903‑0213
℃ orresponding author. E‑mail address: [email protected]‑ryukyu.ac.jp
要 約
沖縄で雄ヤギの肉が流通しているのは、去勢ヤギの肉質が非去勢ヤギより劣るからであると推測され るが、雄ヤギの去勢が肉質に及ぼす影響は不明である。また、近年、雄ヤギに特有の臭気が原因でヤギ 肉を食べたことがない人が増加しており、臭気の低減が不可欠であるが、雄ヤギの去勢が臭気に及ぼ す影響は不明である。本研究では、雄ヤギの去勢が肉質と臭気に及ぼす影響を解明するために2つの 実験を行った。実験1では、ヤギ(日本ザーネンXヌビアンの交雑種、 3ヵ月齢、試験開始時平均体重 20.7kg) を6頭ずつ2群(非去勢群および去勢群:以下、 NCGおよびCG)に配置した。 CGのヤギ は2.5ヵ月齢時に去勢された。 9ヵ月間、ヤギには配合飼料とアルファルファヘイキューブを 1日2回 (10:00および16:00)給与し、クレイングラス乾草と飲水を不断給与した。体重と体尺を毎月測定した。
1歳齢時にヤギを屠殺し、枝肉成績とロース肉の理化学的特性を調べた。実験2では、ヤギ(実験1と 同品種、 2歳齢、試験開始時平均体重85.1kg) を4頭ずつ2群 (NCGおよびCG)に配置した。 8ヵ 月間、ヤギには10:00にアルファルファヘイキューブ、 16:00に配合飼料とクレイングラス乾草を給与 した。飲水を不断給与した。採食量を毎日測定し、肉の臭気度を計測した。 CGのヤギの腹腔内脂肪重 量はNCGのそれより重かった (p<0.05)。CGの肉中のタウリンなどの機能性成分の含量はNCGのそ れらより少なかった (p<0.05)。CGの肉の臭気度はNCGのそれより低かった (p<0.05)。本研究の結果、
雄ヤギの去勢は肉質を低下させ、臭気を低減できることが示された。
キーワード:雄ヤギ、去勢、臭気成分、成長、肉生産
Animal Behaviour and Management, 53 (4): 137‑150, 2017 (2017. 5. 29受付; 2017. 7. 26受理)