LAKE WHATCOM COMPREHENSIVE PLAN:
STORMWATER CAPITAL PROGRAM UPDATE
WHATCOM COUNTY, WASHINGTON
P
REPARED FOR
W
HATCOM
C
OUNTY
P
UBLIC
W
ORKS
Prepared by
Note:
STORMWATER CAPITAL PROGRAM UPDATE
WHATCOM COUNTY, WASHINGTON
Prepared for
Whatcom County Public Works
322 North Commercial Street, Suite 301
Bellingham, Washington 98225
Prepared by
Herrera Environmental Consultants, Inc.
2200 Sixth Avenue, Suite 1100
C
ONTENTS
Introduction... 1
Capital Project Identification and Prioritization ... 3
Stormwater Capital Project Identification Approach ... 3
Stream Restoration Capital Project Identification Approach ... 9
Capital Project Prioritization ... 11
Programmatic and Small Works Solutions ... 21
Forest Practices ... 21
Problem Description ... 21
Problem Solution and Benefits ... 22
Implementation Steps ... 23
Planning Level Cost Estimate ... 24
Alluvial Fans and Basin-Scale Studies for Sediment and Landscape Management and Maintenance ... 24
Problem Description ... 25
Problem Solution and Benefits ... 26
Implementation Steps ... 26
Planning Level Cost Estimate ... 26
Expanding Protection of Creek Riparian Corridors in Residential Areas ... 27
Problem Description ... 27
Problem Solution and Benefits ... 27
Implementation Steps ... 28
Planning Level Cost Estimate ... 28
Ditch Retrofits ... 28
Problem Description ... 28
Problem Solution and Benefits ... 29
Implementation Steps ... 29
Planning Level Cost Estimate ... 30
Sudden Valley Capital Stormwater Management Strategies ... 31
Stormwater Capital Project Coordination ... 31
Sudden Valley Golf Course Creek Restoration Planning Study ... 32
Education and Outreach ... 36
ii
pjj 15-06048-000_lakewhatcom_swcapitalprogramupdate.docx
A
PPENDICES
Appendix A Field Reconnaissance Documentation for Proposed Stormwater Capital Projects Appendix B Summary Sheets for Proposed Stormwater Capital Projects
Appendix C Supporting Tables and Figures for Estimating Stream Restoration Capital Project Phosphorus Removal Benefit and Costs
Appendix D Summary Sheets for Proposed Stream Restoration Projects Appendix E Predesign Reports
Appendix F Ditch Retrofit Program Development Guidance
Appendix G Comments from Sudden Valley Community Association on Draft Plan Update
T
ABLES
Table 1. Retrofit Facility Phosphorus Removal Rates ... 5
Table 2. Normalized Construction Cost by Facility Type. ... 6
Table 3. Scores for Attributes Used in Project Prioritization. ... 12
Table 4. Proposed Capital Project Prioritization Information. ... 17
Table 5. Cost Estimate for Programmatic Review of Forest Practices. ... 24
Table 6. Cost Estimate for Retrofitting Ditches. ... 30
F
IGURES
Figure 1. Location of Proposed Stormwater Capital Projects in the Lake Whatcom Watershed with Priority Rank. ... 7Figure 2. Location of Potential Stream Erosion Sites in the Lake Whatcom Watershed. ... 10
Figure 3. Location of Proposed Stream Restoration Capital Projects in the Lake Whatcom Watershed with Priority Rank. ... 13
Figure 4. Stream Erosion Site Reconnaissance Photos of South Bay Drive Crossings of Brannian Creek and Smith Creek. ... 25
Figure 5. Location of Proposed Stormwater Capital Projects in Sudden Valley with Priority Rank. ... 33
INTRODUCTION
In 2008, Whatcom County Public Works completed the Lake Whatcom Comprehensive
Stormwater Plan (Plan) that analyzed threats to water quality and watershed health and provided recommended solutions to protect Lake Whatcom. Whatcom County Public Works has
subsequently used the Plan to guide water quality treatment project identification and
prioritization. However, all capital projects identified in the Plan have either been built or are on the County’s current 6-year capital project plan that is being implemented through the Water Resources Improvement Program (Program).
To guide future planning efforts under the Program, Whatcom County Public Works and Herrera Environmental Consultants (Herrera) undertook an effort to update the capital project section of the Plan. Through that effort, potential water quality treatment capital projects were identified and evaluated, and a prioritized list of proposed projects was developed. All of the proposed capital projects are within the unincorporated portion of the Lake Whatcom watershed, which is under Whatcom County jurisdiction. Results of the Plan update project (project) are presented in this document, which updates the capital project section of the Plan.
Because the Program’s water quality treatment goals are largely driven by phosphorus reduction targets that stem from the Total Maximum Daily Load (TMDL) studies that were performed on Lake Whatcom and the associated water quality improvement implementation strategy (Ecology 2016a), the selection of new capital projects was focused on the goal of reducing phosphorus loading to the lake. (While not specifically addressed in this Plan update, it should be noted that many of these projects will also be effective at reducing fecal coliform bacteria loading to the lake as required by the water quality improvement implementation strategy.) The process used to identify new capital projects included the following steps, which are described in more detail within subsequent sections.
•
Collection of information on known surface water problems and possible water quality treatment capital projects from the public and Lake Whatcom Management Program partners.•
Extensive field reconnaissance to identify new stormwater and stream restoration capital projects to improve water quality.•
Engineering analyses to develop conceptual designs for proposed capital projects.•
Evaluation and prioritization of the proposed capital projects based on planning-level cost estimates and estimated phosphorus load reductions.CAPITAL PROJECT IDENTIFICATION AND
PRIORITIZATION
New capital projects were identified to achieve the goal of reducing phosphorus loading to Lake Whatcom from stormwater runoff and channel erosion in unstable stream reaches that are tributary to the lake. The subsections below describe: 1) the approaches used to identify proposed capital projects for stormwater treatment retrofits and stream restoration to target those sources of phosphorus loading, and 2) how the projects were prioritized for
implementation.
S
TORMWATER
C
APITAL
P
ROJECT
I
DENTIFICATION
A
PPROACH
To identify stormwater capital projects, the first step was to gather information from meetings with Whatcom County Public Works staff, existing documents, available geographic information systems (GIS) data, and aerial photos. The information consisted of locations of potential
flooding, potential areas with high nutrient concentrations in stormwater runoff given the prevailing land uses, conveyance convergences, high impervious surface coverage, erosion or scour, high maintenance burden, and inadequate conveyance capacity.
Field investigations, or windshield surveys, were subsequently conducted to further evaluate and gather additional information about all locations identified in the first step. Other locations that appeared to be opportunities for stormwater treatment retrofits were added to the map along with pictures and criteria about the potential benefits or obstacles of retrofit projects in those locations. Information from the field investigations for each location was stored in a web-based map and data collection tool via handheld computers that were carried by the field personnel. Through this approach, 22 potential capital project locations throughout the unincorporated portion of the Lake Whatcom watershed were identified. Output from the web-based map and data collection tool for those projects is documented in Appendix A. Another 10 capital projects previously identified by Whatcom County Public Works, but not yet planned or constructed, were added to this list.
September 2017
4 Lake Whatcom Comprehensive Plan: Stormwater Capital Program Update
A combined total of 47 potential stormwater capital projects were identified and evaluated for consistency with project goals. Out of those, 30 projects were recommended for further
evaluation and prioritization. The 17 projects not recommended for evaluation were eliminated for one of the following reasons.
•
The project is a private property drainage issue where Whatcom County does not have jurisdiction.•
The project will be addressed with actions currently planned by Whatcom County.•
The project will be addressed with actions currently planned by private developers.•
The project will be evaluated as a stream channel or bank restoration capital project. The 30 stormwater capital projects recommended for further evaluation were evaluated for consistency with the project goals, construction and permitting feasibility, water quality benefit, and other criteria, which included:•
Estimated drainage basin size•
Tributary land use•
Estimated impervious surface area (percentage of total basin)•
Estimated lawn area (percentage of total basin)•
Site use intensity•
Type of use (residential/commercial/other)•
Existing stormwater treatment devices•
Property ownership (public/private)•
Feasibility based on topography•
Wildlife habitat benefit•
Educational/Public outreach benefit•
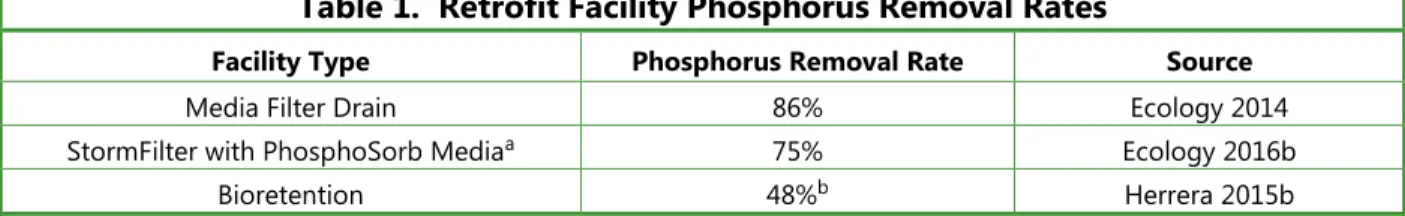
Aesthetic benefitMedia filter drains were prioritized for stormwater treatment retrofit applications in the public right-of-way where the existing roadside stormwater conveyance system is primarily ditches. To the extent possible, the media filter drains for this application were sized to treat runoff from both the roadway and the upland areas adjacent to the roadway. Because of the linear configuration of these facilities, they were also prioritized for stormwater treatment retrofit applications along the shoreline of Lake Whatcom. Media filter drains were generally preferred over the other facility types identified above because they have been shown to be highly
effective at removing phosphorus (Table 1), have relatively low construction costs, and have low maintenance requirements. However, alternative facility types might be considered once the stormwater capital project is prioritized for construction and additional public input is obtained on the proposed design.
Table 1. Retrofit Facility Phosphorus Removal Rates
Facility Type Phosphorus Removal Rate Source
Media Filter Drain 86% Ecology 2014
StormFilter with PhosphoSorb Mediaa 75% Ecology 2016b
Bioretention 48%b Herrera 2015b
a Proprietary stormwater treatment system manufactured by Contech Engineered Solutions.
b Phosphorus removal rate reflects the performance of a custom media bend selected by Whatcom County Public Works for application in the Lake Whatcom watershed with the following components: 70 percent volcanic sand, 20 percent coconut coir pith, and 10 percent high carbon wood ash.
StormFilters with PhosphoSorb Media were prioritized for stormwater treatment retrofit applications in the public right-of-way where the existing roadside stormwater conveyance system is primarily pipes. These facilities were preferred in this application because they are typically installed in vaults that can be integrated with the existing stormwater conveyance system with relative ease, have low space requirements, and are not readily visible to the public. The primary drawback of these facilities is they are less effective at removing phosphorus relative to the media filter drains (Table 1) and have more complex and costly maintenance requirements.
Bioretention was prioritized for stormwater retrofit applications at locations where high
infiltration rates to native soils were expected based on the available geotechnical information. Because these facilities incorporate aesthetically pleasing vegetation, they were also prioritized for parks and other settings that are highly visible to the public. The primary drawback of these facilities is they are less effective at removing phosphorus relative to the facilities described above in locations where high infiltration rates to native soils cannot be achieved (Table 1). The water quality benefit of the 30 proposed stormwater capital projects was subsequently estimated, based on the following steps.
1. The drainage area for each project was delineated into three land cover types:
September 2017
6 Lake Whatcom Comprehensive Plan: Stormwater Capital Program Update
for the drainage area using representative areal loading rates for each land cover type (Wilson Engineering 2016):
o 0.09 pound per acre for forest cover o 1.15 pounds per acre for lawn cover o 0.76 pound per acre for impervious cover
2. The average annual volume treated and bypassed for each project was estimated, based on modeling performed using MGS Flood version 4.38 software (a hydrologic model developed for Western Washington). The proportion of the annual phosphorus load from the project’s drainage area that would be treated was then determined based on the output.
3. A representative phosphorus removal rate was applied to the treated proportion of the annual phosphorus load, based on the anticipated performance of the proposed treatment facility (see Table 1). The resultant values were used to represent the phosphorus removal benefit of the proposed capital projects.
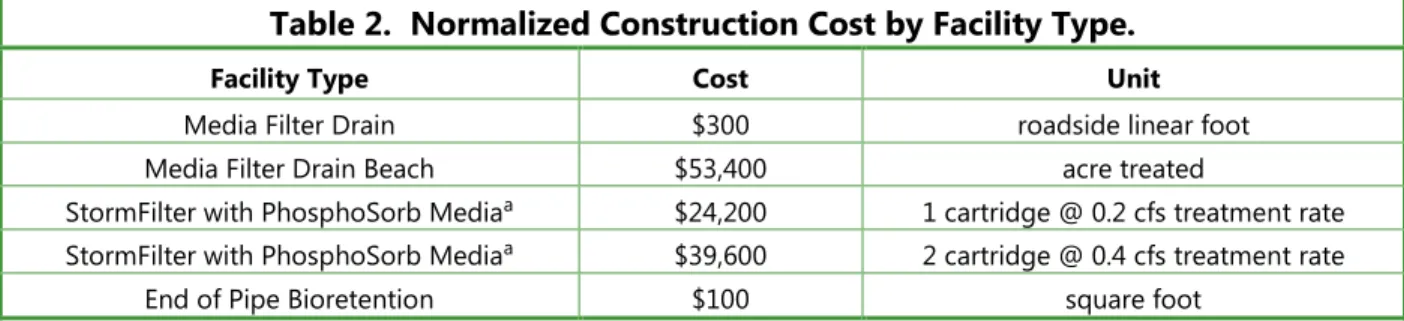
A planning-level construction cost was estimated for each proposed capital project based on typical costs from other similar projects that have been constructed in the region and vendor quotes (Table 2). These costs also consider costs for design and construction management.
Table 2. Normalized Construction Cost by Facility Type.
Facility Type Cost Unit
Media Filter Drain $300 roadside linear foot
Media Filter Drain Beach $53,400 acre treated
StormFilter with PhosphoSorb Mediaa $24,200 1 cartridge @ 0.2 cfs treatment rate
StormFilter with PhosphoSorb Mediaa $39,600 2 cartridge @ 0.4 cfs treatment rate
End of Pipe Bioretention $100 square foot
a Propriety stormwater treatment system manufactured by Contech Engineered Solutions. cfs = cubic feet per second
Lake
Whatcom
#2
#16
#12
#1
#4
#6
#3
#20
#10
#22
#29
#9
#17
#5
#7
#14
#27
#35
#28
#18
#15
#19
#24
#13
#23
#11
#21
#26
#8
#30
Y R
D
SAM ISH W
AY
PARK RD LA K E W H AT C O M B LV D NO R TH SHO R E R D LA K
E LO U
IS E RD
LAKEWAY DR 4 0 T H S T
OLD SAMISH RD
VALL EY H
WY WO B U R N ST ALABAMA ST SOUT H BAY
DR E SUN
SET D R
JA
M
E
S S
LIN CO
LN ST
YE W S
T RE ET RD P U G E T ST K E RD IOWA ST Y E
W S
T
W LA
K E SA
FRASER ST HA N N E G
N L AK E S A MIS H D R MT BAKE IR O N GA T E C HA N DL ER P KW
Y MCLEOD RD
WILKIN ST B R ITT O N R D KIN G S T V A LL E Y H WY
Capital Projects in the
Lake
Whatcom Watershed with
Priority
Rank.
0 0.5 1 2
Miles
Legend
Proposed BMP Locations
Proposed Stormwater Basins City of Bellingham
Bioretention
Media Filter Drain
Stormfilter
Streams
S
TREAM
R
ESTORATION
C
APITAL
P
ROJECT
I
DENTIFICATION
A
PPROACH
Recent studies suggest a positive correlation between watershed soils and phosphorus loading to Lake Whatcom, and have found that most of the phosphorus transported to the lake during high streamflow events likely comes from watershed soils (Groce 2011; Liang 1994). As a result, extensive field reconnaissance and analyses were performed in an effort to identify, evaluate, and develop conceptual capital projects for restoring unstable stream reaches that are actively eroding and exacerbating both sediment and phosphorus loading to Lake Whatcom.
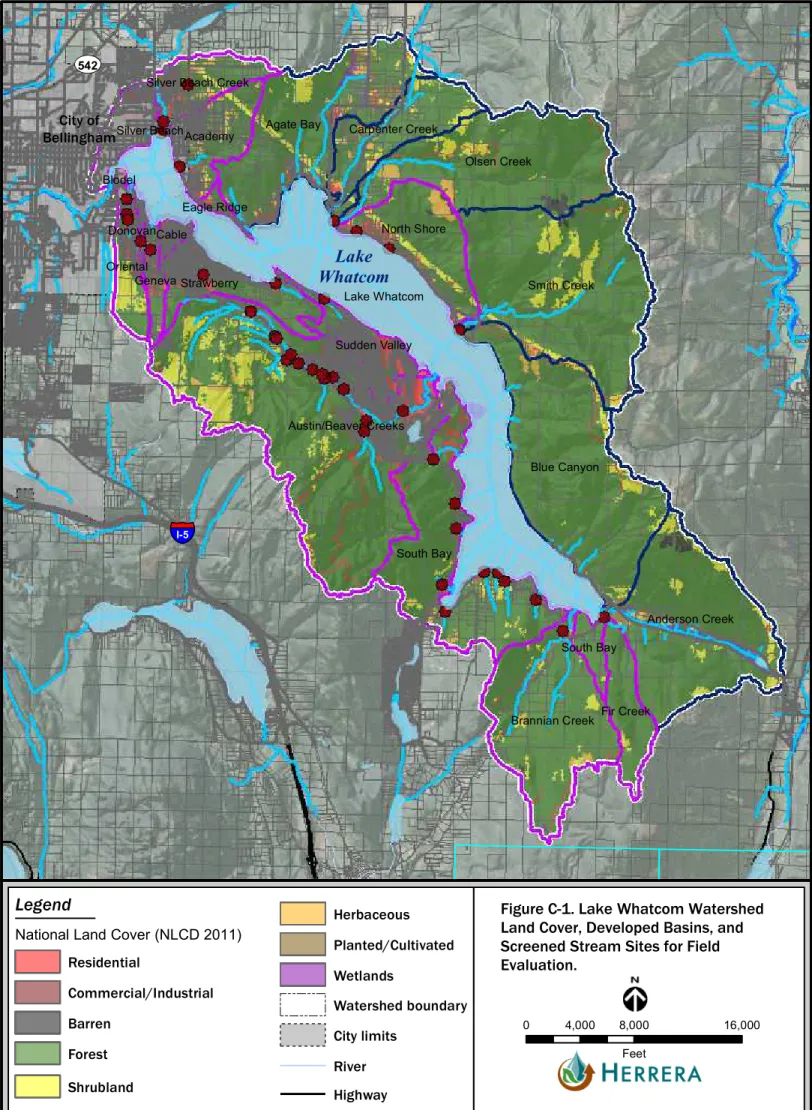
Lacking a watershed-wide stream inventory, a comprehensive GIS-based screening analysis was undertaken to identify potential erosive stream sites for further rapid field assessment. Given the chronic trend of stream channel and bank destabilization resulting from watershed hydrologic change, the first step of the screening analysis entailed identifying major subbasins in the overall Lake Whatcom watershed that were characterized by enough development to likely exhibit some erosion or stability impacts. Digital GIS shapefiles of watershed zoning designations (Whatcom County 2016a) and the 2011 National Land Cover Dataset (NLCD; Homer et al. 2015) were both evaluated. A shapefile of the major subbasins in the watershed, provided by
Whatcom County, was intersected with the zoning and NLCD datasets to evaluate the percentage of developed area in each subbasin. For the zoning dataset, the subbasin area considered to be developed was taken as the sum of the Industrial, the Incorporated, and the Urban Growth Area zone types. For the NLCD dataset, the subbasin area considered to be developed was taken as the sum of the Commercial and Residential land cover types. All
subbasins with 10 percent or greater developed area, according to either dataset, were included in the next stage of the screening; subbasins with less than 10 percent developed area were screened out.
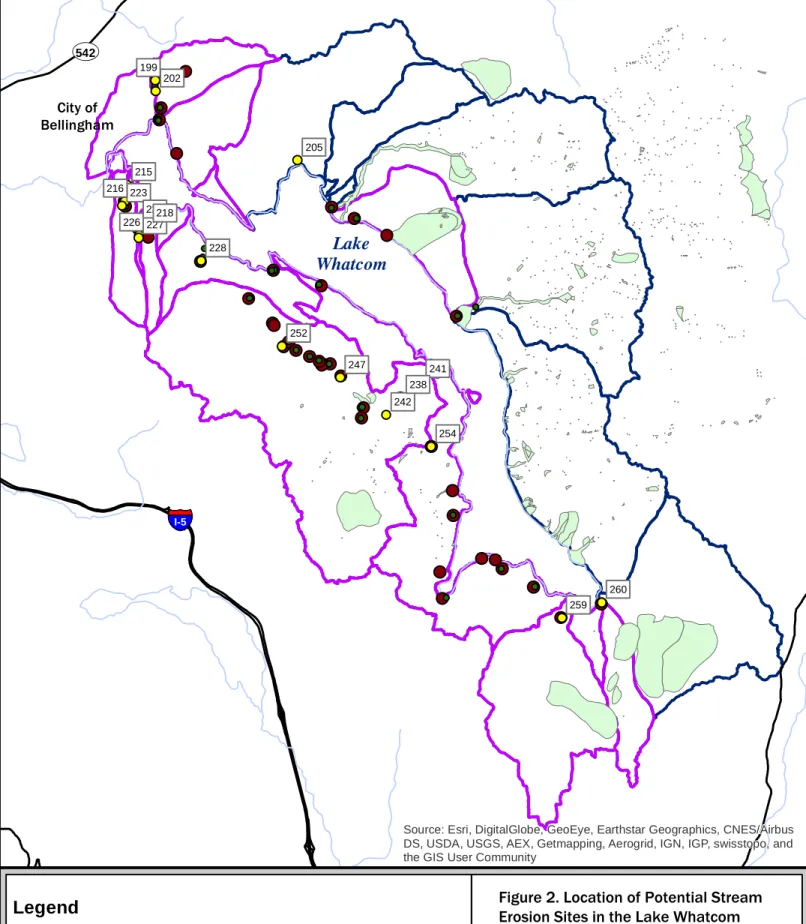
The second step of the analysis involved identifying potential project sites that could be quickly visited and evaluated during a rapid field reconnaissance. A GIS-based evaluation was
conducted using both Whatcom County and City of Bellingham stream, roadway, and parcel shapefiles to locate stream channels within the developed subbasins and then locate road crossings of streams and other features (such as parks or golf courses) where streams flowed through publicly accessible open spaces. Northings and eastings were identified, and a map was created (Figure 2) of 42 potential stream erosion sites for field follow-up.
On September 9, 2016, a rapid field reconnaissance of all accessible stream erosion sites was conducted to assess potential problems. If eroding streambed or stream bank conditions were observed, notes, photos, and global positioning system (GPS) data were collected to
characterize the extent and type of erosion. Some of the visited sites dropped from the proposed stream capital project list because either: 1) they did not display evidence of
Lake
Whatcom
City ofBellingham
U
V
542§
¨
¦
I-5260 259 254
252
247
242 241 228
227 226
223 216
215
205 202
199
238 221218
Source: Esri, DigitalGlobe, GeoEye, Earthstar Geographics, CNES/Airbus DS, USDA, USGS, AEX, Getmapping, Aerogrid, IGN, IGP, swisstopo, and the GIS User Community
Figure 2. Location of Potential Stream Erosion Sites in the Lake Whatcom Watershed.
K:\Projects\Y2015\15-06048-000\Project\GIS_Working\Stream_Sites_watershed_land_use_DRAFT.mxd (9/22/2016)
0 4,000 8,000 16,000
Feet
Legend
Preliminary Stream CIPs
2016-09-09 Stream GPS
Initial 42 Screened Stream Sites
Screened Developed Watersheds
Whatcom Subbasins
All the stream erosion sites were then qualitatively evaluated according to the project goals, construction and permitting feasibility for restoration projects, anticipated water quality benefit, and other criteria such as land ownership and overall suitability for a capital project or an
operations and maintenance project. Based on the evaluation, nine proposed stream restoration capital projects were identified for further evaluation and prioritization.
Estimates of phosphorus removal benefit and project development and construction costs were calculated to support further conceptual project development and prioritization ranking for the nine proposed stream restoration capital projects. Field notes of the channel geometry, likely ordinary high water line, presence or absence of vegetation, exposed soils, and the extents of erosion were used as inputs into the United States Department of Agriculture’s (USDA’s) Bank Stability and Toe Erosion Model (BSTEM) Version 5.4. This model enables an estimation of the potential bank retreat, or erosion, that might be expected in the future along the chronically or actively unstable banks identified during the field reconnaissance. The modeled output of annual volume of eroded material was then related to an estimate of the relative weight of phosphorus to soil (Ecology 2007; Groce 2011) to support an estimate of the annual phosphorus loading associated with the stream and bank erosion. For the conceptual project analysis and prioritization, it was assumed that the proposed stream restoration projects would control only specific erosion problems and result in 100 percent reduction in the phosphorus loading from the specific erosion problem identified at each potential project site. This approach does not attempt to stop all natural forms of channel change, but rather, acknowledges that streams are naturally dynamic and constantly changing and that there are background levels of erosion and associated phosphorus loading that cannot be addressed with the proposed stream restoration projects. To generate project-level cost estimates, the conceptual project areas, lengths, and extents were estimated in GIS and related to construction bid tabs for similar projects recently constructed in Western Washington. The supporting tables and figures from the analysis are included in Appendix C.
Information on the proposed stream restoration capital projects was subsequently documented on one-page summary sheets. Included on each summary sheet is a brief description of existing conditions at the project site, the proposed improvements, and the key information used for project prioritization. The one-page summary sheets for all nine stream restoration capital projects identified through the process are provided in Appendix D. Figure 3 shows the locations of the nine projects within the Lake Whatcom watershed.
C
APITAL
P
ROJECT
P
RIORITIZATION
The proposed stormwater and stream restoration projects described above were collectively prioritized for implementation based on scores that were assigned to the following project attributes:
Cost Effectiveness: The cost effectiveness of each project was assessed by dividing its estimated cost by its phosphorus removal benefit. Projects with lower values from this
September 2017
12 Lake Whatcom Comprehensive Plan: Stormwater Capital Program Update
being more cost-effective for achieving the goal of reducing phosphorus loading to Lake Whatcom.
Total Benefit: The total benefit of each project was assessed based on its estimated
phosphorus removal regardless of its cost. Projects with higher values (expressed in pounds of phosphorus removed per year) were identified as having a greater effect on reducing
phosphorus loading to Lake Whatcom. This attribute was included in the prioritization to balance out situations where a project might prove highly cost-effective but provide very little benefit in terms of the total amount of phosphorus removed.
Feasibility: The feasibility of each project was assessed by documenting known property access and/or permitting issues that would likely create barriers to implementation.
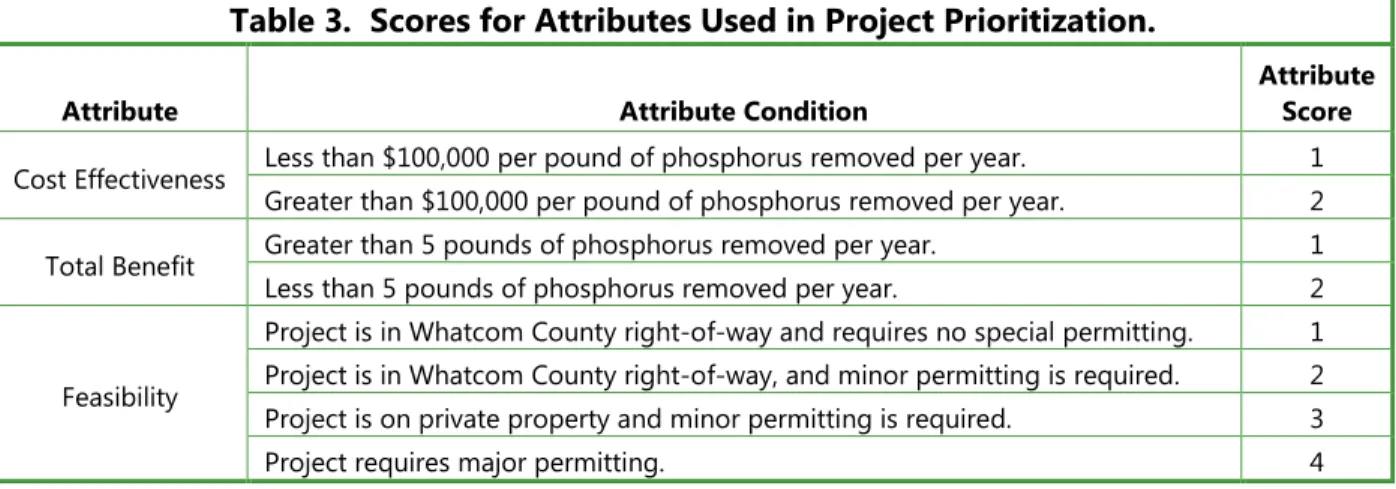
Table 3 shows the scores assigned to each attribute considered. Lower scores indicate higher benefit.
Table 3. Scores for Attributes Used in Project Prioritization.
Attribute Attribute Condition
Attribute Score
Cost Effectiveness Less than $100,000 per pound of phosphorus removed per year. 1
Greater than $100,000 per pound of phosphorus removed per year. 2
Total Benefit Greater than 5 pounds of phosphorus removed per year. 1
Less than 5 pounds of phosphorus removed per year. 2
Feasibility
Project is in Whatcom County right-of-way and requires no special permitting. 1 Project is in Whatcom County right-of-way, and minor permitting is required. 2
Project is on private property and minor permitting is required. 3
Project requires major permitting. 4
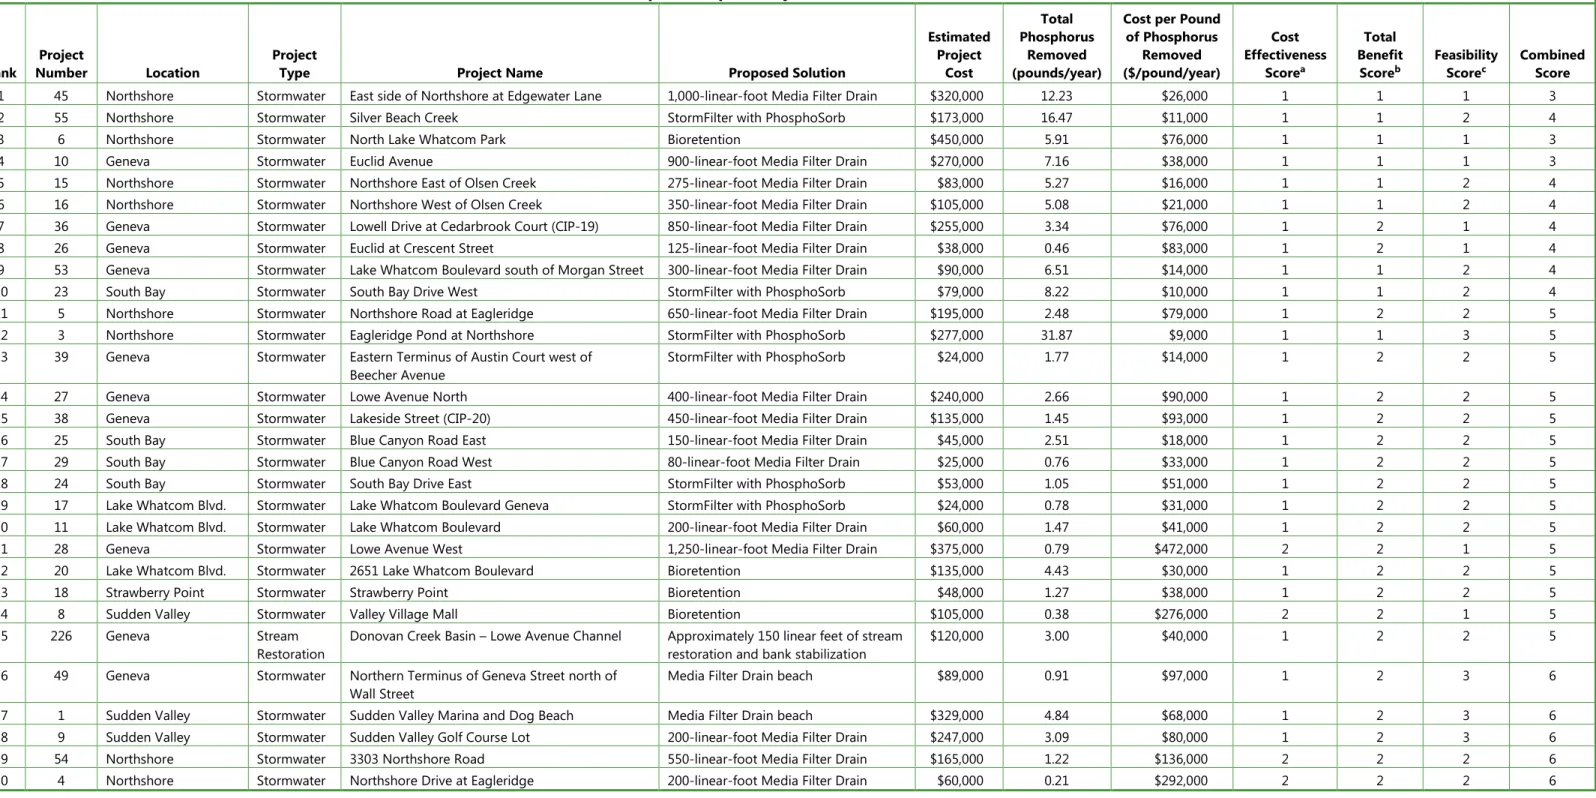
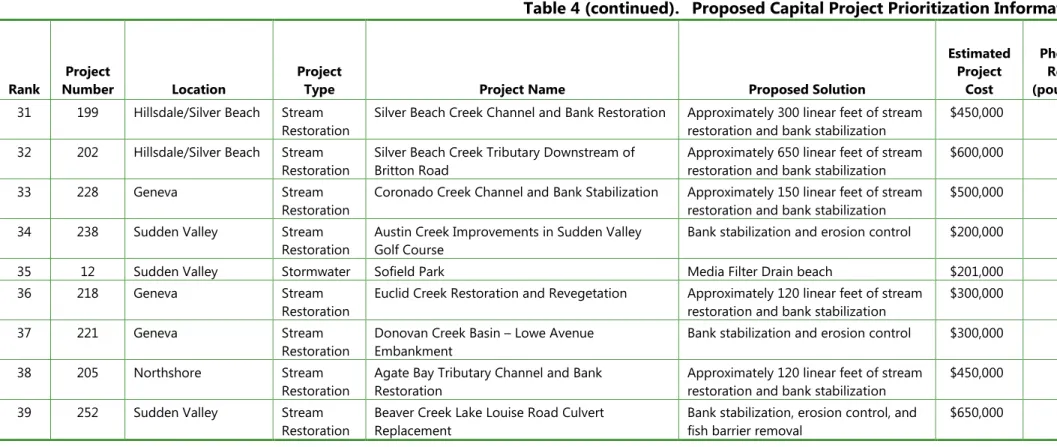
The individual scores for each attribute were summed to obtain a combined score for each proposed capital project. Projects with lower combined scores are the most attractive based on all three attributes. As shown in Table 4, the proposed stormwater and creek restoration capital projects (39 projects in total) were subsequently ranked in priority order based on the overall scores. These same ranks are also used to identify the location of each project in Figures 1 and 3, and organize the one-page summary sheets for each project sequentially in Appendices A and C.
More detailed predesign reports, including cost estimates and a refined conceptual design, were developed for the following projects that were prioritized based on these ranks and the County’s existing 6-year capital project plan:
•
East side of Northshore @ Edgewater Ln. – Rank 1^
_
^
_
^
_
^
_
^
_
^
_
^
_
^
_
^
_
Lake
Whatcom
# 39 # 34 # 33 # 25 # 37 # 36 # 38 # 32 # 31Y R
D
SAM ISH W
AY
PARK RD LA K E W H AT C O M B LV D NO R TH SHO R E R D LA K
E LO U
IS E RD
LAKEWAY DR 4 0 T H S T
OLD SAMISH RD
VALL EY H
WY WO B U R N ST ALABAMA ST SOUT H BAY
DR E SUN
SET D R
JA
M
E
S S
LIN CO
LN ST
YE W S
T RE ET RD P U G E T ST K E RD IOWA ST Y E
W S
T
W LA
K E SA
ELE CTR
IC A VE FRASER ST HA N N E G
N L AK E S A MIS H D R N O R TH S H O R E D R MT BAKE IR O N GA T E C HA N DL ER P KW
Y MCLEOD RD
WILKIN ST KIN G S T V A LL E Y H WY
Restoration Capital Projects in the
Lake Whatcom Watershed with
Priority Rank.
City of Bellingham Streams
Water Bodies
Legend
0 0.5 1 2
Miles
^
The predesign reports are specifically tailored to address application requirements for grants provided by the Washington State Department of Ecology to fund full design and/or
construction of stormwater treatment retrofit projects. These predesign reports can be found in Appendix E.
It should be noted that the approached described herein to prioritize proposed capital projects for implementation differs from the approach that was used previously in the Plan. As described in Appendix B of the Plan, this previous approach prioritized capital projects based on a
Table 4. Proposed Capital Project Prioritization Information.
Rank
Project
Number Location
Project
Type Project Name Proposed Solution
Estimated Project Cost Total Phosphorus Removed (pounds/year)
Cost per Pound of Phosphorus Removed ($/pound/year) Cost Effectiveness Scorea Total Benefit Scoreb Feasibility Scorec Combined Score
1 45 Northshore Stormwater East side of Northshore at Edgewater Lane 1,000-linear-foot Media Filter Drain $320,000 12.23 $26,000 1 1 1 3
2 55 Northshore Stormwater Silver Beach Creek StormFilter with PhosphoSorb $173,000 16.47 $11,000 1 1 2 4
3 6 Northshore Stormwater North Lake Whatcom Park Bioretention $450,000 5.91 $76,000 1 1 1 3
4 10 Geneva Stormwater Euclid Avenue 900-linear-foot Media Filter Drain $270,000 7.16 $38,000 1 1 1 3
5 15 Northshore Stormwater Northshore East of Olsen Creek 275-linear-foot Media Filter Drain $83,000 5.27 $16,000 1 1 2 4
6 16 Northshore Stormwater Northshore West of Olsen Creek 350-linear-foot Media Filter Drain $105,000 5.08 $21,000 1 1 2 4
7 36 Geneva Stormwater Lowell Drive at Cedarbrook Court (CIP-19) 850-linear-foot Media Filter Drain $255,000 3.34 $76,000 1 2 1 4
8 26 Geneva Stormwater Euclid at Crescent Street 125-linear-foot Media Filter Drain $38,000 0.46 $83,000 1 2 1 4
9 53 Geneva Stormwater Lake Whatcom Boulevard south of Morgan Street 300-linear-foot Media Filter Drain $90,000 6.51 $14,000 1 1 2 4
10 23 South Bay Stormwater South Bay Drive West StormFilter with PhosphoSorb $79,000 8.22 $10,000 1 1 2 4
11 5 Northshore Stormwater Northshore Road at Eagleridge 650-linear-foot Media Filter Drain $195,000 2.48 $79,000 1 2 2 5
12 3 Northshore Stormwater Eagleridge Pond at Northshore StormFilter with PhosphoSorb $277,000 31.87 $9,000 1 1 3 5
13 39 Geneva Stormwater Eastern Terminus of Austin Court west of
Beecher Avenue
StormFilter with PhosphoSorb $24,000 1.77 $14,000 1 2 2 5
14 27 Geneva Stormwater Lowe Avenue North 400-linear-foot Media Filter Drain $240,000 2.66 $90,000 1 2 2 5
15 38 Geneva Stormwater Lakeside Street (CIP-20) 450-linear-foot Media Filter Drain $135,000 1.45 $93,000 1 2 2 5
16 25 South Bay Stormwater Blue Canyon Road East 150-linear-foot Media Filter Drain $45,000 2.51 $18,000 1 2 2 5
17 29 South Bay Stormwater Blue Canyon Road West 80-linear-foot Media Filter Drain $25,000 0.76 $33,000 1 2 2 5
18 24 South Bay Stormwater South Bay Drive East StormFilter with PhosphoSorb $53,000 1.05 $51,000 1 2 2 5
19 17 Lake Whatcom Blvd. Stormwater Lake Whatcom Boulevard Geneva StormFilter with PhosphoSorb $24,000 0.78 $31,000 1 2 2 5
20 11 Lake Whatcom Blvd. Stormwater Lake Whatcom Boulevard 200-linear-foot Media Filter Drain $60,000 1.47 $41,000 1 2 2 5
21 28 Geneva Stormwater Lowe Avenue West 1,250-linear-foot Media Filter Drain $375,000 0.79 $472,000 2 2 1 5
22 20 Lake Whatcom Blvd. Stormwater 2651 Lake Whatcom Boulevard Bioretention $135,000 4.43 $30,000 1 2 2 5
23 18 Strawberry Point Stormwater Strawberry Point Bioretention $48,000 1.27 $38,000 1 2 2 5
24 8 Sudden Valley Stormwater Valley Village Mall Bioretention $105,000 0.38 $276,000 2 2 1 5
25 226 Geneva Stream
Restoration
Donovan Creek Basin – Lowe Avenue Channel Approximately 150 linear feet of stream restoration and bank stabilization
$120,000 3.00 $40,000 1 2 2 5
26 49 Geneva Stormwater Northern Terminus of Geneva Street north of
Wall Street
Media Filter Drain beach $89,000 0.91 $97,000 1 2 3 6
27 1 Sudden Valley Stormwater Sudden Valley Marina and Dog Beach Media Filter Drain beach $329,000 4.84 $68,000 1 2 3 6
28 9 Sudden Valley Stormwater Sudden Valley Golf Course Lot 200-linear-foot Media Filter Drain $247,000 3.09 $80,000 1 2 3 6
29 54 Northshore Stormwater 3303 Northshore Road 550-linear-foot Media Filter Drain $165,000 1.22 $136,000 2 2 2 6
Table 4 (continued). Proposed Capital Project Prioritization Information.
Rank
Project
Number Location
Project
Type Project Name Proposed Solution
Estimated Project Cost Total Phosphorus Removed (pounds/year)
Cost per Pound of Phosphorus Removed ($/pound/year) Cost Effectiveness Scorea Total Benefit Scoreb Feasibility Scorec Combined Score
31 199 Hillsdale/Silver Beach Stream Restoration
Silver Beach Creek Channel and Bank Restoration Approximately 300 linear feet of stream restoration and bank stabilization
$450,000 6.00 $75,000 1 1 4 6
32 202 Hillsdale/Silver Beach Stream Restoration
Silver Beach Creek Tributary Downstream of Britton Road
Approximately 650 linear feet of stream restoration and bank stabilization
$600,000 8.00 $75,000 1 1 4 6
33 228 Geneva Stream
Restoration
Coronado Creek Channel and Bank Stabilization Approximately 150 linear feet of stream restoration and bank stabilization
$500,000 7.00 $71,000 1 1 4 6
34 238 Sudden Valley Stream
Restoration
Austin Creek Improvements in Sudden Valley Golf Course
Bank stabilization and erosion control $200,000 8.00 $25,000 1 1 4 6
35 12 Sudden Valley Stormwater Sofield Park Media Filter Drain beach $201,000 1.56 $129,000 2 2 3 7
36 218 Geneva Stream
Restoration
Euclid Creek Restoration and Revegetation Approximately 120 linear feet of stream restoration and bank stabilization
$300,000 5.00 $60,000 1 2 4 7
37 221 Geneva Stream
Restoration
Donovan Creek Basin – Lowe Avenue Embankment
Bank stabilization and erosion control $300,000 3.00 $100,000 1 2 4 7
38 205 Northshore Stream
Restoration
Agate Bay Tributary Channel and Bank Restoration
Approximately 120 linear feet of stream restoration and bank stabilization
$450,000 4.00 $113,000 2 2 4 8
39 252 Sudden Valley Stream
Restoration
Beaver Creek Lake Louise Road Culvert Replacement
Bank stabilization, erosion control, and fish barrier removal
$650,000 3.00 $217,000 2 2 4 8
a The Cost Effectiveness Score is assigned based on:
1 Less than $100,000 per pound of phosphorus removed per year. 2 Greater than $100,000 per pound of phosphorus removed per year.
b The Total Benefit Score is assigned based on:
1 Greater than 5 pounds of phosphorus removed per year. 2 Less than 5 pounds of phosphorus removed per year.
c The Feasibility Score is assigned based on:
1 Project is on County right-of-way and requires no special permitting. 2 Project is on County right-of-way and minor permitting is required. 3 Project is on private property and minor permitting is required. 4 Project requires major permitting.
PROGRAMMATIC AND SMALL WORKS
SOLUTIONS
In addition to implementing the proposed suite of capital projects recommended by this Plan update, there are several programmatic, non-structural approaches for reducing phosphorus loading to Lake Whatcom that Whatcom County could pursue, and continue to pursue, in tandem with capital projects. Those programmatic solutions could include policies, coordination strategies, ordinances, educational efforts, and maintenance practices. For this update to the capital project section of the Plan, four programmatic and small works recommendations for phosphorus reduction are emphasized:
1. Forest Practices
2. Alluvial Fans and Basin-Scale Studies of Sediment Loading and Management 3. Expanding Protection of Creek Riparian Corridors in Residential Areas
4. Ditch Retrofits
F
OREST
P
RACTICES
Although this Plan update is focused on stormwater generated in the more developed portions of the watershed, the dominant land use type in the watershed is forestry. Over 70 percent of the Lake Whatcom watershed is zoned for forestry (Whatcom County 2016b). Those managed forest lands are owned by Washington State Department of Natural Resources (WDNR) and a combination of larger timber companies and smaller forest landowners with diverse forest management goals (Whatcom County 2016b). The association between logging, logging road construction, large-scale landscape change from mature forest to bare soil and shrub land cover, and the ensuing soil destabilization that can exacerbate mass-wasting and downslope
sedimentation is well documented (Anderson and Potts 1987; Reid et al. 1984; Montgomery 1994; Madej 2001; LaMarche and Lettenmaier 2001; Weaver et al. 1995; Wemple 1998; Wemple et al. 2001). Similar to the motivation for identifying stream restoration capital projects, further promotion of improved sediment management within forestlands could significantly reduce sediment-laden phosphorus loading to Lake Whatcom.
Problem Description
September 2017
22 Lake Whatcom Comprehensive Plan: Stormwater Capital Program Update
developed with higher standards for water quality and public safety. The bill directed WDNR to form the Lake Whatcom Interjurisdictional Committee (Stout 2005) to develop the Landscape Plan and to provide feedback to WDNR on watershed-specific forest management proposals. Yet, because the WDNR managed its timberlands to support educational and other public institutions in Washington State, the Landscape Plan needed to balance landscape management scenarios that ensure income for trust beneficiaries in addition to protecting water quality and ensuring public safety.
On January 30, 2004, the Final Environmental Impact Statement (FEIS; WDNR 2004) for (and including) the Lake Whatcom Landscape Plan (Landscape Plan) was approved and released to the public. The preferred alternative set forth in the FEIS and Landscape Plan included “adding buffers to Type 5 streams, prohibiting road construction on unstable slopes, carefully regulating harvest and road construction on potentially unstable slopes, and providing interjurisdictional review of site-specific activities” (WDNR 2004). A revamped and implementation-focused Lake Whatcom Interjurisdictional Committee was formed to ensure implementation of the Landscape Plan and to report on progress. Committee members acknowledge some of the significant benefits of the Landscape Plan, including reduced logging of unstable watersheds, road
abandonment, and improved culvert conveyance. However, although there is a field group that provides annual progress reports on how well the Landscape Plan is being followed on WDNR lands, there is little to no regulatory oversight of private timber companies to ensure best practices identified by the Landscape Plan are being followed on private forest lands. Therefore, it is probable that some of the intended benefits of the Landscape Plan are not being realized (Steve Fox, Whatcom County Public Works, personal communication, November 29, 2016).
Problem Solution and Benefits
Land preservation was a hallmark feature of the FEIS and adopted Landscape Plan. By 2012, a “re-conveyance” from WDNR to Whatcom County of almost 9,000 acres of undeveloped timberlands was completed; the land was to be used for recreation and watershed protection (LWICT 2015a). However, no further acquisition of WDNR land by Whatcom County for preservation is anticipated in the near term, so most of the watershed’s forest resources will remain actively managed timberlands that are not under Whatcom County’s jurisdiction. Even so, in conjunction with phosphorus TMDL planning efforts, Whatcom County Public Works could pursue an evaluation of the sediment flux from managed forest lands and estimate the relative contribution of those areas to the watershed’s phosphorus budget.
Whatcom County has also become a leader in Washington State as one of the first jurisdictions to map geologic hazard areas, including landslide hazards and alluvial fan hazard areas, and to incorporate those areas into its critical areas code (Whatcom County 2016b). Given the
Landscape Plan, and higher-resolution geomorphic mapping could designate geomorphically active landscapes as unsuitable for logging. Further field and geomorphic analysis would be necessary to expand the geomorphic mapping as described in the following section.
Implementation Steps
Whatcom County could pursue the following steps towards implementing a programmatic review of the current influence of forest practices in the Lake Whatcom watershed on sediment and phosphorus loading to the lake:
•
Take a proactive planning approach by including subbasins draining managed forest lands into the sediment budget for Lake Whatcom. This sediment budget could include an evaluation of both the current and anticipated future sediment flux, following timber harvest, to downstream areas and Lake Whatcom.•
Extend higher-resolution critical areas code mapping of geologic hazard areas, such as landslide-prone areas, or alluvial fan areas, into the managed forest lands in the Lake Whatcom Watershed. This higher-resolution mapping could be used to proactively inform private timber companies of the locations of unstable hazard areas in order to limit or prevent further landscape changes in their vicinity, thereby reducing sediment loading to downstream areas.•
Coordinate with TMDL planning-level studies and available monitoring efforts to conduct an evaluation of the relative contribution of the Lake Whatcom Watershed’s phosphorus budget from managed forest lands.•
Solicit feedback from WDNR regarding any identified gaps between the objectives of the Landscape Plan and the actual effects of implementing the BMPs identified by theLandscape Plan. The County could solicit recommendations from WDNR on specific actions the County could take to help to fill those gaps.
•
Commit County staff to be more involved during the Forest Practices Application (FPA) Review process. The County could more closely collaborate with the Washington State Timber Fish and Wildlife (TFW) Policy Committee, which holds monthly meetings that include a review of recent FPAs in the Lake Whatcom Watershed. Although the County is already forwarded these FPAs for review, the County could use basin-specific knowledge gained through some of the other recommendations in this section to provide more site-specific comments on the FPAs from an erosion- and phosphorus loading-reduction perspective (Dave Klingbiel, WDNR March 30, 2017).•
Continue to coordinate with the Lake Whatcom Interjurisdictional Committee to present the results of the forest-practices-focused sediment and phosphorus evaluationsalongside the committee’s recommendations report and include clear recommendations and implementation steps for enforcing best practices that reduce sediment and
September 2017
24 Lake Whatcom Comprehensive Plan: Stormwater Capital Program Update
Planning Level Cost Estimate
Table 5 below provides potential costs for conducting sediment and phosphorus evaluations focused on actively managed forest lands in the Lake Whatcom Watershed including an audit of best management practices and the final recommendations report. These costs will vary
depending on a number of factors, including the availability of existing and relevant datasets, the degree to which County personnel can lead and/or complete the evaluations, and the extent to which the County would need to spearhead both coordination with the Interjurisdictional Committee, WDNR, private timber companies, and any recommended enforcement actions. The recommendations report will further refine implementation costs and discuss options for
program funding.
Table 5. Cost Estimate for Programmatic Review of Forest Practices.
Task
Approximate Budget
(2016 dollars) Notes
Task 1. Proactive Sediment Budgets. $150,000 Includes both field and remote sensing analysis, evaluation during and after significant storm events, and sediment flux modeling.
Task 2. Higher-Resolution Geologic Hazard Area Mapping.
$150,000 Assumes significant field effort required and geospatial map products provided. Task 3. Evaluate Forest Practice Significance
to Lake Whatcom Phosphorus Budget.
$150,000 Assumes majority of water quality and storm-event and base flow monitoring data available; includes some monitoring and statistical analyses for a few new sites, and reevaluation of all data from a forest practices perspective.
Task 4. Solicit Feedback from WDNR. $30,000 Includes time for meetings, outreach,
interviews, observations and documentation.
Task 5. Ongoing coordination with Lake Whatcom Interjurisdictional Committee.
$30,000 Includes time for meetings, outreach, interviews, observations and
documentation. Task 6. Develop a Bridging the Gap
Recommendations Report for improved sediment management practices in forest lands in the Lake Whatcom Watershed.
$30,000 Summarizes documentation from prior and related efforts, includes
recommended action plan.
A
LLUVIAL
F
ANS AND
B
ASIN
-S
CALE
S
TUDIES FOR
S
EDIMENT
AND
L
ANDSCAPE
M
ANAGEMENT AND
M
AINTENANCE
During the rapid field reconnaissance work for identifying stream restoration capital projects, a few sites along the shore of Lake Whatcom were identified as likely to benefit from a basin study of expected sediment loading and sediment transport before developing a capital project
Problem Description
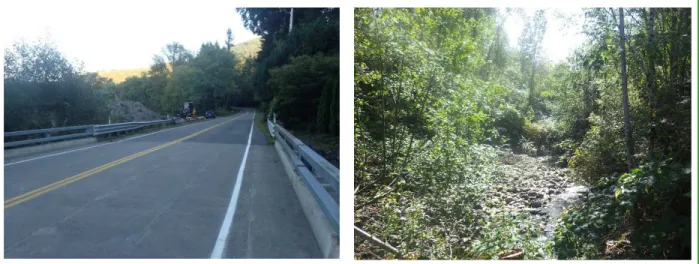
Two sites, in particular, had evidence of excessive coarse bedload sedimentation in the stream channel and are proposed for stream restoration capital projects. One of the sites is at the South Bay Drive crossing of Brannian Creek, and the other is at the eastern end of North Shore Road at the alluvial fan of Smith Creek (Figure 4). Both sites are within the alluvial fans of their respective stream drainages, and the alluvial fan areas also correspond to the most developed portions of the Brannian Creek and Smith Creek Watersheds. Mapped landslide hazard areas are present in the upper watersheds. Forestry remains the dominant land use type in the Brannian Creek Watershed, while the majority of the Smith Creek Watershed was converted to Whatcom County parkland as part of the “re-conveyance” agreement with WDNR (LWICT 2015a).
Figure 4. Stream Erosion Site Reconnaissance Photos of South Bay Drive Crossings of Brannian Creek and Smith Creek.
Left photo: South Bay Drive at the Brannian Creek crossing.
Right photo: Smith Creek alluvial fan and evidence of large coarse-grained gravel and cobble bars.
September 2017
26 Lake Whatcom Comprehensive Plan: Stormwater Capital Program Update
Problem Solution and Benefits
Additional geomorphic and sediment study would help evaluate both the volumes and rates of anticipated sediment loading, could guide the development of alluvial fan restoration capital projects or sediment maintenance activities, and could inform an evaluation of the likely reductions in sediment-laden phosphorus loading from those drainages to Lake Whatcom. Further, basin-scale studies of sediment-rich drainages would also guide higher-resolution mapping of geologic hazard areas, such as landslide-prone areas or alluvial fans, so that both logging and development of those unstable areas can be avoided, and risk of slope failures and mass wasting and their impacts to downstream areas can be reduced.
Implementation Steps
Whatcom County could pursue the following steps to guide the development of capital improvement projects focused on reducing stream channel and bank erosion in developed or developing alluvial fan settings:
•
Conduct an updated sediment budget for the subbasins contributing to the alluvial fan areas of interest.•
Conduct a geomorphic assessment of the opportunities, hazards, and risks within the specific alluvial fan settings.•
Conduct a geochemical analysis to quantify phosphorus concentrations in stream sediments.•
Develop alternatives recommendations reports including potential and recommended phased project components and planning level design and construction cost estimates for each project component.Planning Level Cost Estimate
E
XPANDING
P
ROTECTION OF
C
REEK
R
IPARIAN
C
ORRIDORS IN
R
ESIDENTIAL
A
REAS
The annual reports documenting progress (LWICT 2014, 2015a) implementing components of the Lake Whatcom Management Program Work Plan (LWICT 2015b) specifically highlight ongoing efforts to educate residents of the Lake Whatcom watershed about water quality impacts and ways that they can manage their yards and conduct other activities to minimize those impacts.
Problem Description
However, during the rapid field reconnaissance for identifying stream restoration capital projects, observers noted thousands of feet of streams flowing through residential
neighborhoods in Bellingham, Silver Beach, Geneva, and Sudden Valley where the streams were confined to a ditch-like narrow channel, had very little native bank vegetation, and were
characterized by chronic channel bed and bank erosion. Prior studies have associated the Lake Whatcom watershed soils with relatively high bioavailable phosphorus content (Groce 2011; Liang 1994). Therefore, excessive sediment delivery from eroding streams in residential areas likely exacerbates phosphorus loading to the lake.
Problem Solution and Benefits
Whatcom County currently has several programs aimed at promoting environmental
stewardship in the Lake Whatcom Watershed. Conservation easements called Native Growth Protection Area Easements or Protective Native Growth Areas provide a mechanism for permanent protection of native vegetation through deed restrictions. The Lake Whatcom Homeowner Incentive Program (HIP) also provides homeowners living within designated areas draining to Lake Whatcom Basins 1 and 2 with financial incentives to complete water quality improvements on their properties. However, neither program specifically targets residences along stream corridors where significant stream bank and bed erosion has been observed. Properties that meet the maintenance and native vegetation requirements of a Native Growth Protection Area or Protective Native Growth Area are more likely to support conditions that are conducive to stream channel and bank stability, thereby reducing phosphorus loading stemming from soil erosion. However, if deed restrictions discourage homeowners from seeking
September 2017
28 Lake Whatcom Comprehensive Plan: Stormwater Capital Program Update
Implementation Steps
Whatcom County could pursue the following steps to promote the expansion of riparian corridor protection on residential properties along stream channels and within stream riparian corridors:
•
Whatcom County Public Works staff should meet with Natural Resources and Planning Staff to brainstorm ideas for interdepartmental collaboration in expanding existing programs and prioritizing that expansion on residential areas adjacent to eroding stream corridors.•
County staff could conduct neighborhood-scale outreach workshops and hands-on trainings to inform residents of opportunities and strategies for participating in stormwater, habitat, and water quality improvements.•
The County could consider additional incentives to motivate not only initial project implementation, but long-term maintenance as well.Planning Level Cost Estimate
An approximate planning level cost estimate of $20,000 would cover County staff time (assuming approximately 15 percent of an FTE for 1 year, including some travel and other expenses) to initiate interdepartmental communications, attend meetings, and organize and attend community workshops.
D
ITCH
R
ETROFITS
Ditches are the primary stormwater conveyance in the Lake Whatcom watershed. Roadside ditches convey runoff from the roadway and neighboring development to Lake Whatcom. Enhancement of roadside ditches is an opportunity for the County to provide more water quality treatment within the right-of-way system for roadways and developed areas at relatively low cost.
Problem Description
Problem Solution and Benefits
A series of recommended ditch retrofits will enable Whatcom County Public Works to reconfigure, construct, and maintain appropriate and effective drainage ditches. Retrofitting ditches can reduce flooding and erosion, and help remove sediment and pollutants.
Management and treatment of flow in roadside ditches relies on filtration, sedimentation, infiltration, adsorption, and flow attenuation.
Based on guidance previously provided in Herrera (2015a), the first step is to identify areas where ditches are problematic or where there is a treatment opportunity. Problem ditches are typically under capacity, clogged with sediment, or eroded. Problem ditches do not provide adequate drainage and are likely generating sediment and transporting sediment downstream. Roadway flooding or ditch erosion indicate that a roadside ditch is a problem. Densely
developed areas with high-volume roadways and higher pollutant generation are where retrofitting ditches to provide water quality treatment have the greatest potential benefit. Retrofit components to reduce erosion include lining ditches, widening and flattening ditches, and installing check dams. Retrofit options to improve water quality treatment include widening and flattening ditches, installing check dams, planting vegetation, and dispersing flow.
Additional water quality enhancements include increasing ditch flow length (contact time) and amending the soil (Otak 2012).
Additional guidance adapted from Herrera (2015a) on ditch retrofits is provided in Appendix F.
Implementation Steps
Developing a ditch retrofit program could include the following tasks:
•
Task 1. Problem Ditch Inventory – Complete ditch inspection checklist during regular inspection, including development of the data collection and record keeping system.•
Task 2. Prioritization of Retrofit – Identify and prioritize retrofit opportunities based on ditch inventory information, impacts to property and environment, and available resources. The County should target a quantifiable length of ditch to retrofit each year.•
Task 3. Retrofit Selection and Design – Design retrofits to include one or more of the retrofit components described above.•
Task 4. Construction of Ditch Retrofit – Actual length of ditch constructed each year will depend on results of Tasks 1 and 2 and available budget for construction. A typical water quality ditch retrofit will cost approximately $50 per linear foot for construction (Herrera 2014).September 2017
30 Lake Whatcom Comprehensive Plan: Stormwater Capital Program Update
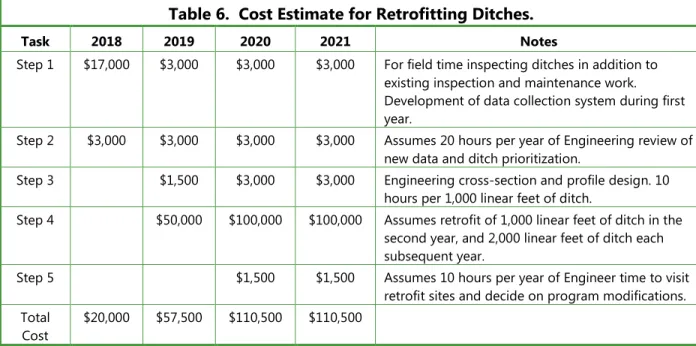
Planning Level Cost Estimate
A cost estimate for a ditch retrofit program is provided in Table 6 based on the implementation tasks described above. This estimate has been adapted from Herrera (2015a) and assumes that ditch inspections will occur as part of the County’s ongoing ditch maintenance program.
Table 6. Cost Estimate for Retrofitting Ditches.
Task 2018 2019 2020 2021 Notes
Step 1 $17,000 $3,000 $3,000 $3,000 For field time inspecting ditches in addition to existing inspection and maintenance work. Development of data collection system during first year.
Step 2 $3,000 $3,000 $3,000 $3,000 Assumes 20 hours per year of Engineering review of new data and ditch prioritization.
Step 3 $1,500 $3,000 $3,000 Engineering cross-section and profile design. 10
hours per 1,000 linear feet of ditch.
Step 4 $50,000 $100,000 $100,000 Assumes retrofit of 1,000 linear feet of ditch in the second year, and 2,000 linear feet of ditch each subsequent year.
Step 5 $1,500 $1,500 Assumes 10 hours per year of Engineer time to visit
retrofit sites and decide on program modifications. Total
Cost
$20,000 $57,500 $110,500 $110,500
SUDDEN VALLEY CAPITAL STORMWATER
MANAGEMENT STRATEGIES
The Sudden Valley community was developed in the 1970s as a recreation/resort village. It has since become one of the most highly developed areas in the Lake Whatcom watershed and is now primarily occupied by permanent residents. Approximately 63 percent of the Sudden Valley area is owned and managed by the SVCA, and the remaining area is privately owned. The SVCA operates as a homeowners’ association for the community, operating and maintaining its own facilities and land.
The Sudden Valley community is covered by Whatcom County’s current NPDES Phase II Municipal Stormwater Permit and is subject to other regulatory protections that apply to the Lake Whatcom watershed pursuant to Chapter 20.51 of the Whatcom County Code (WCC). As part of WCC 20.51.420(1)(h), the SVCA has a preapproved phosphorus mitigation plan that defines the stormwater management requirements for all newly developed parcels within the Sudden Valley community. The SVCA has also entered into several joint agreements, restrictive covenants, and property exchanges with Whatcom County, the City of Bellingham, and the Lake Whatcom Water and Sewer District in order to reduce the density of development within the community. The SVCA started its Density Reduction Program in 1993, with the goal of reducing the number of developable lots by 30 percent. The jurisdictions identified above joined the effort in 2000, and the target of restricting 1,400 lots was reached in 2007. SVCA membership voted to continue the density reduction program, and 1,445 lots have been restricted from development to date. In 2013, the SVCA also completed a comprehensive evaluation of its stormwater drainage system (LWICT 2014). Finally, the SVCA has implemented a 10-year Forest and Wildlife Stewardship (FAWS) plan with WDNR that provides educational resources and guidance to community members (Whatcom County 2016b).
Clearly, the SVCA is a key partner for improving water quality conditions in the Lake Whatcom watershed, and Whatcom County is actively seeking new and improved ways to partner with the SVCA on common issues. The following subsections describe potential opportunities for
partnerships between Whatcom County and the SVCA through the implementation of
stormwater capital projects, coordinated planning for stream restoration in Sudden Valley Golf Course, and additional education and outreach.
S
TORMWATER
C
APITAL
P
ROJECT
C
OORDINATION
In connection with the field reconnaissance, described above, to identify potential stormwater capital projects within the Lake Whatcom watershed, four proposed projects were identified in the Sudden Valley community:
•
Valley Village Mall – Rank 24September 2017
32 Lake Whatcom Comprehensive Plan: Stormwater Capital Program Update
•
Sudden Valley Golf Course Lot – Rank 28•
Sofield Park – Rank 35Figure 5 shows locations of the four proposed stormwater capital projects in the Sudden Valley community. Detailed project descriptions are provided in Appendix B. Input from the SVCA on these proposed projects is documented in Appendix G.
The four proposed projects in the Sudden Valley community provide an opportunity for
Whatcom County and the SVCA to form a partnership with a common goal of improving water quality in Lake Whatcom. One potential implementation strategy for completing the proposed capital projects is a public-private partnership. Public-private partnerships are a means for Whatcom County to address private development stormwater issues without taking ownership. A public-private partnership is a contractual agreement between a public agency and a private sector entity in which the skills and assets of each sector (public and private) are shared in delivering a service or facility for the benefit of the public. For example, the County may be the appropriate entity to provide ongoing operations and maintenance duties for any stormwater facilities installed. In addition to sharing resources, each party shares in the potential risks and rewards in the delivery of the service and/or facility.
A wide range of tools is available for enabling and encouraging public-private partnerships, including obtaining grants, public outreach, formation of local improvement districts, and low cost loans. As an example of a similar program, King County’s Water and Land Resources Division supports a Neighborhood Drainage Assistance Program (NDAP) that provides assistance for flooding, erosion, and sedimentation problems affecting private property in unincorporated King County. The NDAP designs and funds capital improvement projects and repairs existing drainage systems. The NDAP also provides technical assistance related to questions about construction, permitting, and storm drainage design. If a project does not qualify for funding or if funds are unavailable, the King County Water and Land Resources Division will still assist with information and advice. That may include construction suggestions; lists of engineers, contractors, or mediation services if there is a dispute; information to meet permit requirements; and sketches and details of common drainage features that could be constructed.
S
UDDEN
V
ALLEY
G
OLF
C
OURSE
C
REEK
R
ESTORATION
P
LANNING
S
TUDY
LA K E W
H A TC
O M
B LV
D
LA KE
LO UIS
E RD
27
35
28
24
Stormwater Capital Projects in
Sudden Valley with Priority
Rank.
0 500 1,000 2,000
Feet
Legend
Proposed BMP Locations
Proposed Stormwater Basins City of Bellingham
Bioretention
Media Filter Drain
Stormfilter
Streams
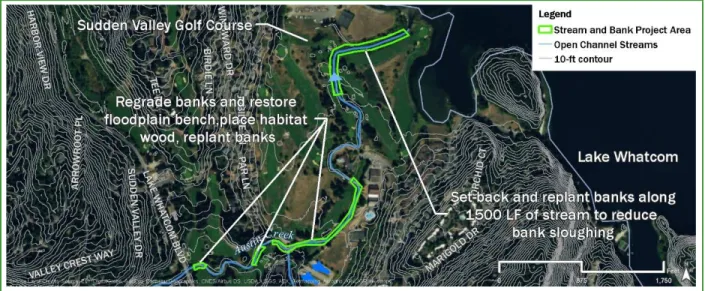
Observations made during the field reconnaissance for potential stream restoration capital projects indicated that over 4,000 linear feet of Austin Creek within the golf course could benefit from restoration activities to rehabilitate a more stable channel geomorphology. The lower 1,200 to 1,500 feet of the stream channel just upstream of Lake Whatcom exhibit lacustrine (lake-like) habitat. That reach would benefit from laying back the banks to a more stable angle and planting the banks with native vegetation to reduce bank sloughing, which is caused by the wetting and drying of bare bank soils associated with fluctuating lake levels. Proposed
restoration activities are shown on Figure 6 and are summarized in Appendix C (see the capital project named “Austin Creek Improvements in Sudden Valley Golf Course” [Rank 33]). Upstream of the lower lake-like reach, the stream habitat is alluvial, and restoration activities could focus on attenuating erosive velocities and sediment transport. Restoration could involve setting back the creek banks to achieve a more stable and sustainable angle, as well as incorporating
floodplain benches and placing large woody debris to create physical habitat complexity and natural sediment storage areas. The banks could be planted with native vegetation that increases shade over the stream and promotes improved water quality conditions. Input from the SVCA on these proposed projects is documented in Appendix G.
Figure 6. Potential Sudden Valley Golf Course Restoration Planning Study Area.
Implementing stream restoration activities within the golf course would require significant partnership and coordination among the Sudden Valley Golf Course management, the SVCA, Whatcom County Public Works, and other regulatory agencies. A planning study is
September 2017
36 Lake Whatcom Comprehensive Plan: Stormwater Capital Program Update
visual and sound barriers, as well as areas where shorter vegetation is desired to allow play across Austin Creek. Any stream channel construction must occur within the summertime in-water work window required by the Washington Department of Fish and Wildlife. Because that is also a busy season for the golf course, in-water work timing would need to be coordinated carefully to reduce impacts on the golf course community. Input from the SVCA on the proposed planning study is documented in Appendix G.
E
DUCATION AND
O
UTREACH
As a part of Whatcom County’s NPDES Phase II Municipal Stormwater Permit requirements, and to benefit the water quality in Lake Whatcom, an ongoing education and outreach program is being implemented for residents throughout the Lake Whatcom Watershed. This effort includes the HIP program described previously and numerous other initiatives to engage residents in lake protection and pollution-prevention activities by providing informational resources.
REFERENCES
Anderson, B. and D.F. Potts. 1987. Suspended Sediment and Turbidity Following Road Construction and Logging in Western Montana. Water Resources Bulletin 23: 681–690.
Ecology. 2007. Final Model Report for the Lake Whatcom Project TMDL Model Project. Ecology Publication No. 09-10-010. Prepared for US Environmental Protection Agency Region 10 and Washington State Department of Ecology by the Cadmus Group, Inc. and CDM, Bellevue Washington. July 18.
Ecology. 2014. General Use Level Designation for Basic (TSS), Enhanced, and Phosphorus Treatment for Washington State Department of Transportation’s Media Filter Drain (MFD). Washington State Deport of Ecology. Olympia, Washington.
Ecology. 2016a. Lake Whatcom Watershed Total Phosphorus and Bacteria Total Maximum Daily Loads: Volume 2. Water Quality Improvement Report and Implementation Strategy. Washington State Department of Ecology. Olympia, Washington.
Ecology. 2016b. General Use Level Designation for Basic (TSS) and Phosphorus Treatment for Contech Engineered Solutions Stormwater Management StormFilter with PhosphoSorb Media. Washington State Department of Ecology. Olympia, Washington.
Groce, Scott. 2011. Soils as a source of Bioavailable Phosphorus in the Lake Whatcom Watershed. Master’s Thesis, Western Washington University.
Herrera. 2014. Selecting and Implementing Stormwater Retrofits and Programmatic Actions to Improve Water Quality and Aquatic Habitat. Prepared for the Hood Canal Coordinating Council by Herrera Environmental Consultants, Inc., Seattle, Washington. June 30.
Herrera. 2015a. San Juan County Stormwater Basin Planning Volume 2: Priority Watershed Planning, San Juan County Washington. Prepared for San Juan County Public Works by Herrera Environmental Consultants, Inc., Seattle, Washington. June 19.
Herrera. 2015b. Analysis of Bioretention Soil Media for Improved Nitrogen, Phosphorus, and Copper Retention. Prepared for Kitsap County Public Works by Herrera Environmental Consultants, Inc., Seattle, Washington. July 17.
Homer, C.G., J.A. Dewitz, L. Yang, S. Jin, P. Danielson, G. Xian, J. Coulston, N.D. Herold,
September 2017
38 Lake Whatcom Comprehensive Plan: Stormwater Capital Program Update
King County. 2007. Road Design and Construction Standards. King County Department of Transportation. Road Services Division.
King County. 2009. King County, Washington Surface Design Manual. King County Department of Natural Resources and Parks. January 9.
LaMarche, J.L. and D.P. Lettenmaier. 2001. Effects of Forest Roads on Flood Flows in the Deschutes River, Washington. Earth Surface Processes and Landforms 26: 115–134.
LWICT. 2014. 2014 Lake Whatcom Management Program Progress Report. Lake Whatcom Interjurisdictional Coordinating Team.
LWICT. 2015a. 2015 Lake Whatcom Management Program Progress Report. Lake Whatcom Interjurisdictional Coordinating Team.
LWICT. 2015b. Lake Whatcom Management Program 2015–2019 Work Plan. Lake Whatcom Interjurisdictional Coordinating Team. April.
Liang, C-W. 1994. Impact of Soil and Phosphorus Enrichment on Lake Whatcom Periphytic Algae. Master’s Thesis, Western Washington University.
Madej, M.A. 2001. Erosion and Sediment Delivery Following Removal of Forest Roads. Earth Surface Processes and Landforms 26: 175–190.
Montgomery, D.R. 1994. Road Surface Drainage, Channel Initiation, and Slope Instability. Water Resources Research 30(6): 1925–1932.
NRCS. 2016. National Soil Survey Soil Handbook, title 430 – VI. US Department of Agriculture. National Resources Conservation Service.
Otak. 2012. Kitsap County Roadside Ditch and Shoulder Water Quality Enhancement Plan. Prepared for Kitsap County by Otak, Inc., Kirkland, Washington. December.
Reid, L.M., and T. Dunne. 1984. Sediment Production from Forest Road Surfaces, Water Resources Research 20: 1753–1761.
Stout, Matt. 2005. Lake Whatcom Landscape Planning Process: State Forest Planning for a Municipal Watershed. Case Study by Matt Stout, published as part of the Collaborative Planning on State Trust Lands publication, a University of Michigan Study.