九州大学学術情報リポジトリ
Kyushu University Institutional Repository
Yb 及び Eu 化合物における価数不安定性の研究
大山, 耕平
http://hdl.handle.net/2324/4474931
出版情報:Kyushu University, 2020, 博士(理学), 課程博士 バージョン:
権利関係:
Study on Valence Instabilities in Yb- and Eu-based Compounds
Doctoral Thesis
Kohei Oyama
Department of Physics, Graduate School of Science
Kyushu University
Abstract
In some Yb- and Eu-based compounds, the valence becomes unstable and exhibits interesting physical properties such as valence fluctuation, dense Kondo effect, and non-Fermi liquid.
Further, in Yb and Eu, one valence state is magnetic, while the other state is non-magnetic.
Thus, the valence instability leads to magnetic instability. Especially in the Yb system, it has been pointed out that the valence instability mediates the cooper in unconventional superconductivity. In this study, we have focused on Yb and Eu compounds in which valence instability significantly contributes to physical properties.
YbPd has a cubic CsCl type structure at room temperature and ambient pressure, and Yb exhibits valence fluctuation. It undergoes phase transitions at T1 = 125 K, T2 = 105 K, T3 = 1.9 K and T4 = 0.5 K. At T1 = 125 K, the cubic structure is distorted into the tetragonal one. Below T2, the Pd atom is displaced and forms two inequivalent Yb sites. One site is occupied by Yb3+, and the other site by Yb2.6 +. A layered valence order is realized. Yb3+ has a magnetic moment and exhibits magnetic order below T3 = 1.9 K. However, magnetic order is suppressed with applying pressure, which is opposite to a usual Yb compound. This behavior is associated with the suppression of the valence order by pressure. Therefore, this study focuses on elucidating the magnetic structure of YbPd and how the compound behaves after the magnetic structure is suppressed by pressure.
Due to a domain structure introduced in the structural phase transition single crystal and difficulty in obtaining strain-free powder samples, the magnetic structure of YbPd was not determined. Recently, we have succeeded in synthesizing strain-free powder samples of YbPd.
We have measured the powder neutron diffraction and determined the magnetic structure. It is clarified that the magnetic structure is a long-range incommensurate sinusoidal one characterized by an amplitude of the Yb3+ magnetic moment of 0.3 μB aligned in the a direction and propagation vector of k = (0.080, 0, 0.32). The small magnetic moment of Yb3+ suggests the Kondo effect and that Yb2.6 + has no magnetic moment. The magnetic structure agrees with the previously determined valence-ordered structure.
In addition, the structural and electrical behavior has been examined under high pressures at low temperatures. The structural phase transition at T1 is suppressed continuously up to T1 = 20K at 4.4GPa and disappears at 5 GPa. Above 5 GPa, a cubic valence fluctuation state is stabilized down to the lowest temperatures. The electrical resistivity shows the T-linear in wide pressure regions between 8 to 12 GPa. Similar behavior of electrical resistivity has been observed in β-YbAlB4 and YbRh2Si2, where valence fluctuations cause superconductivity and
quantum critical phenomena. We have found that the phenomenon, which might be related to quantum criticality, is also observed in YbPd after the valence order disappears.
In the Eu system, we have focused on the Eu2Pt6Al15, which is a new Eu-based valence transition compound. Eu2Pt6Al15 shows a valence transition at Tv = 45K, but its crystal structure is quite different from that of the other Eu-based valence transition compounds (tetragonal ThCr2Si2 type).
We have examined the physical properties of Eu2Pt6(Al1-xGax)15 by using various measuring techniques. With increasing Ga concentration x, the volume expands, and valence transition temperature decreases. We found that valence transition is suppressed, and antiferromagnetic order with the divalent state is stabilized at around x = 0.1. We observed the field-induced valence transition in the magnetization curve for x = 0, 0.05 in a pulsed high magnetic field. It is known that the valence transition field is proportional to the valence transition temperature.
For Eu2Pt6Al15, the proportional coefficient is estimated to be 0.63 T/K, which is similar to that of most valence transition compounds with the tetragonal ThCr2Si2 type structure. These results reveal that valence transition in Eu2Pt6Al15 exhibits a lot of similarities to that of the other Eu-based valence transition compounds.
In this thesis, we introduce general information and concern about 4f electron systems in chapter 1. The experimental details are shown in chapter 2. In chapter 3, the experimental results of YbPd are shown and discussed. In chapter 4, the experimental results of Eu2Pt6(Al1-xGax)15
are shown and discussed. Finally, the conclusion is described in chapter 5.
Contents
1. Introduction ... 1
1.1 Magnetism of rare-earth elements ... 1
1.2 Valence fluctuation, valence ordering, and valence transition ... 3
1.3 YbPd ... 8
1.3.1 YbPd ... 8
1.3.2 Physical Properties under pressure... 11
1.3.3 Neutron diffraction studies ... 14
1.4 Eu
2Pt
6X
15(X = Al, Ga) ... 16
1.4.1 Eu
2Pt
6Al
15and Eu
2Pt
6Ga
15... 16
1.5 Purpose of this thesis ... 20
2. Experimental Details ... 21
2.1 Sample preparation ... 21
2.2 Powder neutron Diffraction measurements ... 22
2.3 X-ray diffraction measurements under high pressure ... 22
2.4 Electrical resistivity measurements under high pressure ... 22
2.5 Magnetic Susceptibility ... 23
2.6 High-field magnetization process ... 23
2.7 X-ray Absorption Spectroscopy (XAS) ... 23
3. Results and Discussion on YbPd ... 24
3.1 Powder neutron diffraction ... 24
3.1.1 Powder neutron diffraction ... 24
3.1.2 Magnetic structure analysis ... 25
3.2 High-pressure measurements of YbPd ... 32
3.2.1 X-ray diffraction measurements under high pressure ... 32
3.2.2 Electrical resistivity measurements under high pressure ... 35
4. Results and Discussion on Eu
2Pt
6(Al
1-xGa
x)
15... 37
4.1 Lattice parameter ... 37
4.2 Magnetic susceptibility ... 37
4.3 Electrical resistivity ... 38
4.4 Temperature versus Ga concentration phase diagram ... 40
4.5 High-field magnetization process ... 40
4.6 X-ray Absorption Spectroscopy ... 46
5. Conclusion ... 50
Acknowledgement ... 51
Reference ... 52
1
1. Introduction
1.1 Magnetism of rare-earth elements
In the rare-earth metals, 4f electrons carry the magnetic moments. Because of closed 5s and 5d orbitals existing outside of 4f orbital, 4f moments tend to behave as localized moments. Thus, the 4f electrons occupy the 4f level according to Hund's law and form total orbital momentum L and total spin momentum S. Total angular moment J is formed by spin – orbital interaction as J = L + S. On the other hand, 3d electrons carry magnetic moments in the iron group transition metals. Because 3d electrons are located at the outer shell, they are itinerant and interact directly with the nearest neighbor atoms. The features result in the freezing of angular momentum. Thus, 4f and 3d electron systems are in contrast with each other.
4f electrons are usually localized in rare-earth ions. However, they are hybridized with conduction bands and show instabilities in a few rare-earth-based compounds. There are two kinds of interactions between 4f electrons and conduction electrons. One is the Kondo effect, and the other is the Rudermann – Kittel – Kasuya – Yosida (RKKY) interaction. In the former one, 4f moments are screened by spins of conduction electrons. The Kondo effect was first discovered and revealed in metallic alloys containing dilute magnetic impurities. At low temperatures, the randomly arranged magnetic impurities scatter conduction electrons, which leads to an increase in electrical resistivity with decreasing temperature [1].
However, in rare-earth-based compounds, the Kondo effect occurs even in periodically arranged 4f moment systems. This is because 4f electrons exist inside closed 5s- and 5d-shells and cannot directly interact with those of adjacent atoms. The periodically arranged 4f moments screened by the Kondo effect are no longer scatterers of conduction electrons. Thus, with decreasing temperature, the electrical resistivity once increases due to the conventional Kondo effect and subsequently decreases. [2]
The latter one (RKKY interaction) gives magnetic order and is an indirect interaction between 4f moments mediated by conduction electrons. The conduction electrons polarized by one 4f moment interact with the other 4f moments of rare-earth atoms. [3 – 5] It is well-known that these two interactions often compete with each other in the system. Doniach summarized the competition between the Kondo effect and the RKKY interaction as a phase diagram (Doniach diagram [6]), as shown in Fig. 1.1. The vertical axis stands for temperature, and the horizontal axis the magnitude of hybridization between 4f electrons and conduction electrons. At the most competitive point, called a quantum critical point (QCP), magnetic and/or valence fluctuation
2
are enhanced, which leads to such exotic physical phenomena as unconventional superconductivity in CeCu2Si2 [7], valence fluctuation, and unconventional superconductivity in -YbAlB4 and non-Fermi liquid behavior in YbRh2Si2 [8, 9]. The Doniach phase diagram has been successful in explaining the behavior of Ce- and Yb-based compounds uniformly. For example, the T – P phase diagram of the Ce system is well agreed with Doniach’s phase diagram, as shown in Fig. 1.2 for CeIn3 [10].
Figure 1.1 Doniach phase diagram. Jc-f is an exchange interaction between conduction electron and 4f electron and D(F) is density of state of conduction electrons at Fermi energy.
AFM
Fermi Liquid
3
1.2 Valence fluctuation, valence ordering, and valence transition
The lanthanoid atoms usually have such an electron configuration as [Xe]4fn5s25p6(5d,6s)3. Here, 5d or 6s electrons, which are called valence electrons, contribute to electrical conductivity and chemical bonds in metallic compounds. The three-valence-electron state is called a trivalent state. In some Eu-, Yb-, or Sm-based compounds, the lanthanoid atoms sometimes have a [Xe]4fn+15s25p6(5d,6s)2 configuration, which is called divalent state. When these two valence states nearly degenerate at Fermi energy, the valence fluctuates with time and space between these two states. This phenomenon is called valence fluctuation. In some valence fluctuating compounds, the fluctuation stops with decreasing temperature, and two valence states are arranged regularly, namely valence order. In the valence fluctuation, conduction electrons are hopping among rare-earth atoms, which yields good electrical conductivity. In contrast, in the valence order, the conduction electrons are localized at rare-earth atoms, which results in an increase in electrical resistivity. The valence order is also observed in some 3d transition metal oxide systems such as Fe3O4 and Nd0.5Sr0.5MnO3 [11, 12].
Eu-based intermediate valence compounds often show a large change in Eu valence with temperature. In Eu-based compounds (n = 6), Eu ions usually have either a magnetic divalent state (4f7) with a larger volume or a non-magnetic trivalent state (4f6) with a smaller volume.
Figure 1.2. Temperature – pressure phase diagram of CeIn3 [10].
Solid black, open circle and cross indicate a Néel temperature TN. Inverted triangle means the crossover temperature to Fermi Liquid behavior. Open diamonds are a critical temperature of superconductivity scaled by factor of 10.
4
According to the third law of thermodynamics, the entropy should be zero at 0 K. When magnetic exchange interaction is relatively weak, some divalent compounds show no magnetic order but valence transition to the non-magnetic trivalent state at low temperatures so that magnetic entropy is approached zero.
The valence transition is also seen when external pressure is applied to some divalent compounds. The external pressure reduces a unit cell volume, which leads to a smaller trivalent state. Figure 1.3 shows the temperature-pressure phase diagram in Eu-based compounds that exhibit a pressure-induced valence transition. At ambient pressure, the magnetic order is realized at low temperatures. The ordering temperature increases slightly with pressure, which results from a slight increase in the RKKY interaction due to a slight decrease in distance between Eu ions. As the pressure is further increased, the magnetic order suddenly disappears at a critical pressure, which is accompanied by the valence transition. Above the critical pressure, a non-magnetic ground state with an almost trivalent state is realized. As the temperature is increased, the trivalent state is changed sharply to a divalent state, which corresponds to valence transition. The valence transition, which is of first order just above the critical pressure, is shifted to higher temperatures with increasing pressure. Above a critical end point (CEP), the valence transition becomes continuous. The characteristics of the T – P phase diagram are different from those of the Doniach phase diagram, which explains the behavior of most Ce- or Yb-based compounds.
In Eu-based compounds, valence transition is also induced by a magnetic field, which is called field-induced valence transition. Such valence transitions are mainly found in Eu-based compounds with the tetragonal ThCr2Si2 type structure and the hexagonal ZrBeSi type structure.
5
We introduce some examples which show valence order and/or valence transition associated with 4f electron as follows.
Yb4As3 is a valence fluctuating compound at high temperatures, which crystallizes in the cubic anti-Th3P4 structure (Fig.1.4). It undergoes valence order transition at around T = 300 K accompanied by a structural phase transition. In the valence order state, the Yb3+ ions are arranged along one direction of <1 1 1>, and the other Yb ions are in a divalent state. As a result, the cubic structure is distorted into the trigonal structure. Figure 1.5 shows the temperature dependence of the electrical resistivity of Yb4As3. The electrical resistivity shows a sudden increase with decreasing temperature when the valence order takes place. [13]
Figure 1.3. T – P phase diagram of Eu-based compounds. Critical End Point (CEP) is the point where valence transition becomes crossover from the first-order transition.
6
EuTX (T = Ni, Pd, Pt, X= P, As) systems also exhibit valence order. EuTX systems crystallize in the layered hexagonal ZrBeSi type structures, as shown in Fig. 1.6. The systems show the layered valence order with the Eu mean valence of 2 + n/6 (n = 1, 2, 3, 4) [14] and valence transition accompanied by a change of the valence order structure as functions of temperature and pressure. For example, EuPtP shows two valence transitions at T = 240 (n = 1 → 2) and 200 K (n = 2 → 3) with decreasing temperature. In the temperature range between 240 and 200 K, the Eu2+ and Eu3+ layers are stacked along the c-direction as -(2+)-(2+)-(3+)-(2+)-(2+)-(3+)- (2+: Eu2+ layer, 3+: Eu3+ layer). Below 200K, the stacking structure is changed to -(2+)-(3+)-
Figure 1.4. Crystal structure of Yb4As3 (anti-Th3P4 type structure) [13]. In a valence ordered state, Yb3+ ions are located at Yb I site and Yb2+ ions at Yb II
Figure 1.5. Temperature dependence of electrical resistivity of Yb4As3. [13]
7
(2+)-(3+)-. [15] The magnetic Eu2+ layers exhibit antiferromagnetic order at 7 K. The anomalies due to the transitions are observed in the electrical resistivity, as shown in Fig. 1.7. [16]
EuT2Si2 (T = Cu, Pd, Ir) compounds, which crystalize in the tetragonal ThCr2Si2-type structure, exhibit temperature-dependent Eu valence. [17, 18] For example, in EuPd2Si2,the Eu mean valence drastically but continuously increases from 2.3 to 2.8 at around 170 K with decreasing temperature, as shown in Fig. 1.8 [19]. At around 170 K, the Eu valence fluctuates between Eu2+ and Eu3+ on the time scale of 10-11 ~ 10-13 sec. Substitution of Au for Pd lowers the valence
Figure 1.6. Crystal structure of EuTX. The purple circle denotes Eu, the orange one is T atom, and the light green one is X atom.
Figure 1.7. Temperature dependence of electrical resistivity of EuPtP. [14]
8
transition temperature and switches the continuous valence change to a first-order valence transition [20]. When a magnetic field is applied to the trivalent state at the lowest temperature, the Eu valence is varied to the divalent state, accompanied by a jump of the magnetization as shown in Fig. 1.9. [21]. The Zeeman energy lowers the divalent level to the Fermi level.
1.3 YbPd
1.3.1 YbPd
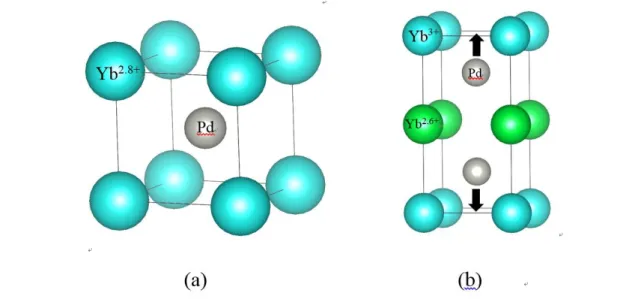
YbPd, which crystallizes in the cubic CsCl-type structure (Fig. 1.10(a)), is a valence fluctuating compound at room temperature. It undergoes four phase transitions at T1 = 125 K,
Figure 1.8. Temperature variation of Eu mean valence in EuPd2Si2 [19].
Figure 1.9. High-field magnetization of EuPd2Si2 and Eu(Pd0.95Pt0.05)Si2 [21].
9
T2 = 105 K, T3 = 1.9 K, and T4 = 0.5 K [22]. Figure 1.11 shows the temperature dependence of the electrical resistivity of YbPd. The anomalies associated with T1 ~ T4 are seen in contrast to no anomalies of in LuPd. Figure 1.12 shows the difference in specific heat between YbPd and a non-magnetic reference sample LuPd as a function of temperature. Sharp peaks are observed at T1 and T2, and -shaped anomaly is seen at T3, which means transitions at T1 and T2 are of first order and that at T3 is of second order [22]. Figure 1.13 displays the temperature dependence of ac magnetic susceptibility in the low-temperature regions. The susceptibility shows a kink at T3 and an anomaly with a thermal hysteresis at T4 [22]. Figure 1.14 depicts Mössbauer effect spectra measured by Bonville et al. Below T3, we can see the superposition of singlet and split subspectra in an intensity ratio of 48 : 52, which means that 48% of Yb ions are non-magnetic and that 52% of Yb ions perform magnetic order below T3 [23].
According to recent X-ray diffraction studies, the cubic structure is distorted into a tetragonal one at T1 [24, 25]. Below T2, Pd atoms at a body-centered position are displaced toward alternately positive and negative c-directions [24, 25]. As a result, a two-fold structure along the c-axis is a new unit cell, in which two inequivalent Yb sites are yielded, as shown in Fig.
1.10(b). A resonant X-ray diffraction study by Takahashi et al. shows that Yb3+ ions occupy one site and Yb2.6+ ions the other site, which results in valence order [25]. Furthermore, they also have proposed incommensurate valence order with k = (0.07 0.07 1/2) between T1 and T2 [25].
Figure 1.10. Crystal structure of YbPd (a) at room temperature, (b) below T2 = 105 K
10
Figure 1.11. Temperature dependence of the electrical resistivity of YbPd [22]. The inset shows a magnified graph in the low temperature region.
Figure 1.12. Difference in specific heat between YbPd and non-magnetic LuPd versus temperature [22]. (Inset) Specific heat of YbPd (circle), LuPd (square), and CaPd (triangle) at low temperatures.
11
1.3.2 Physical Properties under pressure
It is well-known that pressure is a powerful tool to control the hybridization between 4f electrons and conduction electrons. In Yb-based compounds, applying pressure corresponds to a decrease in JcfD(F) in Doniach's phase diagram. This means that a magnetic trivalent state with a smaller volume becomes stable under pressure. For example, YbInCu4 performs a first- order valence transition from Yb3+ to Yb2.9+ with decreasing temperature at ambient pressure.
The Yb2.9+ state, where Yb valence fluctuates between Yb3+ and Yb2+ states, exhibits no Figure 1.13. Temperature dependence of the ac susceptibility of YbPd at low
temperatures [22].
Figure 1.14. 170Yb Mössbauer spectra of YbPd at T =4.2, 1.4, and 0.05 K [23].
12
magnetic order even at the lowest temperature. The application of pressure suppresses the valence transition and stabilizes the magnetic Yb3+ state down to the lowest temperatures. The stabilized Yb3+ state exhibits ferromagnetic order above 2.5 GPa [26, 27]. In some Yb-based heavy-fermion or intermediate-valence compounds, similar pressure-induced magnetic order has been found.
In YbPd, however, with applying pressure, magnetic ordering temperature T3 decreases and disappears at around 2 GPa [28, 29]. Figure 1.15 shows the temperature dependence of the electrical resistivity under various pressures. The valence ordering temperature T2 is also shifted to low temperatures and suppressed at around P = 2 GPa. These results imply that the magnetic order is strongly related to the valence order. The structural phase transition temperature T1 is also gradually shifted to 80 K at 2 GPa. However, the anomaly of the electrical resistivity at T1
is smeared and cannot be found at around 2 GPa [28, 29]. Therefore, the detailed behavior of T1 above 2 GPa is not understood.
Figure 1.16 depicts the temperature – pressure phase diagram reported by A. Miyake et al.
[28]. After the collapse of the valence order, the valence fluctuation is realized in all temperature ranges. We expected that magnetic order might emerge at a higher pressure region similarly to the heavy-fermion or intermediate-valence Yb-based compounds because Yb valence should approach a magnetic trivalent state with applying pressure. Previously, Sugishima et al.
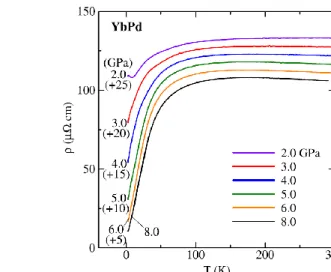
reported temperature dependence of electrical resistivity under high pressure of 2 ~ 8 GPa between T = 2 ~ 300 K. As shown in Fig. 1.17, Kondo-like behavior was observed but no anomalies associated with magnetic order was found. [30].
13
Figure 1.15. Temperature dependence of electrical resistivity of YbPd under various pressure up to 2.4 GPa [28].
Figure 1.16. Temperature – pressure phase diagram of YbPd [29].
14
1.3.3 Neutron diffraction studies
We have thought that the magnetic structure of YbPd should give insight into the valence order structure because only trivalent Yb ions have a magnetic moment while intermediate-valence ions have no magnetic moment. Previously, we carried out neutron diffraction measurements using single-crystal samples of YbPd and found magnetic Bragg peaks below T3. Figure 1.18 displays the rocking curve at d = 20.2 Å at T = 0.75 and 3 K, which was measured at the T1-2 spectrometer (AKANE) installed at the thermal guide in the JRR-3 reactor of the Japan Atomic Energy Agency at Tokai, Japan. A clear peak is observed at T = 0.75 K but suppressed at T = 3 K, which means that this is due to the magnetic order at T3 [30].
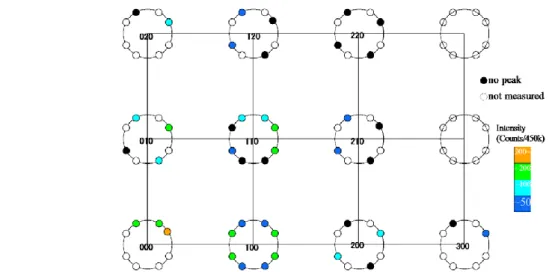
The magnetic peaks can also be found by a – 2 scan with Tohoku University Polarization Analysis Neutron Spectrometer (TOPAN) installed at the JRR-3, as shown in Fig. 1.19. The intensities and k-vectors of the magnetic peaks observed like this are summarized in Fig 1.20.
M. Sugishima, who belonged to our laboratory as a doctor course student, attempted to determine a magnetic structure of YbPd by analyzing these data but was not successful. It has been clarified that the intensity data are influenced by a domain structure which formed by the cubic – tetragonal structural phase transition at T1. We decide to measure neutron diffraction using powder samples to avoid influence by the domain structure.
Figure 1.17. Temperature dependence of electrical resistivity under pressure up to 8 GPa.
The resistivity curves are shifted by 5 for clarity [30].
15
Figure 1.18. Rocking curve at d = 20.2 Å versus crystal angle at T = 0.75 K and T = 3.3 K [31].
Figure 1.19. – 2 scan at T = 0.75 K and T = 3.3 K [31].
16
1.4 Eu
2Pt
6X
15(X = Al, Ga) 1.4.1 Eu
2Pt
6Al
15and Eu
2Pt
6Ga
15Recently, it has been reported that Eu2Pt6Al15 exhibits a first-order valence transition at T = 45 K [32]. Figure 1.21 demonstrates the crystal structure of this compound. The structure is a superlattice of the hexagonal Sc0.6Fe2Si4.9 type structure (space group: P63/mmc) and the orthorhombic Yb2Pt6Al15 type structure (Cmcm). We can regard the structure as an averaged hexagonal structure with a = 4.2947 Å and c = 16.667 Å [32].
Figure 1.22 depicts the temperature dependence of the magnetic susceptibility of Eu2Pt6Al15. The magnetic susceptibility increases at around 45 K on the heating process, which is associated with valence change from non-magnetic trivalent state to magnetic divalent state [32]. As shown in Fig. 1.23, electrical resistivity also shows a drastic increase at the same temperature ranges. Figure 1.24 displays the 151Eu Mössbauer spectra of Eu2Pt6Al15 measured at various temperatures. Observation of only one spectrum with an isomer shift of v = 0 mm/s at T = 6 K corresponds to a trivalent Eu ion. With increasing temperature, the trivalent spectrum declines and simultaneously the divalent one (v = −14 mm/s) grows at around 45 K. This is direct evidence of the valence transition. The co-existence of the trivalent and divalent spectra means that this transition is of first order [32].
Figure 1.20. Summarized intensities and k-vectors of magnetic Bragg peaks. The peaks are found at around nuclear diffractions. The intensities are classified by circle color. No peak is observed at a black circle [31].
17
Figure 1.21. Crystal structure of Eu2Pt6X15 (X =Al, Ga). Eu atoms are represented by blue circle, Al/Ga atoms by light blue and white, and Pt atoms by black [32].
Figure 1.22. Temperature dependence of magnetic susceptibility and inverse susceptibility of Eu2Pt6Al15 [32].
18
Eu2Pt6Ga15 crystallizes in the same structure as that of Eu2Pt6Al15 with lattice constants of a = 4.2989 and c = 16.767 Å. The Eu valence in Eu2Pt6Ga15 keeps the divalent state down to the lowest temperature, which is confirmed by 151Eu Mössbauer spectroscopy, as shown in Fig 1.25.
[32]. The splitting spectrum observed at 6 K indicates that the compound exhibits magnetic order. Figure 1.26 shows the temperature dependence of the magnetic susceptibility and inverse susceptibility of Eu2Pt6Ga15. The T-linear inverse susceptibility above 50 K indicates a Curie- Weiss law with an effective moment of 8.07B/Eu and a Weiss temperature of -30.7 K. The
Figure 1.23. Temperature dependence of electrical resistivity of Eu2Pt6Al15 [32].
Figure 1.24. 151Eu Mössbauer spectra of Eu2Pt6Al15 at T = 6, 35, 40, 45, and 78 K.
Blue and Green lines denote subspectra corresponding to the trivalent and divalent state, respectively [32].
19
effective moment is close to the theoretical value of Eu2+, 7.94B/Eu, which implies a divalent state. The cusp of the magnetic susceptibility at around 13 K corresponds to antiferromagnetic order [32].
Figure 1.25. 151Eu Mössbauer spectra of Eu2Pt6Ga15 at T = 6, 78, and 300 K. Green lines denote the signal of divalent state [32].
Figure 1.26. Magnetic susceptibility and inverse magnetic susceptibility of Eu2Pt6Ga15
versus temperature [32].
20
1.5 Purpose of this thesis
As mentioned in section 1.3.3, the magnetic structure gives insight into the valence order in YbPd. However, there are two problems in determining the magnetic structure; one is the domain structure, and the other is difficulty in obtaining a strain-free powder sample. The strains introduced during pulverizing a bulk sample suppress the phase transitions at T1 and T2
and broaden the Bragg peak of X-ray diffraction. Recently, we have succeeded in synthesizing strain-free powder samples of YbPd. Therefore, we try to determine the magnetic structure of YbPd by powder neutron diffraction using newly synthesized powder samples and discuss the valence order of YbPd from the viewpoint of the magnetic structure.
Second, it is expected that magnetic order emerges after the valence order is suppressed in YbPd. According to the previous report, however, no magnetic order is found up to 8 GPa down to 2.5 K. We measure electrical resistivity in the higher pressure region up to 12.5 GPa and in the lower temperature region down to 550 mK. Moreover, the pressure dependence of T1 above 2 GPa has been unclarified. We carry out powder X-ray diffraction under pressure to determine the phase boundary of T1. The behavior of YbPd in the higher-pressure regions is discussed on the basis of the electrical resistivity and X-ray diffraction measurements.
Third, Eu2Pt6Al15 is a new Eu-based compound that performs valence transition. The crystal structure of the compound is quite different from the tetragonal ThCr2Si2-type and hexagonal ZrBeSi-type structures, where Eu-based valence transitions have been discovered. Despite the difference in structure, the properties of valence transition seem to be similar to each other.
Examination of the properties of the valence transition in Eu2Pt6Al15 should give us fruitful information on the universality of valence transition in Eu-based compounds. Moreover, an isostructural Eu2Pt6Ga15 is an antiferromagnet with a stable divalent state. Substitution of Ga for Al in Eu2Pt6Al15 should shift the valence state toward a magnetic divalent state. We examine Eu2Pt6(Al1-xGax)15 by measurements of electrical resistivity, magnetic susceptibility, high-field magnetization, and X-ray absorption spectroscopy at Eu L3-edge.
21
2. Experimental Details
2.1 Sample preparation
A single crystal sample of YbPd was prepared by Yb self-flux method. We weighed Yb and Pd at a molar ratio of 65:35. The mixture of Yb lumps and Pd powders was sealed into a stainless tube under Ar atmosphere. The stainless tube was subsequently sealed in an evacuated quartz tube. The sample was heated to 1100 ℃, kept for 24 hours, and cooled down to 800 ℃ at a rate of -3 K/h. When bulk samples are pulverized, the dislocations are easily introduced to the lattice because YbPd samples are ductile owing to the simple crystal structure.
Post-annealing, which is often used to recover the crystallinity, resulted in products of Yb3Pd4
due to the high vapor pressure of Yb. This result gave us a clue to synthesize the strain-free powder sample of YbPd. YbPd powder can be obtained by annealing Yb5Pd2. Yb5Pd2 is a neighbor compound at a Yb-rich side in the Pd-Yb binary phase diagram and also a by-product of single-crystal synthesis. Yb5Pd2 has a complex crystal structure and is easily pulverized.
The Yb5Pd2 and Pd powders were weighed in a molar ratio of 1 : 1 ~ 1 : 2. The mixture of the Yb5Pd2 and Pd powders, which was wrapped in a Ta foil and sealed in an evacuated quartz tube, was kept at 650 ℃ for 90 hours. Figure 2.1 depicts the powder X-ray diffraction pattern of the new powder sample together with that of the pulverized bulk sample. The sharp Bragg peaks of the new powder sample mean that this powder sample is free from dislocations and strains.
However, it contains a small amount of Yb2O3 and YbH2 as an impurity.
Figure 2.1. Powder X-ray diffraction profiles of the new powder sample (black) and old powder sample [33] (red) of YbPd.
22
Polycrystalline samples of Eu2Pt6(Al1-xGax)15 (x = 0, 0.05, 0.1, 0.2, 0.3, and 1) were prepared by arc-melting constituent elements under Ar atmosphere of 0.08 MPa. The starting materials were weighed in a stoichiometric ratio. Eu ingots were pre-melted to remove absorbed gas.
Then, we melted the mixture of Pt, Al, Ga, and Eu.
2.2 Powder neutron Diffraction measurements
Powder neutron diffraction measurements were carried out at iMATERIA installed at BL-20 of the Material and Life Science Experimental facilities (MLF) at the Japan Proton Accelerator Research Complex (J-PARC) in Tokai by a time-of-flight (TOF) method. The powder samples were put into a vanadium cylinder with 6mm diameter together with He gas. The measurements were performed at 0.59 K (< T3) and 3 K (> T3) using a 3He closed-cycle refrigerator.
2.3 X-ray diffraction measurements under high pressure
We carried out powder X-ray diffraction measurement under high pressure at BL10XU of SPring-8. The powder samples were put into membrane diamond anvil cell with tiny ruby chips.
We adopted helium gas as a pressure medium. The samples were cooled down to 10 K by a closed-cycle helium refrigerator. Pressure applied to the samples was calibrated by a ruby fluorescence method. The wavelength of the X-ray was set to 0.414813 Å by a double crystal monochromator of Si (111) and Si (220). We used an imaging plate area detector for collecting the diffraction data.
2.4 Electrical resistivity measurements under high pressure
We measured the electrical resistivity of YbPd under high pressure using a conventional ac 4 probe method with a cubic anvil cell at the Institute for Solid State Physics, the University of Tokyo. The single-crystalline sample was put into the cell with a mixture of Fluorinert (FC70 : FC77 = 1 : 1) as a pressure transmitting medium. We applied pressure by a hydraulic pump at room temperature and the pressure was held by a clamping nut. The cell was cooled down to approximately 500 mK using a 3He cryostat.
23
2.5 Magnetic Susceptibility
We used the SQUID magnetometer (MPMS, Quantum Design co. Ltd.) to examine the temperature dependence of the magnetic susceptibility of Eu2Pt6(Al1-xGax)15. Small pieces of Eu2Pt6(Al1-xGax)15 are attached to the drinking straw. Temperature dependence of magnetic susceptibility was measured between T = 5 – 300 K in a heating process in a magnetic field of 0.1 T.
2.6 High-field magnetization process
We measured high-field magnetization measurements in a pulsed magnetic field up to 50 T with a pulse duration of about 40 ms by an induction method with well-balanced pick-up coils at the Center for Advanced High Magnetic Field Science in Osaka University. We measured the high-field magnetization at T = 4.2 K for all samples. For Eu2Pt6Al15, we examined the magnetization curves at various temperatures. The magnitude of magnetization data was calibrated using low-field data taken by the SQUID magnetometer.
2.7 X-ray Absorption Spectroscopy (XAS)
X-ray absorption spectroscopy (XAS) at the Eu L3-edge was measured by a transmission method at BL11 of SAGA Light Source. To adjust transmittance, the powdered samples of Eu2Pt6(Al1−xGax)15 were mixed with boron nitride (BN) powders and were pressed into a pellet.
The pellets were set on a sample stage made of Cu. The samples of x = 0, 0.05, and 0.1 were cooled down to 6 K with a 4He closed-cycle refrigerator. The measurements were conducted between 6 and 300 K on heating. For x = 0.2, 0.3 and 1, the measurements were done only at room temperature.
24
3. Results and Discussion on YbPd
3.1 Powder neutron diffraction
3.1.1 Powder neutron diffraction
Figure 3.1 shows the difference in the neutron diffraction pattern between T = 0.59 (< T3) and 3 K (> T3), which extracts magnetic contributions from the diffraction pattern. The magnetic Bragg peaks are found at d = 19.3, 9.95, 6.03, 5.24, and 4.66 Å. The peaks at d = 6.03 and 4.66 Å can be explained by the antiferromagnetic order of the impurity of Yb2O3 (TN = 2.3 K), whose magnetic structure was determined by R. M. Moon et al. [34] YbH2 exhibits no magnetic order with non-magnetic Yb2+ ions. Thus, the other magnetic peaks at 19.3, 9.95, and 5.24 Å are produced by the magnetic order of YbPd.
The most intense peak at d = 19.3 Å corresponds to that at d = 20.2 Å observed at 0.8 K in the previous single-crystal neutron diffraction. The slight discrepancy of d might be due to a lower resolution of the single-crystal measurement or to the temperature dependence of the magnetic propagation vector. A TOF measurement has a d resolution that is proportional to d. Comparison of the half widths at half maximum (HWHMs) of a nuclear peak of YbPd at d = 6.92 Å, of the magnetic peak of Yb2O3 at 6.03 Å, and of the magnetic peak of YbPd at 5.24 Å, which are observed at similar d values, reveals a linear relation between the HWHMs and d. This means that the width of the magnetic peaks of YbPd is not broadened intrinsically, which suggests the long-range magnetic order of YbPd.
Figure 3.1. The difference in neutron diffraction patterns between T = 0.59 and 3 K.
Vertical lines indicate the peak positions expected from the magnetic propagation vectors k
= (k1 0 k2), (k1 k2/2 0), and (k2/2 0 2k1).
25
3.1.2 Magnetic structure analysis
The previous single-crystal neutron diffraction clarified the magnetic propagation vector in the two-dimensional reciprocal-lattice space, as shown in Figs. 1.17 and 1.18, where vertical and horizontal axes are not decided. Because the domain structure is produced by the structural phase transition from cubic to tetragonal symmetry at T1, the axes must be in the a* or c*
direction in terms of the tetragonal symmetry. Thus, three candidates of the reciprocal lattice spaces with the axes of c*-a*, a*-a*, and a*-c* are possible, as shown in Fig. 3.2. Besides, the double structure along the c-axis below T2 makes the c* component of the propagation vector double. As a result, the possible propagation vector corresponds to k = (k1 0 k2), (k1 k2/2 0), or (k2/2 0 2k1) with k1 = 0.080 and k2 = 0.32. To determine the magnetic propagation vector, we calculate the magnetic peaks corresponding to the possible propagation vector, as shown in Fig.
3.1 as a vertical bar. The best reproduction of the observation is obtained for k = (k1 0 k2). In the following analysis, k = (k1 0 k2) is adopted.
The powder neutron diffraction measurements revealed the three magnetic Bragg peaks of YbPd. Assuming a single-k structure with k = (k1 0 k2), the magnetic peaks of YbPd were analyzed to determine a magnetic structure. Atomic parameters were determined by using the neutron diffraction data (Fig. 3.3) for T = 3 K taken at the backscattering bank of BL-20 (2 = 155°, d = 0.4 - 5.26 Å) [35, 36] by Rietveld refinement using the Z-code [37, 38] because the backscattering bank is satisfactory for detailed structure refinements due to the highest resolution data. The lattice constants were estimated to be a = 3.436751(2) Å and c = 6.924151(2) Å, with the atomic positions of Yb1 (0, 0, 0), Yb2 (0, 0, 1/2), and Pd (1/2, 1/2, z) with z = 0.23357(2). These values are employed for the following magnetic structure refinement.
Figure 3.2. Three possible reciprocal-lattice spaces are shown on the basis of the tetragonal symmetry. The cross marks depict the magnetic propagation vector.
26
We can narrow out the models of magnetic structure with the representation analysis method.
According to the Landau theory concerning a second-order magnetic transition, the magnetic structure can be given by the linear combination of the basis vectors that belong to the subgroup of lattice symmetry, whose symmetric operations do not change the propagation vector k [39].
SARAh can find the basis vectors, namely the magnetic structure models that are in agreement with the symmetry of the crystal structure [40]. The basis vectors proposed by SARAh with the propagation vector of k = (0.080 0 0.32) in the symmetry of P4/mmm are summarized in Table I. According to the SARAh results, the magnetic structure does not contain any rotation of the magnetic moments because all of the imaginary components (ima imb imc) of the basis vectors are zero. This result and the incommensurate long-periodical structure make a sinusoidal magnetic structure the most feasible. The SARAh also concludes that the magnetic moments are aligned within the ac-plain or along the a-axis.
Based on the SARAh results, the Rietveld refinements for the powder neutron diffraction patterns are conducted by the Fullprof program. [41] The following four models with k = (0.080 0 0.32) are investigated; (a) only Yb3+ ions have magnetic moments within the ac-plane, (b) only Yb3+ ions have moments along the a-axis, (c) both Yb3+ and Yb2.6+ ions have magnetic moments within the ac-plane, and (d) both Yb3+ and Yb2.6+ ions have magnetic moments along the a-axis. The fitting parameters with error bars are shown in Table II, where the error bars are
Figure 3.3. Rietveld refinement for the powder neutron diffraction profile for T = 3 K at 2
= 155°. The solid black circle indicates the observation. The red line stands for Rietveld calculation by Z-code. The light green line is the difference in intensity between
observation and calculation.
27
estimated from standard deviations. The 2 values, which indicate the quality of the refinement, are exactly the same for all the models.
The models (a) and (b) give almost the same results. The amplitude of the magnetic moments in the sinusoidal structure is estimated to be approximately 0.3 B. In model (a), the angle of the magnetic moments from the a-axis is 16±16°, which is estimated from the a- and c-axis components and errors. The large errors of the c-axis component and the angle mean that the result is essentially identical to that of the model (b). From almost the same 2 value, it is evaluated that model (b) with less fitting parameters is the most probable. The fitting result for the model (b) is shown as a red curve in Fig. 3.4.
For model (c), a similar value of 2 was obtained, in which the Yb2.6+ ions have much smaller magnetic moments than the Yb3+ ions do. However, the error bars of the magnetic moment are larger by one order than those obtained using models (a) and (b) (only the Yb3+ ions have magnetic moments). Such large error bars of the magnetic moments indicate the failure of the model (c).
For model (d), the magnetic moments of Yb3+ and Yb2.6+ ions are estimated to be 0.25±0.03
B and 0.02±0.03 B, respectively. It should be noticed that this model is essentially the same as the model (b) since the magnetic moments of Yb2.6+ are negligible. Therefore, it is concluded that the Yb2.6+ ions have no magnetic moments, which agrees with the valence ordering structure determined from the previous single-crystal X-ray diffraction [24, 25] and the previous Mössbauer results [23].
Finally, as shown in Fig. 3.5, the determined magnetic structure of YbPd is sinusoidal with the amplitude of ~0.3 B and the propagation vector of k = (0.080 0 0.32). Only the Yb3+ ions carry a magnetic moment aligned parallel to the a-axis in terms of the tetragonal symmetry, while the Yb2.6+ ions have no magnetic moment.
28
Table I. Basis vectors calculate from the space group P4/mmm with k = (0.080 0 0.32).
ma, mb, mc are real parts, and ima, imb, imc are imaginary parts of each magnetic moments component, respectively.
Irreducible
Representations Basis Vectors Atom Basis Vector Component
ma mb mc ima imb imc
1 1 0 0 0 0 0
1 0 1 0 0 0 0
1 0 0 1 0 0 0
29
Figure 3.4. Rietveld refinement for the powder neutron diffraction profile. The solid black square indicates the observation. The red line stands for Rietveld calculation by Fullprof.
The light green line is the difference in intensity between observation and calculation. The letter M represents the magnetic peak around the nuclear peak (h k l).
Table II. Fitting parameters obtained by the refinement of FullProf for each model. The magnetic ions are located at only the 1a (0 0 0) site for models (a) and (b) and at both 1a and 1b (0 0 1/2) sites for models (c) and (d). Pd atoms are at the 2h (1/2 1/2 0.23357) site.
Magnetic moments
Amplitude of magnetic moment
a-axis component c-axis component χ2
(a) Within ac-plane
Only Yb3+ ions 0.27 ± 0.09 μB 0.26 ± 0.04 μB 0.08 ± 0.08 μB 32.3 (b) along a-axis
Only Yb3+ ions 0.29 ± 0.02 μB 0.29 ± 0.02μB - 32.3
(c) Within ac-plane Both Yb3+ & Yb2.6+
0.3 ± 1.0 μB (Yb3+) 0.1 ± 0.7 μB (Yb2.6+)
0.3 ± 0.2 μB (Yb3+) 0.0 ± 0.3 μB (Yb2.6+)
0.0 ± 1.0 μB (Yb3+) 0.0 ± 0.6 μB (Yb2.6+)
32.3 (d) along a-axis
Both Yb3+ & Yb2.6+
0.25 ± 0.03 μB (Yb3+) 0.02 ± 0.03 μB (Yb2.6+)
0.25 ± 0.03 μB (Yb3+) 0.02 ± 0.03 μB (Yb2.6+)
- 32.3
30
The crystalline-electrical-field (CEF) 8 quartet ground state was determined on the basis of the cubic structure by the previous inelastic neutron scattering experiments [42]. The tetragonal symmetry essentially produces a doublet CEF ground state. Thus, the inelastic neutron scattering should be done again using the strain-free powder samples. Tokiwa et al. have reported that a magnetic entropy at 5 K amounts to (1/2)R ln 2, which is also consistent with the doublet ground state. The magnetic entropy is depressed to about 50% of (1/2)R ln 2 at T3
= 1.9 K, which is suggestive of instabilities of the magnetic ordering and/or the Kondo effect [43].
The former is possibly ascribed to the two-dimensional valence order structure of this compound. The valence order structure of YbPd, where the magnetic Yb3+ layers are separated
Figure 3.5. (a) The most probable magnetic structure of YbPd. The amplitude of magnetic moments is approximately 0.3 B. The propagation vector k = (0.080 0 0.32). (b) the periodicity in the a direction. (c) Periodicity in the c direction.
31
by the nonmagnetic Yb2.6+ layers, results in a large distance (~ 6.9 Å) between the magnetic Yb3+ layers. This fact reminds us of the two-dimensionality of the magnetic Yb3+ ions in YbPd.
Generally speaking, a two-dimensional XY or Heisenberg model with only nearest-neighbor spin interactions gives rise to no magnetic order,whereas a two-dimensional Ising one produces magnetic order [44, 45]. If the XY or Heisenberg model can be applied to this compound, the magnetic ordering could be destabilized. To confirm this situation, it is required to examine the anisotropic properties of magnetic susceptibility of YbPd. However, it is difficult to investigate them because the domain structure is formed in the valence order state of YbPd. Instead, inelastic neutron scattering is more realizable to obtain information on the doublet ground state and the anisotropic magnetic properties.
The sinusoidal magnetic structures, in which the magnitudes of magnetic moments are modulated in space by thermal fluctuations, can never be a ground state. There should exist another magnetic phase transition to a commensurate magnetic structure at a lower temperature than T3. Thus, the phase transition at T4 is inferred to be due to the magnetic phase transition.
The previous 170YbMössbauer spectroscopy revealed a distribution of hyperfine fields between T3 and T4 compared with hyperfine fields below T4 [], which is also consistent with the inference.
The magnetic structure below T4 should be examined by additional neutron diffraction studies at lower temperatures. Actually, the possible variation of the magnetic propagation vector was observed in the range T4 < T < T3, which may be a precursor to the phase transition to a commensurate magnetic structure.
The latter Kondo regime was also proposed by Tokiwa et al. They reported an enhanced electronic specific-heat coefficient of 0.22 J/K2 mol (= 0.44 J/K2 Yb3+-mol) [43]. In the ρ – T curves, a flat region between 4 and 8 K at ambient pressure [22] is transformed into a –logT dependent region at a pressure above 1 GPa [28, 29]. These results suggest the Kondo effect is significant. Very recently, M. Shiga et al. report point-contact spectra of YbPd, which is indicative of the Kondo effect with TK ~ 30K [46]. Besides, the amplitude of the magnetic moment is much smaller than that expected for the Γ8 CEF ground state, 0.57 μB or 2.1 μB, which is reminiscent of the shrinkage of the magnetic moment by the Kondo effect. However, we should intrinsically compare the amplitude with the magnetic moment in terms of the tetragonal doublet ground state. The inelastic neutron scattering study is desired.
32
3.2 High-pressure measurements of YbPd
3.2.1 X-ray diffraction measurements under high pressure
Figures. 3.6 (a) – (c) display temperature variation of a (0 0 l/2) superlattice diffraction peak for P = 0.3, 1.0, and 2.0 GPa. The superlattice peak is observed below 74 K at P = 0.3 GPa and below 50 K at 1.0 GPa. At P = 2.0 GPa, no peak of the (0 0 l/2) diffraction is found down to 10 K. These results mean that the valence ordering temperature T2 shifts to lower temperatures with applying pressure and is suppressed at P = 2.0 GPa, which is consistent with the previous reports [28, 29]. Additionally, a weak peak emerges at 2 = 3.5 – 3.6°, which is a little larger diffraction angle than that of the (0 0 1/2). The emergence of the peak is accompanied by the disappearance of the (0 0 1/2) peak, which probably corresponds to the incommensurate valence order between T1 and T2 with a propagation vector of (x x l/2) reported by R. Takahashi et al.
[16]. This weak peak is seen at T = 10 K for 5.0 GPa but invisible for P = 6.1 GPa. This result agrees with the suppression of T1, as described later.
Figure 3.6. Temperature variation of (0 0 1/2) superlattice diffraction peak under P = 0.3 GPa (a), 1.0 GPa (b), and 2.0 GPa (c).
33
Figure 3.7 shows temperature variation of a (4 0 0) Bragg peak for P = 2.0 (a), 3.7 (b), 4.4 (c), and 5.0 GPa (d). One can see peak splitting associated with the cubic – tetragonal structural transition at T1. Although in the electrical resistivity measurements, the anomaly at T1 was not visible above P =2.0 GPa [28, 29], the (4 0 0) peak is found to be split definitely up to 4.4 GPa.
Thus, T1 is defined as the onset of the peak splitting. On the other hand, the (4 0 0) peak remains one peak down to 10 K at P = 5 GPa, which means T1 is suppressed by the pressure of ~5 GPa.
This result indicates that the cubic valence fluctuating state exists down to the lowest temperature. In summary, a new T – P phase diagram is depicted in Fig. 3.8.
Figure 3.7. Temperature variation of the (4 0 0) Bragg peak under P = 2.0 GPa (a), 3.7 GPa (b), 4.4 GPa (c), and 5.0 GPa (d).
34
Figure 3.9 depicts the pressure dependence of lattice constants a and c at T = 10 K. Both a and c monotonically decrease with applying pressure. The lattice constant c decreases more rapidly than a and merges with the a at around 4 GPa, which means approaching the cubic structure.
The structural behavior under high pressure is evaluated by using the first-order Murnaghan’s equation of state [47],
𝑃 = 𝐵0 𝐵0′[(𝑉0
𝑉)
𝐵0′
− 1]. (3.1)
Here, B0, B0', and V0 stand for a bulk modulus, its pressure derivation, and the volume at ambient pressure, respectively. Based on this equation, we can express the unit cell volume as a function of pressure as,
𝑉 = 𝑉0(1 + 𝐵0′ 𝐵0𝑃)
−1 𝐵0′
. (3.2)
To determine B0 and B0', the present results are fitted with this equation. The B0 and B0' values are calculated to be 65 GPa and 8.8, respectively. The B0 value is much smaller than that of a cubic heavy-fermion system YbAgCu4 (100 GPa) [48]. The mean Yb valence of YbAgCu4 (v=
2.91 – 2.96) is closer to the trivalent state than that of YbPd (v~2.8) [49]. The smaller bulk modulus implies the change of the mean Yb valence under pressure in YbPd.
Figure 3.8. Temperature – Pressure phase diagram determined by powder X-ray diffraction under pressure.
35
3.2.2 Electrical resistivity measurements under high pressure
Figure 3.10(a) depicts the temperature dependence of electrical resistivity in the temperature ranges from 0.5 to 250 K under high pressure up to 12.5 GPa. For 4, 6, and 8 GPa, the behavior of the electrical resistivity is well agreed with the previous report [30]. Figure 3.10(b) shows the magnified graph of Fig. 3.10(a) in the lowest temperature regions. There exist no obvious anomalies of pressure-induced magnetic order and superconductivity down to 0.5 K for all pressures.
The electrical resistivity data are fitted with = 0 + ATn at low temperatures to examine the ground state behavior. The obtained residual resistivity 0 and the exponent n are plotted against pressure in Fig. 3.10(c). The deviation of n from 2 in all pressure ranges means non-Fermi liquid (NFL) behavior at low temperature. The rapid increase in n and drastic decrease in 0 between 4 and 8 GPa are probably associated with the suppression of T1. Above 8 GPa, n is almost independent of pressure and amounts to approximately 1. Such robust T-linear behavior is also observed in YbRh2Si2 [50] and -YbAlB4 [51]. Watanabe and Miyake have pointed out theoretically that the T-linear behavior of electrical resistivity is quantum critical behavior due to valence fluctuation [52]. The observed T-linear behavior implies that YbPd under pressure also belongs to the group of YbRh2Si2 and -YbAlB4. To clarify these points, further investigations in the lower temperature and higher pressure regions are desired.
As discussed above, the bulk modulus of YbPd at 10 K indicates the valence change with applying pressure. In the case of YbRh2Si2, the Yb valence state reaches Yb3+ only above 8.5
Figure 3.9. Pressure dependence of lattice constant a, c, and V1/3. The Red dashed line indicates the V1/3 curve calculated based on the first-order Murnaghan’s equation of state.
36
GPa [53], where magnetic ordering temperature increases definitely. Thus, the study on Yb valence under pressure also gives a deeper insight into pressure variation of the ground state of YbPd.
Figure 3.10. (a) Temperature dependence of electrical resistivity under various pressures.
These curves are shifted vertically for clarity. (b) The magnified graph of (a) in the low temperature regions. Dashed lines indicate = 0 + ATn curve. (c) The residual resistivity
0 and exponent n are plotted versus pressure.
37
4. Results and Discussion on Eu
2Pt
6(Al
1-xGa
x)
154.1 Lattice parameter
Figure 4.1 depicts the Ga content x dependence of the lattice constants a and c by analyzing the XRD profiles on the basis of the average hexagonal structure. The lattice constant c increases rapidly up to x = 0.2 and gradually above x = 0.2. On the other hand, the lattice constant a is almost independent of x up to x = 0.3 and increases gradually above x = 0.3. Such a rise of the lattice constants with the substitution is also observed in Eu(Pd1-xAux)2Si2 [20] and EuNi2(Si1-xGex)2 [54]. This behavior is related to the Eu valence change. As mentioned later, a rapid change of Eu valence is revealed in the substitution range below x = 0.2, where the c-axis increases rapidly.
4.2 Magnetic susceptibility
Figures 4.2(a) and 4.2(b) show the temperature dependence of the magnetic susceptibility and the inverse susceptibility of Eu2Pt6(Al1-xGax)15 measured in a magnetic field of 0.1 T. For x = 0, the susceptibility shows a sudden increase at around T = 45 K with increasing temperature, which is accompanied by the Eu valence change from a nonmagnetic trivalent state to a magnetic divalent state. Above T = 60 K, the susceptibility decreases in accordance with the
Figure 4.1. Lattice constants a, c versus Ga concentration x., Black and red solid circles stand for a and c, respectively.
38
Curie-Weiss law. An increase below T = 20 K is probably due to ferromagnetic impurity. The behavior agrees with the previous results [32]. For x = 0.05, the susceptibility shows the gradual deviation from the Curie-Weiss law at around 30K with decreasing temperature. This behavior indicates a smaller and more gradual variation of the mean Eu valence.
For x ≥ 0.2, the cusp is found at around T = 13 K, which is associated with the antiferromagnetic order transition. For x = 0.1, a tiny bend is observed at around T = 13 K, which is probably related to the antiferromagnetic order. By fitting the susceptibility data with the Curie-Weiss law, the effective moments peff and Weiss temperatures p are estimated to be 7.3 ~ 8.6 B/Eu and – 19 ~ − 14 K, respectively. These results indicate that Ga substitution decreases the valence transition temperature and produces antiferromagnetic order with the stabilized divalent state.
4.3 Electrical resistivity
Figures 4.3(a)-(c) show the temperature dependence of the electrical resistivity of Eu2Pt6(Al1- xGax)15. For x = 0, the resistivity shows a linear decrease down to 50 K, followed by a cusp related to the valence transition at around 40 K in the first cooling process. In the following first heating process, the resistivity shows a rapid increase at around 40 K and the cusp at 53 K. this behavior is well-agreed with the previous report [32]. The electrical resistivity shows a thermal hysteresis, which indicates that the valence transition is of first order. The irreversible enhancement of the electrical resistivity in the first heating process can be understood by microcracks introduced by the sharp first-order valence transition.
Figure 4.2. (a) Temperature dependence of magnetic susceptibility of Eu2Pt6(Al1-xGax)15. The inset depicts magnified graph in the low temperature regions for x = 0.1 ~ 1. Arrows indicate the anomaly at TN. (b) The inverse magnetic susceptibility is plotted as a function of temperature.
![Figure 1.4. Crystal structure of Yb 4 As 3 (anti-Th 3 P 4 type structure) [13]. In a valence ordered state, Yb 3+ ions are located at Yb I site and Yb 2+ ions at Yb II](https://thumb-ap.123doks.com/thumbv2/123deta/9785602.1868891/12.892.135.611.132.425/figure-crystal-structure-structure-valence-ordered-state-located.webp)
![Figure 1.7. Temperature dependence of electrical resistivity of EuPtP. [14]](https://thumb-ap.123doks.com/thumbv2/123deta/9785602.1868891/13.892.125.631.630.927/figure-temperature-dependence-electrical-resistivity-euptp.webp)
![Figure 1.8. Temperature variation of Eu mean valence in EuPd 2 Si 2 [19].](https://thumb-ap.123doks.com/thumbv2/123deta/9785602.1868891/14.892.112.669.259.552/figure-temperature-variation-eu-mean-valence-eupd-si.webp)
![Figure 1.11. Temperature dependence of the electrical resistivity of YbPd [22]. The inset shows a magnified graph in the low temperature region](https://thumb-ap.123doks.com/thumbv2/123deta/9785602.1868891/16.892.226.674.134.425/figure-temperature-dependence-electrical-resistivity-magnified-temperature-region.webp)
![Figure 1.14. 170 Yb Mössbauer spectra of YbPd at T =4.2, 1.4, and 0.05 K [23].](https://thumb-ap.123doks.com/thumbv2/123deta/9785602.1868891/17.892.234.651.131.428/figure-yb-mössbauer-spectra-ybpd-t-k.webp)
![Figure 1.15. Temperature dependence of electrical resistivity of YbPd under various pressure up to 2.4 GPa [28]](https://thumb-ap.123doks.com/thumbv2/123deta/9785602.1868891/19.892.218.561.133.424/figure-temperature-dependence-electrical-resistivity-ybpd-various-pressure.webp)
![Figure 1.22. Temperature dependence of magnetic susceptibility and inverse susceptibility of Eu 2 Pt 6 Al 15 [32]](https://thumb-ap.123doks.com/thumbv2/123deta/9785602.1868891/23.892.110.634.547.827/figure-temperature-dependence-magnetic-susceptibility-inverse-susceptibility-eu.webp)
