平成
26
年度 新技術説明会 創薬分野
October 28, 2014
新規糖尿病バイオマーカーを標的とする
2型糖尿病治療薬
斎藤�芳郎�
同志社大学�生命医科学部�医生命システム学科�
・准教授��
従来技術とその問題点
問題点
①:医師が薬剤を選択する
医学的判断基準が無い
問題点
②:投薬治療が、試行錯誤
となり、多くの無駄を含んでいる
糖尿病に対する薬剤の選択に医学的な判断基準はなく、臨床医の経験
に基づいて行われているのが現状
現状の問題点
糖尿病患者
医師による薬剤の選択・
投与
血糖値・
HbA1c値
による投薬の評価
効果が見られない場合
試行錯誤
新技術の特徴・従来技術との比較
糖尿病態において悪玉となる分子(セレノプロテインP)を標的とした薬剤の開発
→テーラーメイド2型糖尿病治療の実現
境界型・糖尿病型
→血中SeP濃度の測定
SeP高値群
→SePによるインスリン抵抗性の増加
SePを標的とした治療薬の選択
→糖尿病のテーラーメイド治療法の実現
インスリン抵抗性を増加し、
糖尿病を悪化する“セレノプ
ロテインP”を同定
(Cell Metabolism, 12, 483-‐495, 2010)
セレノプロテインP(
SeP)の
活性を抑制する手法を開発
(新技術)
本研究の目指すテーラーメイド2型糖尿病治療
必須微量元素セレン
S
O
abundance in man
75 kg
49 kg
(65%)
190 g
(0.25%)
13 mg
(1.7x10
-5%)
Se
75 kgの成人に含まれる
各元素量
E
: major element
E
: minor element
E
: trace element
(96%)!
(3.6%)!
(0.4%)!
主要元素
少量元素
微量元素
●Human Study
1.
克山(ケシャン)病
:中国・克山の風土病。土壌中のセレンが少ないため、
セレン欠乏化
→重篤な
心筋症
を生じる。
2.血中セレンの低下(土壌中セレン濃度の低い地域)→
動脈硬化
・
ガン
発症率
の増加
3.
HIV感染者
で血中セレン濃度の低下
→生存率の低下
●Animal Study
1.餌に含まれるセレンが、
免疫機能
や
雄性生殖
-‐精子形成
に重要
2.セレン含有蛋白質を作れないマウスー
初期胚性致死
translation
selenoprotein
N C Met Sec stop
SECIS : Sec insertion sequence
other protein Met stop mRNA 5' SECIS AUG UGA UAA or UAG 3' Sec
セレン含有蛋白質(セレノプロテイン)
NH
2-CH-COOH
Se
H
CH
2selenocysteine
(Sec)
セレノシステイン
? ? glutathione peroxidase (GPx) thioredoxin reductase (TR) iodothyronine deiodinase selenophosphate synthetase 15 kDa selenoprotein selenoprotein W selenoprotein function ROOH ROH T4 T3 redox regulation ATP + H2Se H3SePO3 + AMP selenoprotein P ROOH ROHSe Transporter
セレン含有タンパク質の生合成機構
セレノプロテインP
(selenoprotein P, SeP)
Sec
His-rich
Sec-rich
血漿中の主要なセレノプロテイン!
3'
5'
UAA
AUG
UGA
2 SECIS
SeP mRNA
SECIS : Sec insertion sequence!
69 kDa (362 アミノ酸)の糖タンパク質!
主に肝臓で生合成!
血漿濃度 5.3 μg/ml!
#ヒトSePタンパク質の!
精製法を確立!
#11種類の抗SePモノ!
クローナル抗体を作成!
SePに対するサンドイッチ
ELISA
の開発
BD1
HRP : horseradish peroxidase
AH5
SeP
HRP
SeP
1000
100
10
1
SeP (ng/ml)
0.0
0.5
1.0
1.5
2.0
A
45 010000
Plasma
concentration
5.3 ± 1.1 µg/ml
(n=77)
1 Y Saito, N Sato, M Hirashima, G Takebe, S Nagasawa and K Takahashi (2004) Biochem.J., 381, 841-‐846
2 Y Saito, T Hayashi, A Tanaka, Y Watanabe, M Suzuki, E Saito and K Takahashi (1999) J. Biol.Chem., 274, 2866-‐2871
3 G Takebe, J Yarimizu, Y Saito, T Hayashi, H Nakamura, J Yodoi, S Nagasawa, and K Takahashi (2002) J.Biol.Chem., 277, 41254-‐41258 4 Y Saito and K Takahashi (2002) Eur.J.Biochem., 269, 5746-‐5751
N末端
Sec x 1
His-‐rich
C末端
酵素活性部位
セレンに富む部位
過酸化脂質の還元
2,3細胞へのセレンの供給
4Sec: セレノシステイン
His-‐rich: ヒスチジンに富む部位
Sec x 9
SePの構造と機能
1
!
OOH
synthesis of selenoproteins
reduction of
phospholipid
SO
3-SO
3-heparan sulfate
phospholipid
Se-
transporter
-OOH
redox control
oxidative
stress
LDL
SePの生理機能ー酸化ストレス防御
!
Reduce phospholipid
hydroperoxide!
Oxidative
stress!
動脈硬化・癌の抑制
糖尿病病態に影響するヘパトカインの探索
ー金沢大学 医薬保健総合研究科 恒常性制御学・御簾先生
、
篁先生との共同研究
糖尿病患者・肝臓の
網羅的遺伝子発現解析
血糖値やインスリン抵抗性と
相関するヘパトカインの探索
セレノプロテインP(
SeP)の発現・
血漿濃度が血糖値やインスリン
抵抗性と相関する
肝臓
SePの発現および血漿SeP濃度と糖尿病病態
*
● SeP発現量-‐糖負荷後120分の
血漿グルコース濃度
● 血漿SeP濃度-‐空腹時血糖
*H Misu, T Takamura, Y Saito, K Takahashi and S Kaneko et al (2010) Cell Metabolism, 12, 483-495
SePの増加はインスリン抵抗性を増加する
*
● SeP投与によるグルコース負荷後
血糖値の増加
● SeP投与によるインスリン投与後
血糖値の増加
糖負荷
インスリン投与
*H Misu, T Takamura, Y Saito, K Takahashi and S Kaneko et al (2010) Cell Metabolism, 12, 483-495
セレンのサプリメントによる弊害ー大規模臨床試験からの報告
●セレンの抗がん作用・抗動脈硬化作用
↓
セレンのサプリメント効果の検証(1312人が参加)
ー大規模臨床試験
the Nutri[onal Preven[on of Cancer Trial(NPC試験)
毎日
200μ
gのセレン摂取
(
1日の所要量の約10倍、日本人の所要量の2倍)
↓
糖尿病を発症するリスクが高まる可能性
(Ann Intern Med 2007;147:217-‐23)
※セレンや抗酸化物質ビタミン
Eのサプリメントとしての有用性評価(3万5千人が参加)
ー
Selenium and Vitamin E Cancer Preven[on Trial(SELECT試験)で現在も検証されている
高血糖は
SePの発現を誘導する
● 糖尿病モデル動物に
おける
SePの増加
*H Misu, T Takamura, Y Saito, K Takahashi and S Kaneko et al (2010) Cell Metabolism, 12, 483-495
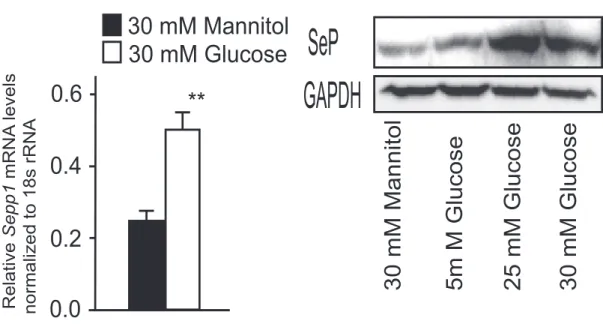
● グルコースによるSePの誘導
SeP-injected mice, although those of glucagon and GLP-1 were
unaffected during a glucose tolerance test (
Figure S1
C). Western
blot analysis showed a reduction in insulin-induced serine
phosphorylation of Akt in both liver and skeletal muscle of
SeP-injected mice (
Figures 3
J and 3K).
Hyperinsulinemic-eugly-cemic clamp studies showed that treatment with SeP
significantly increased endogenous glucose production and
de-creased peripheral glucose disposal (
Figure S1
D and
Figures 3
L
and 3M). Additionally, serum levels of injected human SeP
protein negatively correlated with rates of peripheral glucose
disposal (
Figure S1
E). These data indicate that SeP impairs
insulin signaling in the liver and skeletal muscle and induces
glucose intolerance in vivo.
D
A
B
SEPP1 mRNA levels in liver
0.5 1.0 1.5 2.0 350 250 200 150 Glucose 120 min.(mg/dL) 300 R = 0.33 (p=0.049)2
SEPP1 mRNA levels in liver
0.5 1.0 1.5 2.0 12.0 8.0 4.0 0.0 MCR (mg/kg/min) R = 0.43 (p=0.021)2
Serum SeP levels (µg/mL) 250
200 150
Fating Plasma Glucose (mg/dL)
300 R = 0.17 (p=0.014)2 2.0 4.0 6.0 8.0 2.0 4.0 6.0 8.0 12.0 8.0 6.0 HbA (%) 10.0 R = 0.27 (p=0.002)2 1c
Serum SeP levels (µg/mL)
E
1.0 0.5 ** 1.5 KK KKAy0.0
2.0
1.0
*
LETO OLETF0.0
2.0
1.0
Relative Sepp1 mRNA levels normalized to 18s rRNA*
3.0
OLETF LETO OLETF LETO0.0
1.0
0.5
*
1.5
KKAy KK SeP CBB stain SeP CBB stain Relative Sepp1 mRNA levels normalized to 18s rRNA DM Healthy8.0
4.0
2.0
6.0
Serum SeP levels ( µg/mL)0.0
*
F
H
G
C
SEPP1 mRNA levels in liver
0.5 1.0 1.5 240
160 120 80
Fasting Plasma Glucose (mg/dL)
200 R = 0.13 (p=0.054)2 Relative SeP protien levels normalized to CBB stain
I
J
Relative SeP protien levels normalized to CBB stain KKAy KKFigure 1. Elevation of Serum SeP Levels
and Hepatic Sepp1 Expression in Type 2
Diabetes
(A–C) Individual correlations between hepatic SEPP1 mRNA levels and metabolic clearance rate (MCR) of glucose (A), postloaded plasma glucose levels (B), and fasting plasma glucose levels (C) in humans (n = 12–17). MCR equals the glucose infusion rate divided by the steady-state plasma glucose concentration, and is a measure of systemic insulin sensitivity. MCR values were determined by glucose clamp. SEPP1 mRNA levels were quantified with DNA chips.
(D and E) Correlations between serum levels of SeP and fasting plasma glucose levels (D) and HbA1c (E) in people with type 2 diabetes (n = 35).
(F) Serum levels of SeP in people with type 2 dia-betes and healthy subjects (n = 9–12). Age and body weight were not significantly different between the two groups. Data represents the means ± SEM from two groups. *p < 0.05.
(G and H) Hepatic Sepp1 mRNA levels in an animal model of type 2 diabetes (n = 5–6).
(I and J) Serum SeP levels in an animal model of type 2 diabetes. SeP was detected by western blotting. Coomassie brilliant blue (CBB)-stained gel is used as a control for protein loading. Graphs display the results of densitometric quantification, normalized to CBB-stained proteins (n = 5).
Data represent the mean ± SEM from five to six mice per group. *p < 0.05, **p < 0.01. See also
Tables S1–S5.
Knockdown of Sepp1 in Liver
Improves Glucose Intolerance
and Insulin Resistance in Mice
with Type 2 Diabetes
To determine whether knockdown of
endogenous Sepp1 enhances insulin
signaling, we transfected H4IIEC
hepato-cytes with Sepp1-specific small
inter-fering RNA (siRNA), and we observed a
reduction in endogenous Sepp1 mRNA
and SeP protein levels (
Figures 4
A and
4B). Insulin-stimulated serine
phosphory-lation of Akt was enhanced in these
treated cells (
Figure 4
C). Similarly, delivery
of Sepp1-specific siRNAs into KKAy mice
via a hydrodynamic transfection method (
McCaffrey et al., 2002;
Zender et al., 2003
) resulted in a 30% reduction in SeP protein
levels in the liver and blood (
Figures 4
D–4G and
Figure S2
).
Knockdown of Sepp1 improved both glucose intolerance (
Figures
4
H and 4I) and insulin resistance (
Figures 4
J and 4K) in KKAy mice.
SeP-Deficient Mice Show Improved Glucose Tolerance
and Enhanced Insulin Signaling in Liver and Muscle
We further confirmed the long-term effects of lowered SeP using
Sepp1 knockout mice (
Hill et al., 2003
). SeP knockout mice were
viable and displayed normal body weights when maintained on
a selenium-sufficient diet. Body weight, food intake, and O
2consumption were unaffected by SeP knockout (
Figures S3
A
Cell Metabolism
Hepatokine Selenoprotein P and Insulin Resistance
Cell Metabolism 12, 483–495, November 3, 2010
ª2010 Elsevier Inc. 485
and S3B). Lipid accumulation in the liver and adipose tissues
was also unaffected (
Figure 5
A). However, postprandial plasma
levels of insulin were reduced in Sepp1
!/!mice, although blood
glucose levels remained unchanged (
Figures 5
B and 5C).
Glucose loading test revealed that Sepp1
!/!mice showed
improved glucose tolerance (
Figure 5
D). Insulin loading test
revealed that Sepp1
!/!mice showed lower blood glucose levels
60 min after insulin injection (
Figure 5
E). Insulin signaling,
including phosphorylation of Akt and insulin receptor, was
enhanced in the liver and skeletal muscle of Sepp1
!/!mice
(
Figures 5
F–5K). Additionally, Sepp1
+/!tended to show
enhanced insulin sensitivity. Plasma levels of glucagon, active
GLP-1, and total GIP were unaffected by the loss of SeP in
both fasted and fed mice (
Figure S3
C), suggesting that SeP
dysregulated glucose metabolism in vivo primarily by modulating
the insulin pathway, but not by affecting other hormones,
including glucagon, GLP-1, and GIP.
SeP Deficiency Attenuates Adipocyte Hypertrophy
and Insulin Resistance in Dietary Obese Mice
To determine whether SeP deficiency reduces insulin resistance
caused by diet-induced obesity, we fed SeP knockout mice
0.0 0.4 0.2 Relative Sepp1 mRNA levels normalized to 18s rRNA ** 30 mM Glucose 0.6 30 mM Mannitol 0.0 0.4 0.2 ** 0.6 0.8 0.25 mM Palmitate Vehicle 0 1.0 mRNA
levels normalized to 18s rRNA
Sepp1 * 0.5 Ad libitum Refed 1h Fast Refed 3h Refed 2h Pck1 G6pc * * ** ** ** ** ** ** ** ** 30 mM Glucose
30 mM Mannitol 5m M Glucose 25 mM Glucose
SeP
GAPDH
Insulin (µg/mL) 0 0.25
0.5
1.0
0.0 0.5 1.0 * * * Relative mRNA levels normalized to 18s rRNA 0.0 0.2 0.1 ** 0.3 0 0.5 0.4 ** Time of insulin (h) ** 12 6 3 Relative Sepp1 mRNA levels normalized to 18s rRNA Relative Sepp1 mRNA levels normalized to 18s rRNASeP
GAPDH
SeP
GAPDH
0.25 mM Palmitate Vehicle Vehicle Insulin 1.0 µg/mL Insulin 0.1 µg/mL Insulin 2.0 µg/mL * * * Sepp1 Pck1
A
B
C
D
E
F
G
H
Primary hepatocytes Primary hepatocytes
Primary hepatocytes
Figure 2. SeP Expression Is Regulated by Glucose, Palmitate, and Insulin
(A) Sepp1 mRNA levels in H4IIEC hepatocytes treated with glucose or mannitol (30 mM) for 6 hr (n = 4). (B) SeP protein levels in primary hepatocytes treated with glucose or mannitol for 6 hr.
(C) Sepp1 mRNA levels in H4IIEC hepatocytes treated with palmitate (0.25 mM) for 16 hr (n = 5). (D) SeP protein levels in primary hepatocytes treated with palmitate (0.25 mM) for 16 hr.
(E) Sepp1 and Pck1 mRNA levels in H4IIEC hepatocytes treated with various concentrations of insulin for 6 hr (n = 4). (F) Sepp1 mRNA levels in H4IIEC hepatocytes treated with insulin (0.1 mg/ml) for the indicated periods of time (n = 4). (G) SeP protein levels in primary hepatocytes treated with various concentrations of insulin for 6 hr.
(H) Liver Sepp1, Pck1, and G6pc mRNA levels in C57BL/6J mice following fasting for 12 hr and subsequent refeeding (n = 4).
Data in (A), (C), (E), and (F) represent the means ± SEM from four to five cells per group, and data in (H) represent the means ± SEM from four mice per group. *p < 0.05, **p < 0.01.
Cell Metabolism
Hepatokine Selenoprotein P and Insulin Resistance
糖尿病の発症・進展
糖尿病発症へと至る
SePを介した負のスパイラル
カロリー過多や
糖分の取り過ぎ
高血糖
SePの増加
インスリン
抵抗性の増加
高セレン食や
サプリメント?
セレノプロテインPのセレン運搬作用と糖尿病
!
脳
精巣
リンパ球
骨格筋
SeP
diabetes
SeP
SeP
SeP
肝臓
過剰セレノプロテインPによるインスリン抵抗性増加機構
Insulin
IR
Gene
Expression
Glut4
NOX4
H
2O
2GPx, glutathione peroxidase; SeP R, SeP receptor; IR, insulin receptor;
Glut4, glucose transporter type 4; NOX4, NADPH oxidase 4; H2O2, hydrogen peroxide
AMPK, AMP-‐ac[vated protein kinase
AMPK
SeP
SeP R
GPx
インスリン抵抗性の増加
セレンの供給
Insulin
IR
Gene
Expression
Glut4
NOX4
H
2O
2SeP
SeP R
GPx
インスリン抵抗性の増加
SePの結合
阻害
インスリン抵抗性
の改善
血漿
SePを標的とした
2
型糖尿病治療薬の創出(作用仮説)
AMPK
過剰
SePによる血管新生の抑制*
*K Ishikura, H Misu, Y Saito, S Kaneko, and T Takamura et al (2014) Diabetologia, 57, 1968-1976