Instructions for use
Title Effect of seasonal variation on physical activity and frailty among community dwelling elderly living in snowy cold regions
Author(s) 長谷川, 純子
Citation 北海道大学. 博士(保健科学) 甲第13781号
Issue Date 2019-09-25
DOI 10.14943/doctoral.k13781
Doc URL http://hdl.handle.net/2115/79656
Type theses (doctoral)
File Information Junko̲Hasegawa.pdf
学 位 論 文
Effect of seasonal variation on physical activity and frailty among community dwelling elderly living in snowy cold regions
(積雪寒冷地に居住する高齢者における身体活動量とフレイルに 対する季節変動の影響)
長谷川 純子
北海道大学大学院保健科学院 保健科学専攻保健科学コース
2019年度
Abstract 1
General Introduction 5
Ⅰ. Impact of season on the association between muscle strength/volume and physical activity among community-dwelling elderly people living in snowy-cold regions
8
Aim of the study 8
Methods 8
Results 11
Discussion 17
Conclusion 24
Ⅱ. Effect of a lower limb strength training programme on physical activity during the snowy season among community-dwelling elderly
individuals
25
Aim of the study 25
Methods 25
Results 32
Discussion 40
Conclusion 47
Ⅲ . Verification of seasonal frailty among community-dwelling elderly
living in snowy cold regions 48
Aim of the study 48
Methods 48
Results 52
Discussion 60
Conclusion 65
Key Findings 66
General Discussion 67
Conclusion 69
Acknowledgement 69
References 71
List of Archives 80
Table of Contents
Abstract
Background: Although the benefits of physical activity are well-known, levels of physical inactivity are increasing in many countries. Physical activity, particularly for preventive care of the elderly, must be encouraged. The level of physical activity undertaken by people is influenced by season; however, little is known about seasonal fluctuations of physical activity and its relation to muscle strength. Generally, physical activity declines in winter in snowy-cold regions. Physical activity is a diagnostic criterion for frailty, hence it is possible to assume that the status of frailty fluctuates depending on the season.
Objectives: The current study had three aims: 1) to clarify the association between physical activity levels and muscle strength/skeletal muscle mass during non-snowy and snowy seasons in northern Japan, 2) to investigate the effect of lower limb muscle strength training programme for elderly individuals on the physical activity during the snowy season, assuming physical strength benefits promoting physical activity, 3) to clarify the phenomenon of seasonal frailty and its association with health-related quality of life.
Methods: Participants were community-dwelling elderly people aged 65 years or older
living in Tobetsu, northern Japan. People who had a certificate needed long-term care
insurance which is run by municipal governments to provide long-term care services were
excluded.
In Chapter
Ⅰ, a 30-s chair-stand test (CS-30) and body composition measurements using bioelectrical impedance analysis were conducted prior to physical activity measurement using a three-dimensional acceleration sensor in both non-snowy and snowy seasons. Daily steps for the non-snowy and snowy seasons were compared using Welch’s t test. The association between the CS-30/skeletal muscle index and daily steps in both seasons was estimated by fitting multiple linear regression models, with age and sex as covariates.
In Chapter
Ⅱ, daily step counts were measured during the snowy season in2018 (with no exercise intervention) and 2019 (after the exercise intervention). Physical function was measured before and after the intervention, including body mass index, CS- 30, grip strength, normal gait speed, short-test battery for locomotive syndrome, Kihon checklist (KCL), and 25-question geriatric locomotive function scale. The 12-week
supervised exercise programme included a 1-hour exercise routine, performed twice per
week was conducted. The exercise programme consisted of 10-15 min warm-up, low-
intensity resistance training for the lower limbs and trunk (20-30 min), ergometer cycling
as moderate aerobic exercise (10-15 min), and a cool-down.
In Chapter
Ⅲ, a questionnaire was administered twice: in the snowy season andnon-snowy season. Frailty was judged using KCL. Self-rated health, life satisfaction, exercise satisfaction, and quality of life (QOL) scores for both seasons were obtained.
Depending on the status of frailty in both seasons, four classifications were established (robustness, non-snowy frailty, snowy frailty, and year-long frailty). Frailty was judged by 4
≤ of KCL score.Results: Average daily step counts were significantly lower during the snowy season, compared to the non-snowy season (P < .01). The CS-30 in the snowy season alone was significantly associated with daily step counts. Multiple linear regression analyses results revealed that, for the same muscle strength in both seasons, the daily step counts during the snowy season were fewer than those during the non-snowy season (Chapter
Ⅰ).To examine the effect of muscle strength training programme on the physical activity
during the snowy season, 11 women and 3 men (78.6±5.2 years old) were participated the
programme. The exercise intervention improved physical function, with a significant
increase in step count among individuals with lower baseline strength. Improved lower
limb strength positively correlated with an increase in step count (Chapter
Ⅱ).Regarding the investigation of seasonal frailty by questionnaire research, 144 valid responses were obtained. In today, 45% participants exhibited frailty throughout the year, 31% were robust throughout the year, and 10% exhibited frailty during either the snowy or non-snowy season. A multiple regression equation to predict the status of year- long frailty revealed cognitive decline, mood of depression, self-rated health, low physical strength and social frailty in the non-snowy season as the predictive factors. In addition, KCL score in the non-snowy season was the strongest predictor of QOL score (Chapter
Ⅲ).Conclusion: The muscle strength required to perform adequate physical activity depended on season. Lower limb muscle strengthening is an effective intervention to improve physical activity during the snowy season among community-dwelling elderly.
The status of frailty fluctuates seasonally in an individual, whose status vacillates between
the conditions of advanced frailty and robustness. Frailty in the non-snowy season is
considered a step in the progression of physical dysfunction.
General Introduction
In today’s super-aged society, health promotion of elderly people is an urgent issue.
It is important for everyone to live a healthy and independent life until their senior years, which is crucial not only for human dignity but also for effective utilization of limited funds and human resources in medicine or long-term care. Although physical and mental deterioration due to aging is a natural process for everyone, it is well known that appropriate exercise is effective for health promotion. The benefit derived from physical activity has been reported (Pete et al. 1995; NIH Consensus Development Panel. 1996).
Maintaining regular physical activity is one of the measures to be taken for preventive care of older people.
In terms of promoting physical activity, previous studies mostly focused on
behavior modification (Hobbs et al. 2013; Conn et al. 2011). Little has been reported
about the relationship between physical capacity or function and physical activity. Cooper
and colleagues (2017) reported that a higher level of moderate-to-vigorous physical
activity does not affect future muscle strength, whereas muscle strength is a determinant
of future activity level. In general, physical activity decreases as age increases; however,
among the elderly with sufficient muscle strength, the level of physical activity was
maintained/barely decreased.
Particularly in the cold snowy regions, regular physical activity is often limited during winter due to the cold temperature and snow (Arnardottir et al. 2017; Togo et al.
2005). Although the decline in physical activity during the cold snowy season is for a limited period only, it has been reported that negative effect on physical function occurs even over the short term (Krogh-Madsen et al. 2101; Olsen et al. 2008). However, if muscle strength is a key underlying component of physical activity (Cooper et al. 2017), older individuals with sufficient lower limb muscle strength might be able to maintain their physical activity levels regardless of the season.
Physical activity is one of the factors of diagnosis criterion of frailty (Fried et al.
2001). No unified definition of frailty is yet to be decided but it is considered that a status of low resilience to stress caused by the decreasing reserve capacity followed by aging.
Due to seasonal fluctuation in physical activity, the status of frailty might change
depending on the season. Assuming seasonal change in physical activity depends on
muscle strength, seasonal status of frailty depends on muscle strength likewise and might
be an indicator of the seriousness of the frailty; namely with a progress of frailty, elderly
firstly tend to decrease their amount of physical activity in snowy season, then they will
be frail regardless of the season with further progress.
Outline of the study
In this thesis, the author described seasonal fluctuation in physical activity and frailty, particularly, regarding the association of lower limb muscle strength.
In Chapter
Ⅰ, the difference in the association between physical activity and lowerlimb muscle in both snowy season and non-snowy season is discussed. In Chapter
Ⅱ,the author compares physical activity (daily steps) in 2 straight snowy seasons; The first winter season and next one after 3 months supervised exercise intervention in order to clarify the effect of the exercise intervention on the physical activity in the snowy season.
In Chapter
Ⅲ, the author confirms the phenomenon of “seasonal frailty”, and
investigates the association between the status of frailty and health-related quality of life.
I. Impact of season on the association between muscle strength/volume and physical activity among community-dwelling elderly people living in snowy-cold regions
*Aim of the study
To clarify the association between physical activity level and muscle strength/skeletal muscle mass during non-snowy and snowy seasons.
Methods
Participants were community-dwelling elderly people aged 65 years or older who regularly attended senior club events in Tobetsu-town, northern Japan. Tobetsu-town is designated as a special heavy snowfall zone. The yearly average cumulative amount of snowfall is more than 8 m (Meteorological Agency. 2018). Prior to enrollment in this study, written informed consent was obtained from all participants.
Measurement of lower limb muscle strength and volume
To estimate lower limb muscle strength, the 30-second chair-stand test (CS-30) was
*Chapter I modified the original article published on Journal of Physiological
Anthropology. 2018; 37:1-6.
conducted as demonstrated in a previous study (Nakatani et al. 2002). Skeletal muscle volume was measured with bioelectrical impedance analysis using InBody s10 (InBody Japan, Tokyo, Japan). Per the criterion provided by the Asian Working Group for Sarcopenia (Chen et al. 2014), the skeletal muscle mass index (SMI) was calculated. From March to July 2017, 59 participants underwent these measurements.
Physical activity during the non-snowy season
To count participants’ daily steps from July to October 2017, the wearable fitness tracker Misfit Shine2 (Misfit, San Francisco, United States) with confirmed validity and reliability (Straiton N et al. 2018) was used. Participants wore the tracker for more than seven complete days. A dedicated application for the tracker was used to visualize daily step counts, and average daily steps were used for statistical analyses. In this measurement, 54 out of 59 people participated; however, the data of 4 people were lost due to bugs while synchronizing the data with the application.
Physical activity during the snowy season
Participants attached not only the same wearable fitness tracker, but also a Kenz
Lifecorder GS (Suzuken, Nagoya, Japan) for insurance against data deficits during the
snowy season. The author explained the circumstances to participants and added the
Lifecorder to monitor step counts. Participants were instructed to detach the Lifecorder
only while bathing and sleeping. Although the data from the fitness tracker were used preferentially, there were nine instances of data deficit. To compensate, the compatibility of step counts measured by the wearable fitness tracker and Lifecorder was checked using Bland and Altman’s method (Bland and Altman. 1986). Accordingly, 78 pairs of step count data were analyzed; the average and standard deviation of the differences in paired data (bias) were 265.8 and 1455.4, respectively. Although 95% of the data were within limits of agreement, a proportionality effect in which the fitness tracker was underestimated by over 3300 steps was observed. To convert data from the Lifecorder to those in the fitness tracker, a single regression analysis was conducted to obtain a regression equation and the step counts estimated by the regression equation were applied for the nine data deficits. Daily step counts for 29 people were obtained. Of those, 24 participated in both non-snowy and snowy season measurements. In other words, 26 people out of 50, who had their step counts measured in the non-snowy season, did not have their step counts measured in the snowy season.
Statistical analyses
Age, body mass index (BMI), SMI, CS-30, and daily steps in the non-snowy and
snowy seasons were compared using Welch’s t-test. For both seasons, the associations
between CS-30/SMI and daily steps were estimated by fitting multiple linear regression models, in which age and sex were set as covariates. All data were analyzed using JMP Pro 13.1.0 (SAS Inc., United States), with the significance level set as 5%.
Results
Table 1 displays the characteristics of participants in both non-snowy and snowy seasons. No significant difference was observed between the two groups regarding mean age, BMI, SMI, and CS-30. The average daily step counts for Japanese people aged 70 years or older were 5744 steps and 4856 steps for men and women, respectively, according to a national survey held in 2016 (Ministry of Health, Labour and Welfare.
2018). Among men, daily step counts for both seasons were lower than the average. On
the other hand, daily step counts for women during the non-snowy season constituted
approximately 150% of the Japanese national average; however, the step counts
drastically declined until they fell lower than the Japanese average during the snowy
season. The average daily step counts were significantly lower during the snowy season,
compared to the non-snowy season (P < .01). Table 2 displays the association between
CS-30/SMI and daily step counts for both seasons.
Table 1. Physical characteristics of participants in both non-snowy/snowy seasons
Non-snowy season Snowy season
Total Male Female Total Male Female P
Number of participants 50 13 37 29 8 21 -
Age 77.8 ± 5.3 79.5 ± 5.3 77.2 ± 5.3 78.4 ± 5.8 80.6 ± 5.5 77.5 ± 5.8 .65 BMI 24.5 ± 3.1 25.0 ± 2.8 24.3 ± 3.2 25.6 ± 3.5 26.8 ± 2.3 25.1 ± 3.8 .16 SMI 6.4 ± 1.0 7.4 ± 0.8 6.1 ± 0.8 6.6 ± 0.9 7.6 ± 0.6 6.2 ± 0.7 .43 CS-30 15.4 ± 4.3 13.3 ± 3.7 16.1 ± 4.3 15.6 ± 5.4 12.6 ± 4.5 16.8 ± 5.4 .86 Daily step counts 6.5 ± 3.2 4.6 ± 2.2 7.2 ± 3.2 4.2 ± 2.0 3.7 ± 2.3 4.4 ± 1.9 < .01
Note: Daily step counts are displayed in units of one thousand. P-values are between both
seasons among all participants. BMI: body mass index, SMI: skeletal muscle mass index,
CS-30: a 30-second chair-stand test
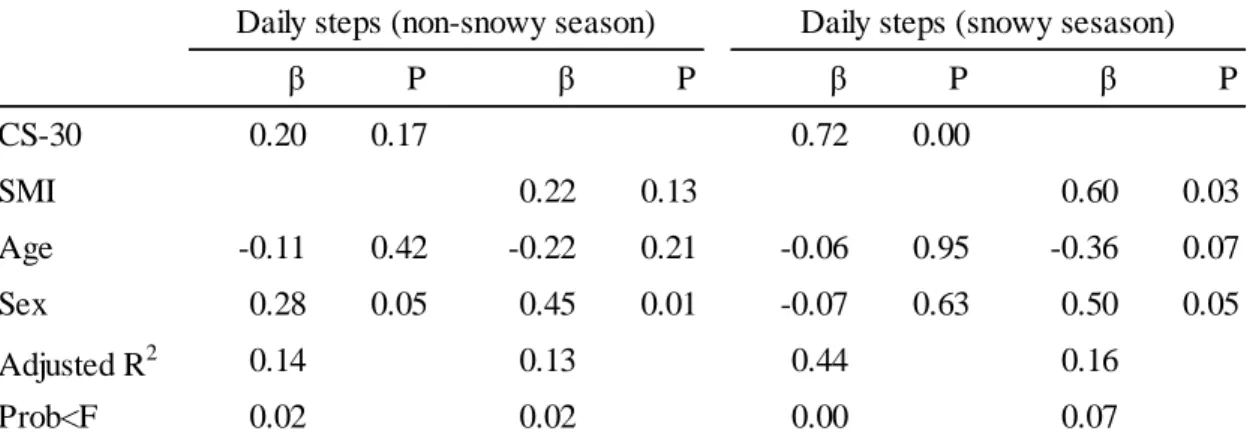
Table 2. Effect of CS-30/SMI on daily step counts according to multiple linear regression analysis
Note: Covariates included age, sex, and CS-30 or SMI. Two separate models were run for each season. Data are presented as standardized β (β) and P-values (P). A negative β-value indicates an inverse relationship. CS-30: a 30-second chair-stand test, SMI: skeletal muscle mass index
β P β P β P β P
CS-30 0.20 0.17 0.72 0.00
SMI 0.22 0.13 0.60 0.03
Age -0.11 0.42 -0.22 0.21 -0.06 0.95 -0.36 0.07
Sex 0.28 0.05 0.45 0.01 -0.07 0.63 0.50 0.05
Adjusted R2 0.14 0.13 0.44 0.16
Prob<F 0.02 0.02 0.00 0.07
Daily steps (snowy sesason) Daily steps (non-snowy season)
On setting daily steps during the non-snowy season as a dependent variable, neither
CS-30 nor SMI were significant predictors of daily step counts, although both the
regression equations were significant. When the dependent variable was set as daily steps
during the snowy season, the regression equation for SMI was non-significant (P = .07),
although the standardized partial regression coefficients were relatively high (β = 0.60)
and P = .03. For CS-30, the regression equation was significant, and CS-30 was the main
component of the equation, as well. To simplify the association between muscle strength
and daily step counts, Tables 3 and 4 display the correlation between CS-30/SMI and
daily step counts, and the regression equation stratified by sex, since the author judged
that age had no influence according to the results demonstrated in Table 2.
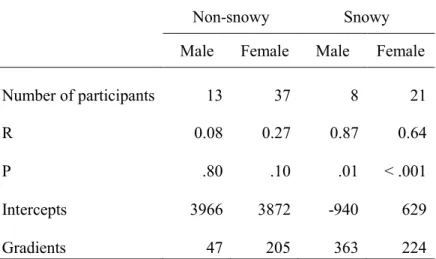
Table 3. Effect of CS-30 on daily step counts according to single regression analysis stratified by sex
Non-snowy Snowy
Male Female Male Female
Number of participants 13 37 8 21
R 0.08 0.27 0.87 0.64
P .80 .10 .01 < .001
Intercepts 3966 3872 -940 629
Gradients 47 205 363 224
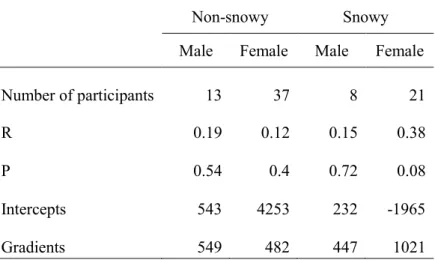
Table 4. Effect of SMI on daily step counts according to single regression analysis stratified by sex
Non-snowy Snowy
Male Female Male Female
Number of participants 13 37 8 21
R 0.19 0.12 0.15 0.38
P 0.54 0.4 0.72 0.08
Intercepts 543 4253 232 -1965
Gradients 549 482 447 1021
As indicated by the multiple linear regression model, no correlation was observed during the non-snowy season, whereas a significant positive correlation was observed during the snowy season between physical activity and muscle strength. The single regression analysis indicated the same tendency as the multiple linear regression model.
When daily step counts were the dependent variable, the intercepts were approximately 4000 for both male and female participants in the non-snowy season, whereas in the snowy season, they were approximately 600 for female participants, and 1000 for male participants. If the possible values of CS-30 range 0–40, according to the judgment criteria, even when the regression equation of the non-snowy season was not considered significant, daily step counts in the snowy season were overwhelmingly lower than those during the non-snowy season for the same level of muscle strength.
Discussion
Our results reveal that daily step counts during the snowy season were significantly lower than during the non-snowy season. This supports the findings of most previous studies (Matthews. 2001; Tudor-Locke et al. 2004; Hamilton et al. 2008; Newman et al.
2009). In this study, the association between lower limb muscle strength/volume and daily
steps was examined prospectively. As a result, CS-30 and average daily step counts
demonstrate a significant positive correlation only during the snowy season. Interestingly, this correlation was not observed during the non-snowy season. Although the SMI demonstrated a similar tendency as muscle strength, no significant difference was confirmed.
In the snowy season, the condition of roads completely differs from that in the non- snowy season; during the snowy season, roads are frozen or have a snowy surface. A person’s strategy of walking on such roads also differs from his or her normal gait.
Regarding walking on frozen road surfaces, detailed kinematics were analyzed. The flexion/extension moment of rotation of the hip joint increases while walking on a slippery floor (Nagaoka et al. 2009). To avoid slipping on a frozen road surface, increased flexion/extension movement enables the floor reaction force to be adjusted vertically.
This means that greater muscle strength of hip flexion/extension is required to avoid slipping on a frozen road. In addition, in a snowy season environment, people must push the snow aside using their legs. Moreover, rubber boots—which are often worn during the snowy season—and winter clothes tend to be heavier than normal clothing. By comprehensively considering these factors, the author speculates that greater muscle strength is required for people to walk outside in snowy season.
Physical activity is essential for the promotion of health. Studies have reported
various effects of physical activity, such as the reduction of mortality rate and risk of cardiovascular disease, metabolic diseases, obesity, falls, dementia, osteoporosis, and musculoskeletal diseases. The quantity–response association between physical activity and health was reported; however, even very-low-intensity physical activity is effective in promoting health. Engagement in physical activity is affected by factors such as pedestrian infrastructure and road safety (Moran et al. 2014). In addition, studies have examined various types of interventions to promote physical activity (Hobbs et al. 2013;
Conn et al. 2011); however, the association between physical capacity and activities of
daily living has not been well investigated. This research gap was successfully addressed
by the current study. As mentioned earlier, Cooper and colleagues (Cooper et al. 2017)
reported that older adults who maintained/improved their muscle strength were more
likely to increase their levels of physical activity during follow-up, and those who
increased their level of physical activity did not increase their muscle strength. The results
of the current study reveal that muscle strength is a key factor that affects the level of
physical activity of individuals, which coincides with the results reported by Cooper and
colleagues. Low muscle strength is likely one of the causes of inactivity. Conversely, if
muscle strength is improved with appropriate interventions, it may promote physical
activity.
The author showed that muscle weakness is a plausible cause of inactivity during winter; however, inactivity can occur for various reasons. The weather, such as temperature, rain, or wind, influences physical activity (Chan et al. 2006). Further, regardless of season, people with a fear of falling tend to curtail activities (Howland et al.
1998). To promote physical activity, the usage of a cane, non-slip shoes, or such items should be considered to offset individuals’ fear of falling. In addition, to understand how people seek necessary information to avoid falling while walking outdoors, especially on slippery road surfaces, it is vital to dispel people’s fear of falling. Suzuki and colleagues reported that elderly people tend to pay much more attention to other things rather than the walking path or their footing on an icy road (Suzuki et al. 2012). Auditory information or sensations received from the sole of the foot are potential information to avoid falling as well as visual information. Such understanding of walking characteristics may enlighten elderly adults and prevent falling.
Since there was a seasonal difference in the association between lower limb muscle
strength and daily step counts, the author assumes that the muscle strength required to
perform sufficient physical activity depends on the season. In other words, adequate
muscle strength guarantees sufficient physical activity regardless of the season; however,
when muscle strength declines to a certain level, sufficient physical activity can be
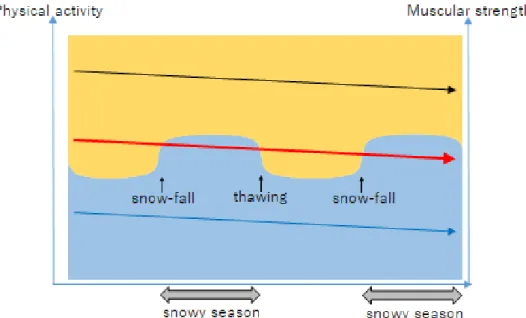
guaranteed in the non-snowy season alone. Schematically, Fig. 1 presents this hypothesis.
Fig 1. Hypothesis of seasonal fluctuation on muscle strength required to perform
physical activity. The vertical axes represent muscle strength and physical activity. The
background color refers to physical activity; the blue zone implies physically inactive,
whereas the orange zone implies active. Three different levels of muscle strength are
displayed using the three arrows in Fig. 1. The arrows represent individuals with different
muscle strength levels; the black, blue, and red arrows represent adequate muscle strength,
remarkably low muscle strength, and intermediate muscle strengths, respectively. The
gentle downward slope of each arrow represents muscle weakness due to aging. Although
these arrows may slope downward due to a certain event or the degree of slope may differ
between individuals, the arrows are presented as even lines here. The black arrow
indicates individuals who are physically active throughout the year, and, likewise, blue
indicates those who are inactive. The individuals represented by the red arrow show
seasonal fluctuations in physical activity, with adequate physical activity during the non-
snowy season and inactivity during the snowy season
The level of lower limb muscle strength required to be physically active is higher in the snowy, rather than the non-snowy season, as mentioned above. On the premise of lower limb muscle strength weakening due to aging, when healthy elderly people reach a certain level of muscle strength, they can be physically active during the non-snowy season but be inactive during the snowy season. Although a healthy elderly person’s strength gradually weakens with the passage of time, activity in the non-snowy season, coupled with inactivity in the snowy season, illustrates the early stages of elderly frailty.
In other words, seasonal fluctuations in physical activity among community-dwelling elderly people in snowy-cold regions could be a key factor in the early diagnosis of frailty.
Moreover, this presents further implications for clarifying the methods/timing of intervention or resilience during the snowy and non-snowy seasons, although the hypothesis requires further study.
This study had some limitations. First, the sample size was small; however, the
study applies appropriate statistical analyses. Second, the use of two different instruments
to measure physical activity levels required the use of suitable conversion methods. Third,
physical activity was evaluated using daily steps alone, which does not reflect activity
intensity. Fourth, alertness for falling might affect physical activity levels; however, this
point was not considered in the current study.
Conclusion
In this study, the author focused on the association between seasonal changes in
physical activity and lower limb muscle strength/volume among the elderly. Similar to
previous studies, the author confirmed that the level of physical activity decreased during
the snowy season. The author hypothesized that there is a seasonal difference in the lower
limb muscle strength that is required to maintain the level of physical activity. Further,
the author obtained basic knowledge to promote the health of elderly people living in
snowy-cold regions.
II. Effect of a lower limb strength training programme on physical activity during the snowy season among community-dwelling elderly individuals
Aim of the study
The aim of the current research was to evaluate the effect of a lower limb strength training programme for elderly individuals, performed before the winter season, on daily step counts during the winter season, compared to step counts obtained the previous year without an exercise intervention.
Methods
Participants were community-dwelling elderly people, aged ≥65 years, who regularly attended a community-based activity programme in Ishikari-Tobetsu, northern Japan. All participants provided written informed consent. Invitation of the recruitment was announced at community hall while candidate participants were attending community-based activity. Inclusion criteria were aged ≥65 years, living independently in community, and not diagnosed dementia. Finally, 35 individuals were recruited.
Measurement of daily step counts during the snowy season in 2018
Daily step counts for 35 individuals were measured from January to March 2018,
using both the wearable Misfit SHINE2 (Misfit, San Francisco, USA) and Kenz Lifecorder GS (Suzuken, Nagoya, Japan) step tracker. The SHINE2 tracker was dominantly used as it can be worn day and night, while the Kenz Lifecorder, which requires doffing during bathing, used a backup system in case of data deficits. Participants wore the SHINE2 tracker and Kenz Lifecorder for more than seven complete days. For the Misfit SHINE2 tracker and the Kenz Lifecorder system, the average daily step count was obtained using the dedicated application. All data were obtained from the Misfit SHINE2 tracker; hence, no data loss was observed.
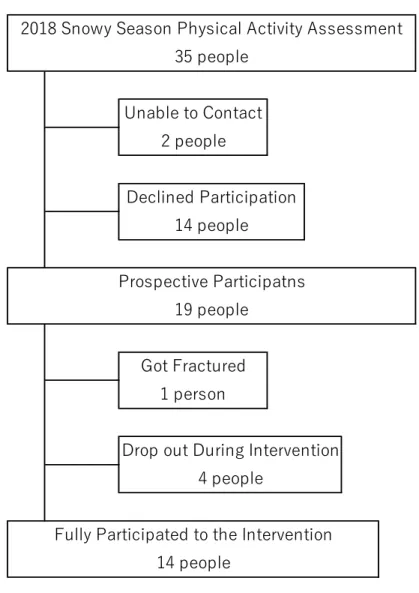
Enrolment of exercise intervention
Thirty-five individuals whose daily step counts in the snowy season of 2018 were
measured were approached for enrolment into our study for baseline measurement and
for completion of the 12-week exercise intervention programme, conducted from
September to November 2018. Of these individuals, 2 could not be contacted at the time
of baseline measurement and 14 declined participation, leaving 19 prospective
participants. Of these 19 participants, one sustained a fracture, leaving 18 participants for
initial evaluation. Fourteen completed the exercise intervention since 4 dropped out (2 for
health problem, 2 for their own convenience) (Fig 1).
Figure 1. Participant enrollment flow chart
Drop out During Intervention 4 people
Fully Participated to the Intervention 14 people
Declined Participation 14 people
Prospective Participatns 19 people
Got Fractured 1 person
35 people
2018 Snowy Season Physical Activity Assessment
Unable to Contact 2 people
Assessment of physical function and frailty before exercise intervention
Initial assessment of physical function was performed early in September 2018, including the following measurements: body mass index (BMI, kg/m2), 30-s chair stand test (CS-30; Jones et al. 1999; Nakatani et al. 2002), grip strength (measured using a dynamometer), normal gait speed, short-test battery for locomotive syndrome (including the stand-up and two-step tests; Nakamura and Ogata, 2016), Kihon checklist (Arai et al.
2015; Ogawa et al. 2011), and the 25-question geriatric locomotive function scale (GLFS- 25; Seichi et al. 2012). CS-30 was adopted as the main index to confirm the effectiveness of the exercise intervention (lower muscle limb strength). The Kihon checklist, which was developed by the Japanese Ministry of Health, Labor and Welfare, was chosen to assess the status of frailty (Satake et al. 2016; Sewo et al. 2016; Satake et al. 2017). The Kihon checklist consisted of 25 yes/no questions, and the total score ranges from 0 to 25.
A cut-off point of ≥8 is considered to indicate frailty. It is also categorised into seven domains, such as activities of daily living, physical strength, nutrition, oral function, isolation, cognition, and mood of depression which allow us to understand the main factor of frailty. GLFS-25 has 25 questions, and each has a 5-point grading scale (0-4 points) leading to a total of 100 points of simple scoring.
Exercise intervention programme
The 12-week exercise programme was conducted from September through November 2018. The programme included a 1-h exercise routine, performed twice per week. Subjects were encouraged to perform the programme at home when unable to attend the schedule sections, and on the next session, the contents of home exercise were confirmed orally. Of the 14 subjects enrolled into the study, only 2 completed the full 24 sessions of the exercise training programme. On average, subjects completed 21.6 of the 24 sessions.
The exercise programme included the following components: a 10-15 min warm- up; resistance training for the lower limbs and trunk (20-30 min), ergometer cycling (10- 15 min), and a cool-down period as shown in a previous study (Yoshimura et al. 2017).
Prior to the exercise programme, subjects participated in an education session regarding the principles of muscle strengthening. Based on current exercise guidelines, low- intensity resistance exercises were used, performed at a low velocity (Tanimoto and Ishii.
2005). The resistance exercise programme consisted of the following exercises: knee
extension and hip flexion on chair sitting position, ankle extension/flexion, knee flexion,
step and weight shifting and squat on standing position, bridge with both shoulders
grounded, straight leg raising in spine and side lying, scissors kicking, and plank on
elbows or side plank on lying position. The initial duration of the muscle contraction was
determined based on self-report levels of muscle fatigue, with subjects encouraged to perform as many repetitions as possible during class-style sessions. The intensity cycling was adjusted to 60%-70% of the expected maximum heart rate which was calculated by Karvonen formula, as moderate intensity. Resting heart rate was measured every week, and the target heart rate during exercise was adjusted accordingly. The duration of the muscle contraction and the number of repetition of the resistance exercise were increased, as possible, through the intervention period.
Post-intervention assessment
Measures of physical function were repeated after the last exercise session, for comparison to pre-intervention physical function. A subjective assessment of the intervention was included.
Measurement of daily step counts during the snowy season in 2019
Daily step count measurements were iterated in January 2019 using the same method as that used in the previous year. All data were obtained from the Misfit SHINE2 tracker.
Statistical analysis
The average daily step count during the snowy season between 2018 and 2019, the
main outcome of this study, was compared using a paired t-test. To confirm the effect of
the exercise intervention, pre- and post-interventions measures of physical function (BMI, CS-30, grip strength, normal gait speed, and Kihon checklist) were compared using a paired t-test after ensuring the normality of the data distribution. Change in the GLFS-25 and 2-step test, before and after the intervention, was evaluated using the Wilcoxon rank test. The author further evaluated the CS-30 and daily step count stratified by the level of grip strength before the exercise intervention, the level of daily step counts measured in 2018 (year before the intervention programme), and the presence of body pain after the exercise intervention. Stratification for analysis was performed as follows: the criteria of the Asian working group on sarcopenia was used for grip strength (Chen et al. 2014), and step count was divided into high and low using the cut-off of 4746 steps as previously reported for elderly individuals in Japan (Ministry of Health, Labour and Welfare, Japan.
2016). The presence of body pain was evaluated using the 4 pain-related questions of the GLFS-25 (questions, 1-4): subjects with a score of ≥3 points were classified as having
“pain”, with those with a score ≤2 points as having “no pain”. The correlation between
the change in lower limb strength and average daily step count was evaluated. All data
were analysed using JMP Pro 13.1.0 (SAS Inc., USA), with the significance level set as
5%.
Ethical clearance
This study was approved by the Human Research Ethics Committee of the School of Rehabilitation Sciences, Health Sciences University of Hokkaido (authorisation number 18R083079).
Results
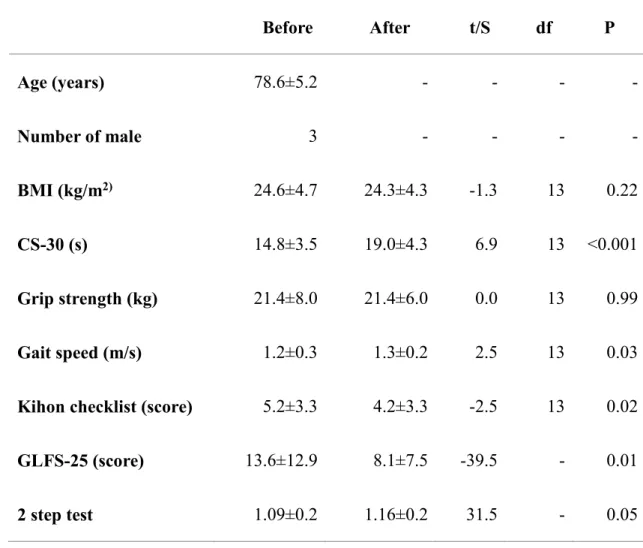
The study group included 11 women and 3 men aged 78.6±5.2 years. The physical
function measures, obtained before and after the exercise intervention, are reported in
Table 1. Grip strength and BMI remained unchanged. The CS-30 provided a good
indicator of lower limb strength and increased, on average, by 130%. The Kihon checklist
was also significantly improved. The GLFS-25 score improved significantly, with
specific improvement on the following 4 (of the 25) questions: “To what extent do you
have daily pain with movement?” (the score changed from 0.79 to 0.36; t(13)=-2.48,
p=0.03), “To what extent do you have difficulty going up and down stairs?” (likewise
from 0.92 to 0.29; t(13)=-3.23, p<0.01), “To what extent do you have difficulty with brisk
walking?” (from 1.07 to 0.71; t(13)=-2.69, p=0.02), and “How far can you walk without
rest?” (from 1.21 to 0.57; t(13)=-2.85, p=0.01). Subjective assessment of physical
function capacity was also improved for the following items: “When I lost my balance on
a slippery road, I was able to manage not to fall”. “I used to lag behind my son while
walking, but now I am comfortable walking with my son and can keep up”. “I used to get
tired when I climb the stairs at the station, but now I am able to keep climbing at the same
speed from beginning to end”. “I had little appetite but now, I really enjoy my food
especially, after the exercise”. “I will miss the opportunity to exercise with my friends in
this group, but will try to continue exercising by myself because I realise the important
effect of the programme”.
Table 1. Physical function measured before and after the exercise intervention Before After t/S df P
Age (years) 78.6±5.2 - - - -
Number of male 3 - - - -
BMI (kg/m
2)24.6±4.7 24.3±4.3 -1.3 13 0.22
CS-30 (s) 14.8±3.5 19.0±4.3 6.9 13 <0.001
Grip strength (kg) 21.4±8.0 21.4±6.0 0.0 13 0.99
Gait speed (m/s) 1.2±0.3 1.3±0.2 2.5 13 0.03
Kihon checklist (score) 5.2±3.3 4.2±3.3 -2.5 13 0.02 GLFS-25 (score) 13.6±12.9 8.1±7.5 -39.5 - 0.01
2 step test 1.09±0.2 1.16±0.2 31.5 - 0.05
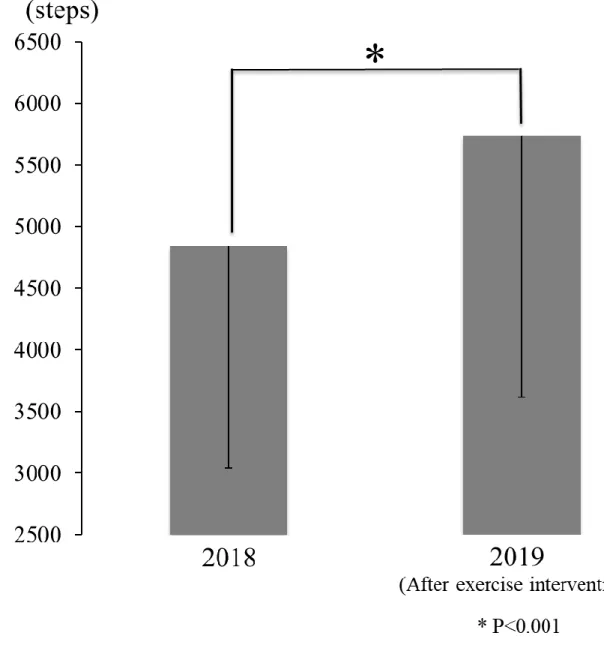
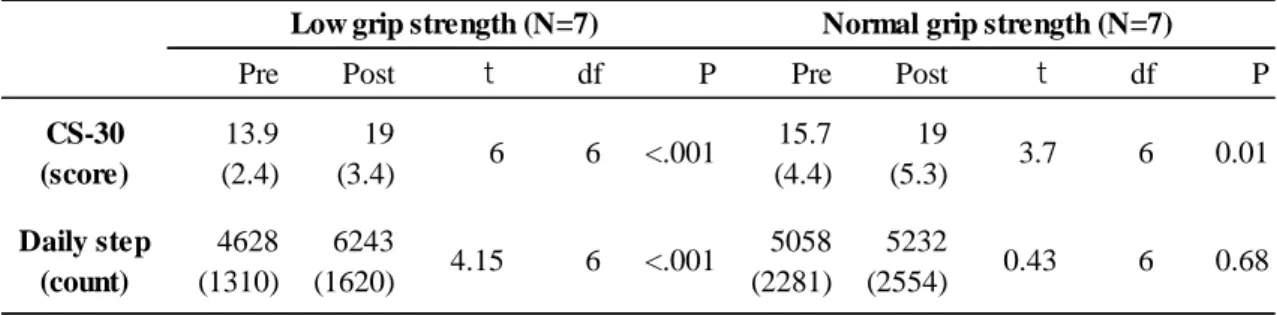
The main outcome of our study was comparison of the average daily step count between the 2018 snowy season (without prior exercise intervention: 4843±1801 steps) and the step count in 2019 (after the exercise intervention: 5738±2121 steps). The average daily step counts of our study group in 2018 (t=2.7, df=13, p=0.02) were significantly increased in 2019, with an average overall increase of 120% (Fig. 2). After stratification by initial grip strength, the effect of the exercise intervention on the CS-30 and average daily step count was greater for the low than for the high grip strength group (Table 2).
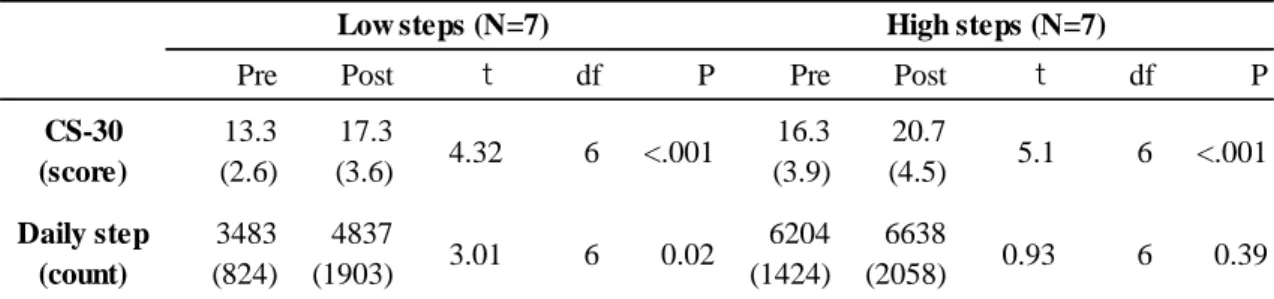
Similarly, after stratification by the average daily step count prior to the intervention, the
daily step counts improved only for subjects in the low step count group (Table 3). After
stratification for pain, the CS-30 improved in both groups after the intervention, with a
significant improvement in the average daily step count achieved in the “no pain” group
(Table 4). Increase in lower limb strength correlated positively to the increase in the
average daily step count, although this correlation was not significant (r=0.43, p=0.13).
Figure 2. Comparison of daily step counts in snowy season without exercise intervention
(2018) and after exercise intervention (2019)
Table 2. Effect of the lower limb strength training intervention, stratified by initial grip strength
Note: Low grip strength was defined as <26 kg for men and <18 kg for women.
Bracketed numbers in the table show standard deviation.
Pre Post t df P Pre Post t df P
CS-30 (score)
13.9 (2.4)
19
(3.4) 6 6 <.001 15.7
(4.4)
19
(5.3) 3.7 6 0.01
Daily step (count)
4628 (1310)
6243
(1620) 4.15 6 <.001 5058 (2281)
5232
(2554) 0.43 6 0.68
Low grip strength (N=7) Normal grip strength (N=7)
Table 3. Effect of the lower limb strength training intervention, stratified by daily step counts measured in 2018
Note: The low-step group was defined as <4746 steps (based on the average step count of elderly individuals in Japan). Bracketed numbers in the table show standard deviation.
Pre Post t df P Pre Post t df P
CS-30 (score)
13.3 (2.6)
17.3
(3.6) 4.32 6 <.001 16.3 (3.9)
20.7
(4.5) 5.1 6 <.001 Daily step
(count)
3483 (824)
4837
(1903) 3.01 6 0.02 6204
(1424)
6638
(2058) 0.93 6 0.39
Low steps (N=7) High steps (N=7)
Table 4. Effect of the lower limb strength training intervention, stratified by body pain
Note: The presence of body pain was defined as a score of ≥3 points on the 4 pain-related questions of the GLFS-25. Bracketed numbers in the table show standard deviation.
Pre Post t df P Pre Post t df P
CS-30 (score)
15.3 (1.8)
18.8
(10) 4.87 5 <.001 14.3 (4.5)
19.1
(5.8) 5.16 7 <.001 Daily step
(count)
4861 (1335)
5797
(2125) 1.41 5 0.22 4830
(2180)
5694
(2263) 2.38 7 0.05
With pain (N=6) Without pain (N=8)
Discussion
Improved measures of physical function, such as lower limb muscular strength indicated by CS-30, arising from our muscle strength training programme significantly improved the average daily step count during the subsequent snowy season, compared to step counts obtained during the snowy season 1 year prior (without an exercise intervention). Previously reported average daily step counts, determined nationally in Japan for individuals aged ≥70 years, in 2016, were as follows: 4746±3535 steps, overall;
5219±3728 steps for men and 4368±3327 steps for women (Ministry of Health, Labour
and Welfare, Japan. 2016). The average step counts in the study group in 2018 were
comparable to those of the national 2016 average. The health promotion benefits of
strength training for the prevention and treatment of lifestyle diseases and improvement
of physical function (including improving low back and knee pain) are well-known
(Garber et al. 2011; Hayden et al. 2005; Simic et al. 2015). The current findings indicate
that strength training can also improve physical activity, particularly during the snowy
season. This is reasonable because people have to push the snow covering the road surface
while walking outside. Moreover, to avoid slipping on icy road, stronger muscle is
required during hip flexion/extension (Nagaoka et al. 2009). The direct benefit of the
intervention is supported by the significant improvement identified on the items related
to walking and movement of the GLFS-25. This is a reasonable anticipated outcome, which confirms previous findings of the importance of physical activity promotion (Iwaya et al. 2017). As the weather influences physical activity, the author confirmed that the weather condition was not remarkably different between the 2018 and 2019 winter seasons, with an average cumulative snowfall of 32 cm and 35 cm, respectively, and temperatures of -5.8°C and -8.9°C, respectively, measured in Shinshinotsu, the nearest meteorological point from the study site. The findings according to the result confirm that lower limb strengthening can enhance physical activity among elderly individuals, as previously reported (Hasegawa et al. 2018).
The relationship between improved lower limb strength and increased step count,
however, was not a simple linear relationship. As shown in Table 2, the improvement in
lower limb muscle strength (CS-30) and step count was greater for individuals in the low
than in the high grip strength group, where grip strength was measured prior to the
intervention. Similarly, as shown in Table 3, although the CS-30 and daily step count
improved overall, the daily step count improved significantly only among subjects in the
low step count group at baseline. This indicates that greater effectiveness of the exercise
intervention can be expected among elderly individuals with lower baseline physical
function. This finding may assist in identifying individuals who should be targeted for an
exercise intervention. Of note was the further finding of smaller improvements in strength among subjects who experience daily pain compared to those without pain (Table 3).
Moreover, the increase in daily step count did not reach significance among subjects with pain. Future studies with larger study groups are warranted to support multiple factor analysis to identify factors predictive of the effectiveness of a strength training programme in increasing daily step count among community-dwelling elderly individuals.
The comparison of the average daily step counts between the snowy season of 2018 and 2019 was based on the premise that the exercise intervention would improve lower limb muscle strength. The conducted 60-min structured intervention, performed twice in a week for 12 weeks, was comparable to a previously used programme (Kim et al. 2012;
Kim et al. 2013) and produced comparable benefits on normal gait speed and lower limb strength. The previous programme used moderate-intensity resistance training, but low- intensity and slow movement resistance exercise was applied for the intervention.
Continuous muscle contraction induces high intramuscular pressure which restricts blood flow into the muscle; thus, similar effect of exercise on vascular occlusion can be obtained.
The effect of low-intensity resistance exercise was confirmed by improvement of lower
limb muscle strength and normal gait speed that are well known as indices of physical
function of the elderly. The current findings of a greater benefit of exercise among
subjects with lower baseline strength is important from a public health perspective, as these individuals are considered at a high risk for poor health conditions (Celis-Morales et al. 2018). This is a crucial finding which might have practical implications for the design of long-term health promotion programmes among community-dwelling elderly individuals. The findings indicate that pain control may optimise improvement in lower limb strength (as measured by the CS-30). Further research is needed to translate these findings to practice.
A contribution of moderate-to-vigorous physical activity to better health outcomes
has been acknowledged. On the contrary, the importance of activities of daily living, such
as sitting, standing, and walking, is also recognised in terms of energy expenditure
(Levine et al. 2000). As previously reported by the author’s research group (Hasegawa et
al. 2018), walking outside in the snowy season requires greater muscle strength and hence,
the accumulation of both indoor and outdoor physical activities is important. There is
evidence that overall physical activity declines among home-dwelling elderly individuals
in winter, compared to that in autumn, with this seasonal effect being greater among
individuals living in colder temperatures (Hayashi et al. 2017). An issue to consider,
which is specific to Japan, is the effect of partial heating systems that are common and
may further limit indoor physical activity levels during the winter; however, the author
did not include subjects’ living environment in the assessment. Regardless of the season, physical activity level is inversely associated to feelings of fatigue, with fatigue levels predisposing to sedentary behaviour (Engberg et al. 2017). Furthermore, nonagenarians who experience less fatigue have a longer life expectancy and greater muscle strength (Mänty et al. 2014). Therefore, improvement in muscle strength could be effective in reducing subjective fatigue, as well as ameliorating physical activity capacity.
Although the importance of increasing physical activity among elderly individuals is well-known, a practical method to promote physical activity among this segment of the population is not straightforward. The results do show that a structured, 60-min programme of muscle strengthening, performed two times per week, over the three months before the winter season, was effective in enhancing physical activity among elderly individuals during the snowy months. As such, the author believes that the intervention could provide an effective model of intervention to lower the risk of physical activity decline among community-dwelling elderly individuals living in snowy regions.
As it is necessary to provide valid measures to justify interventions to improve the overall
health standard of elderly individuals, further clarification of the parameters of the
programme is needed, such as the optimal duration of strengthening programme for
physical activity promotion, as well as determining the most practical way to improve
muscle strength among community-dwelling elderly people.
Notably, this study has small sample size, with only 19 of the original 35 subjects willing to participate, of which only 14 had completed the 3-month exercise programme.
Therefore, there is a need to further examine factors associated with exercise adherence among elderly individuals. Recently, a national health promotion strategy has been adopted in Japan to enhance physical activity among elderly individuals through the creation of community-based programmes that promote fun physical activity and provide an opportunity for social interaction. However, considering the importance the author identified in enhancing lower limb muscle strength over a specific time-period (i.e., 3 months prior to winter in our study), instructor direction/supervision might be beneficial in prevention strategies. An appropriate training stimulus must be also considered, including the type of exercise, as well as the intensity, duration, and number of repetitions.
In the current study, some individuals reported exercising at home but not to the
extent that they felt fatigue. As it is unrealistic that experts can be available to supervise
all exercise interventions, there is a need to identify factors that can enhance the
effectiveness of home-based programmes. This would also be important considering
other factors that can impede participation in an exercise programme, such as the distance
from the venue, inconvenience, and expenses of transportation and time restrictions.
Training community-based elderly individuals to act as “instructors” (known as train the trainer model) could provide a practical and effective solution. Several train the trainer models already exist in Japan. For example, elderly individuals have been trained to perform frailty checks among local residents in Kashiwa City, acting as “Kashiwa frailty prevention supporter”. In the Ibaraki prefecture, the “Silver rehabilitation exercise”
programme trained exercise instructors among community residents. Yamada et al. (2017) also reported that educated volunteer staff encouraged effective self-management exercise groups. Once these projects are well recognised by community residents, they tend to become rooted within the community and sustained. Collaboration with college programmes in training students in exercise prescription might also provide an opportunity for the development of a sustainable community-based programme of exercise for elderly individuals.
The present study has the following limitations. First, the sample size was small;
however, novel findings were obtained with appropriate statistical analysis. Second, possible factors related to a level of physical activity such as social/psychological factors and environment factors including public transport were not considered. Further research is desired with a large sample size to also analyse other related factors mentioned above.
Third, in this study, only daily step counts represented a level of physical activity. Activity
intensity and sedentary behaviour should be considered to clarify the effect of improved lower muscle strength.
Conclusion
The author described a 60-min exercise programme, performed 2×/week, which
was effective in the improvement of lower limb muscle strength which, in turn, positively
correlated with an increase in physical activity during the winter months, measured using
the daily step count. Future research is needed to identify factors that can enhance
adherence to a home- and community-based exercise programme.
III. Verification of seasonal frailty among community-dwelling elderly living in snowy cold regions
Aim of the study
Seasonal fluctuation of frailty might be an indicator of the seriousness of the condition; specifically, in a progression of frailty, older adults first tend to decrease their amount of physical activity in the snowy season, after which point they will continue to become progressively frailer regardless of the season. The author named this study the
‘seasonal frailty hypothesis’, aiming to verify the present criteria of seasonal frailty and its association with health-related quality of life.
Methods
Participants were community-dwelling elderly aged 65 years or older who regularly attended community-based senior activities in Tobetsu town, northern Japan. People who had a certificate needed long-term care insurance which is run by municipal governments to provide long-term care services were excluded.
The current research was conducted by distributing questionnaire twice: in the
snowy season and non-snowy season. 260 questionnaire forms for snowy season were
distributed to senior club members from January to February 2019. 181 out of 260 questionnaire forms were collected by mail. 178 questionnaires for non-snowy season were sent in May 2019 because three of 181 were missing physical address data. The status of frailty was judged according to the Kihon checklist (KCL). The KCL, which was developed by the Japanese Ministry of Health, Labour and Welfare, was selected to assess the status of frailty (Satake et al. 2017; Sewo et al. 2016). It consists of 25 Yes/No questions, and the scoring ranges from 0 to 25. A cut-off point of ≥8 is considered sufficient to indicate frailty, and 4-7 is considered a pre-frailty condition (Satake et al.
2017). The test also comprises seven categorised representing domains: (1) activities of
daily living, (2) physical strength, (3) nutrition, (4) oral function, (5) isolation, (6)
cognitive decline, and (7) depressive mood. These sub-domains allow for a better
understanding of primary features and manifestations of frailty. Based on an original
classification reported by Satake et al. (2017), a score of 4-7 points constitutes a condition
of pre-frailty; however, in the current study, a point of ≥4 was considered frailty, since
our study targeted the transitional period from robust to frailty. Social frailty was judged
according to the method of Makizako et al. (2015), which consisted of five questions
concerning the following scenarios: (1) living alone, (2) going out less frequently
compared with the prior year, (3) hardly visiting friends, (4) feeling not helpful to friends
or family, and (5) having no opportunity to talk with someone every day. Social frailty was judged when confirming more than two questions among the above five. Several questionnaires were not completely filled out, but, when it was possible to ascertain a cut- off point, the reply was regarded as valid. Self-rated health, life satisfaction, sense of ability to undertake daily exercise (exercise satisfaction) and QOL score calculated by Japanese version EQ-5D-5L (Ikeda et al. 2015) were also investigated.
Statistical analysis
According to the status of frailty in both snowy/non-snowy seasons, the following
four groups were identified; Robust (robust/robust), non-snowy frailty (robust/frailty),
snowy frailty (frailty/robust), year-long frailty (frailty/frailty). To examine the risk factors
for year-long frailty group, a stepwise regression method was used to narrow down the
key contributing factors. The following variables were used to derive a multiple
regression equation: sex, age (65-69, 70-74, 75-79, 80-84, ≥85), the presence of any
family member living together, performance within the five sub-domain categories of
frailty (low physical strength, low oral function, poor standard of activities of daily living,
cognitive decline, and depressive mood), social frailty, life satisfaction, self-rated health,
exercise satisfaction, and the presence of three or more medication types. All factors
(excluding sex, age and presence of family living together) were used for both
snowy/non-snowy seasons, and established as candidate for contributing factors. All of them were categorical variables.
As a precondition for investigating the association between frailty and health- related quality of life, the correlation of KCL (which served the basis of an appraisal of frailty) and QOL score was confirmed. For the purpose of this correlation analysis, the average scores for snowy/non-snowy season was used for both KCL and QOL score. A one-way analysis of variance (ANOVA) was followed by a multiple comparisons test using the status of frailty among the four identified groups. In addition, in order to compare the strength of the influence of the KCL scores in both snowy/non-snowy seasons on the QOL score, a multiple regression equation was generated in which the QOL score was set as the outcome variable, and the KCL score in snowy/non-snowy seasons, sex and age were the designated independent variables.
Ethical clearance
This study was approved by the Human Research Ethics Committee of the School
of Rehabilitation Sciences, Health Sciences University of Hokkaido (authorisation
number 18R090084).
Results
A total of 181 questionnaires were collected for the snowy season, of which three had missing physical address data. As a result, 178 questionnaires were sent to the same participants in the non-snowy season, and 158 were returned. Of these, 144 were able to demonstrate comparative levels of frailty in snowy/non-snowy seasons, and so could be used for analysis (Fig 1). An overview of the participants is shown in Table 1. Table 2.
shows the result of assessment of frailty in both snowy/non-snowy seasons. Stepwise
regression analysis was conducted by setting the frailty group (identified as frailty in both
snowy/non-snowy seasons) as outcome variable. Five factors were selected as effective
predictors: (1) cognitive decline, (2) mood of depression, (2) self-rated health, (4) low
physical strength, and (5) social frailty during the non-snow season (Table 3). The
multiple regression equation derived by these five predictors was a significantly
predictive formula (R
2=0.48).
Figure 1. Questionnaire distribution/collection flow chart
Invalid Data14
Valid Data
144 people (62 male, 82 female) Questionnaire Collected
181 people
Address missing 3 people
Quesionnaire Distributed (Non-Snowy Season) 158 people
Questionnaire Distributed (Snowy Season) 260 people