2017 Cultural Administration Research Survey
A Quantitative Evaluation:
The Economic and Social Effects of Culture
March 2018
Agency for Cultural Affairs, Japan
Published in 2019
Agency for Cultural Affairs, Japan
Headquarters for Vitalizing Regional Cultures 43-3 Bishamoncho, Higashiyama-ku, Kyoto 605-8505, Japan
Tel; +81-75-330-6720 Fax; +81-75-561-3512
Email; [email protected] https://www.bunka.go.jp/
©2019 Agency for Cultural Affairs-Japan
Research: Communication Design Institute
83 Tomoecho, Karasuma-dori Muromachi Higashiiru, Nakagyo-ku, Kyoto
604-0863, Japan
i
Introduction
This report is a survey report on the economic and social impacts of culture, mainly from the perspective of economic scale. The survey was commissioned by the Agency for Cultural Affairs to the Communication Design Institute under the title of “2017 Cultural Administration Research Survey-A Quantitative Evaluation: Economic and Social Effects of Culture”.
The survey period is from December 15, 2017 to March 30, 2018. The outline is as follows.
(1) Purpose of the survey
In cultural administration, when considering what fields in the future or in what methods to implement highly effective cultural policies and measures, numerical evaluation of the economic and social impacts of culture is very important point.
In this study, the economic scale of culture was calculated based on the cultural GDP calculated in the “Research Project on Economic Scale and Economic Ripple Effect of Cultural Industries” conducted in FY2015.
The purpose of this survey is to clarify the relationship between culture and economy and to consider cultural measures to be taken in the future.
(2) Survey details
1) Examination from the economic aspect (cultural GDP) of the new cultural policy that the Agency for Cultural Affairs works on
Case studies were conducted in four fields: “movie”, “tea ceremony”, “Japanese sake” and “national treasure Matsue Castle”. Basically, we focused on literature surveys, and for tea ceremony and sake, we conducted a questionnaire survey (Internet survey) and an interview survey to grasp the actual state of cultural activities and consumption.
In conducting the survey, a study group consisting of experts in cultural theory, economic statistics, and cultural economics was organized, and approached from both cultural theory and economics, such as cultural framework, definition, and quantification.
Study group members (Title is as of 2017)
・Kiyoshi Fujikawa
Professor, Applied Social System Institute of Asia, Nagoya University: Economic Statistics
・Masatishi Takada
Professor Emeritus, Mukogawa Women's University: Cultural Theory
・Tadashi Yagi
Professor, Doshisha University Faculty of Economics: Cultural Economics 2) Research on new cultural GDP
Based on the calculation method of cultural GDP in other countries and recognition of the relationship between culture and economy, etc., we researched the appropriate calculation method of new and cultural GDP and examined the issues.
ii 3) Proposals for new cultural measures
In the relationship between culture and economy, we proposed the promotion of cultural satellite account (CSA) as one of the directions of new cultural measures that the Agency for Cultural Affairs should implement in the future.
Abbreviations
CSA Culture Satellite Account
FCS Framework for Cultural Statistics GDP Gross Domestic Product
SNA System of National Account TSA Tourism Satellite Account VA Value Added
iii
Table of contents
Introduction ... i
■Chapter 1 Towards a calculation of cultural GDP ... 1
1.1 Quantitative evaluation of economic and social effects of culture ... 1
1.1.1 Approaches to cultural GDP ... 1
1.1.2 Cultural GDP and the Culture Satellite Account (CSA) ... 2
1.1.3 Issues posed by this research ... 3
1.2 Framework of the Culture Satellite Account (CSA) ... 5
1.2.1 Overall summary ... 5
1.2.2. Summary of each stage ... 6
■Chapter 2 Case studies ... 10
2.1 Summary of case studies ... 10
2.1.1 Positioning of case studies ... 10
2.1.2 Aspects of four domains ... 10
2.2 Cultural GDP of movies ... 12
2.2.1 Stage 1 ... 12
2.2.2 Second stage ... 14
2.3 Cultural GDP of “tea ceremony” ... 17
2.3.1 Calculation procedure ... 17
2.4 Cultural GDP of Japanese sake ... 24
2.4.1 Calculation procedure ... 24
2.5 Cultural GDP by Matsue Castle National Treasure Designation Effect ... 29
2.5.1. Stage 1 ... 29
2.5.2 Stage 2 ... 30
■Chapter 3 Future issues of numerical evaluation ... 39
3.1 Technical issues to implementation of Culture Satellite Account (CSA) ... 39
3.1.1 Basic issues in Japan ... 39
3.1.2 Issues for targeting culture ... 40
3.2 Issues of using Culture Satellite Account (CSA) ... 43
3.2.1 Clarification of assumptions ... 43
3.2.2 Utilization and development in various fields ... 43
3.3 Towards implementation of CSA ... 45
3.3.1 Necessity of sufficient study and trial period ... 45
3.3.2 Strategic and trial realization programs ... 46
3.3.3 Cultural domains and types of feasibility studies ... 47
Index to figures and tables ... 49
1
■Chapter 1 Towards a calculation of cultural GDP
1.1 Quantitative evaluation of economic and social effects of culture
1.1.1 Approaches to cultural GDP
Gross domestic product (GDP) is one component of the System of National Accounts (SNA) and is a key economic indicator describing a systematic record of the production, consumption, investment, assets, liabilities, stocks, etc., of a country, and is used to denote the scale of its economy. GDP is the collective value added that is produced during a given period (generally, one year), and growth in GDP describes the economic growth rate.
There are three types of GDP: from the aspect of production, from the aspect of distribution (income), and from the aspect of expenditure. In macroeconomics, these three are equivalent (three-surface equivalence principle). From a production perspective, GDP is expressed by the following formula.
Domestic production - intermediate inputs = value added (GDP)
Applying this methodology for computing GDP to a cultural context allows us to arrive at cultural GDP.
1
1 The above does not take into account the value added of intermediate inputs from goods and services produced by movie production companies.
Column 1: Structure of cultural GDP
As an example of cultural goods and services, assuming that a Japanese film costs ¥2,000 at a movie theater, GDP is calculated as shown below (amounts are provisional). In this model, the cultural GDP of the movie studio is ¥1,500. Domestic production value is ¥4,500 and intermediate input is ¥3,000. If all the goods and services related to culture are be added up in this way, the cultural GDP can be calculated theoretically.
Table 1-1 GDP Model (Movie)
Movie production companies
Movie distribution
companies Movie theaters/cinemas Total
Total domestic production 1,000 1,500 2,000 4,500
Intermediate inputs¹ 500 1,000 1,500 3,000
Value added 500 500 500 1,500
(Source: Prepared by CDI ) (Unit: JPY)
Table 1-1 GDP Model (Movie)
Movie production companies
Movie distribution
companies Movie theaters/cinemas Total
Total domestic production 1,000 1,500 2,000 4,500
Intermediate inputs¹ 500 1,000 1,500 3,000
Value added 500 500 500 1,500
(Source: Prepared by CDI ) (Unit: JPY)
2
1.1.2 Cultural GDP and the Culture Satellite Account (CSA)
The System of National Accounts (SNA), which forms the basis for calculating GDP, is a framework used to systematically record economic activity in the industrial sector; as such, it does not incorporate an economic or systematic accounting of cultural activity in its scope. While cultural activity’s implications on the economy may not be immediately visible, they to some extent form a part of SNA. Applying SNA to the sphere of culture requires identifying cultural factors latent within the SNA framework and quantifying them, then reapplying these to SNA.
Given that this involves identifying aspects implicit in the SNA framework, SNA is likened to the globe, with the task of identifying these factors being likened to a satellite around the globe, which gives us the appellation SA (Satellite Account).2
Figure 1-1 Satellite Account concept image
The cultural version of the satellite account is the “Cultural Satellite Account (CSA)”. If cultural GDP is calculated according to the SNA framework, it can be compared with other industrial sectors and economic activities that are also calculated according to the SNA framework. This would allow for measuring the proportion, degree of contribution, and rate of growth of the cultural industries at the national level.
Furthermore, given that SNA is based on an international framework, it would also allow for international comparative analysis of cultural GDP. Given that GDP is also used for analysis of local and regional economies, this would also allow for further defining cultural activity and cultural industries in specific regions (such as in the context of degree of contribution to job creation, etc.).
For these reasons, CSA not only provides a functioning “database” of economic analysis and policymaking that accommodates economically-informed approaches of culture, but also offers useful policy metrics in the form of growth rate and scale (increase) of ratio. New insights have come to light about the social value of culture, and more effective and logical bases for policymaking and measures for the promotion of the culture are being sought.
2 The Satellite Account concept is also being applied to areas like tourism, the environment, non-profit areas like volunteer activities and NPOs, and welfare sectors like nursing and childcare.
Source: An Examination of Current Methodologies and Country Experiences, UNESCO Institute for Statistics, 2015
Source: An Examination of Current Methodologies and Country Experiences, UNESCO Institute for Statistics, 2015
3
1.1.3 Issues posed by this research
This research posed two specific issues.
1. Technical dimensions of quantifying culture from a social and economic vantage point
One current issue in terms of quantifying culture and the arts is creating a system for the calculation of cultural GDP through Culture Satellite Account (CSA). Calculating cultural GDP using CSA allows for creating a common framework for the quantification of culture alongside the economy and industry.
However, the scope of cultural activities subject to CSA is quite wide-ranging. Furthermore, there are many aspects of culture that cannot be quantified, such as the way in which the joy of unpaid creative expression acts as motivation for said activity, among other areas in which the commodities therefore cannot be interpreted as mere commodities or the object of consumption.
Taking this into account and seeking to perform a multi-polar inquiry into the technical dimensions of how to proceed with this project and what problems may be posed, we have restricted the scope of this research to a preliminary calculation of cultural GDP in four domains.
2. Making use of quantified outcomes on social and economic impact of culture and the arts
Quantifying the social and economic impact of culture or calculating cultural GDP is not a goal unto itself;
rather, the resulting figures would ultimately be used in social and economic contexts in order to promote the culture. This research performed a simulated calculation of cultural GDP in four domains and examined the significance of the results therein.
4 '
In addition to calculating the cultural GDP from the Cultural Satellite Account (CSA), there is a method of calculating the “Economic Ripple Effect of Culture” (hereinafter “Economic Ripple Effect”) as an attempt to quantify cultural arts economically.
The economic ripple effect occurs when a change occurs in the production value or price of a certain industry and the production value and price of other industries are successively influenced through transactions between industries. This effect can be calculated using an input-output table. Apply this to culture and it is called the
“economic ripple effect of culture”.
For example, the economic ripple effect of holding a “cultural festival” has the structure shown below
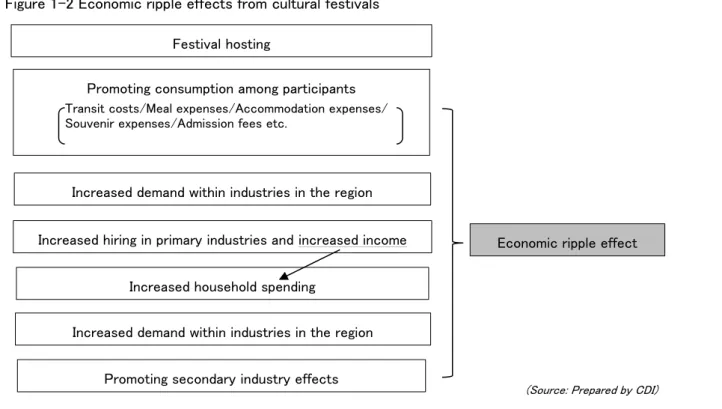
Figure 1-2 Economic ripple effects from cultural festivals
(Source: Prepared by CDI)
This example calculates where and how much consumption (production) is induced when a new investment expenditure (holding cost) is input to hold a cultural project, and the economic ripple effect is the total amount.
This economic ripple effect includes not only production-inducing effects but also new job creation effects. This is because new production induces new jobs.
Increasing investment by producers (businesses and governments) will increase national income, increase consumption, increase national income, further increase consumption, further increase national income, and further increase consumption. This chain effect on the economy is the economic ripple effect. This cycle of increase is a multiplier effect that is a multiplier (multiplication) increase in investment growth, and this multiplier theory is used to calculate the economic ripple effect. In contrast to the economic ripple effect of a culture that seeks a ripple effect (spread), cultural GDP differs in that it seeks the scale of industrial value produced within a certain period of time.
In addition to calculating the cultural GDP from the Cultural Satellite Account (CSA), there is a method of calculating the “Economic Ripple Effect of Culture” (hereinafter “Economic Ripple Effect”) as an attempt to quantify cultural arts economically.
Festival hosting
Promoting consumption among participants Transit costs/Meal expenses/Accommodation expenses/
Souvenir expenses/Admission fees etc.
Increased demand within industries in the region
Increased hiring in primary industries and increased income
Increased household spending
Increased demand within industries in the region
Promoting secondary industry effects
Economic ripple effect
Column 2: Economic ripple effects and cultural GDP
Column 2: Economic ripple effects and cultural GDP
5
1.2 Framework of the Culture Satellite Account (CSA)
1.2.1 Overall summary
The Cultural Satellite Account (CSA) framework largely consists of the following processes.
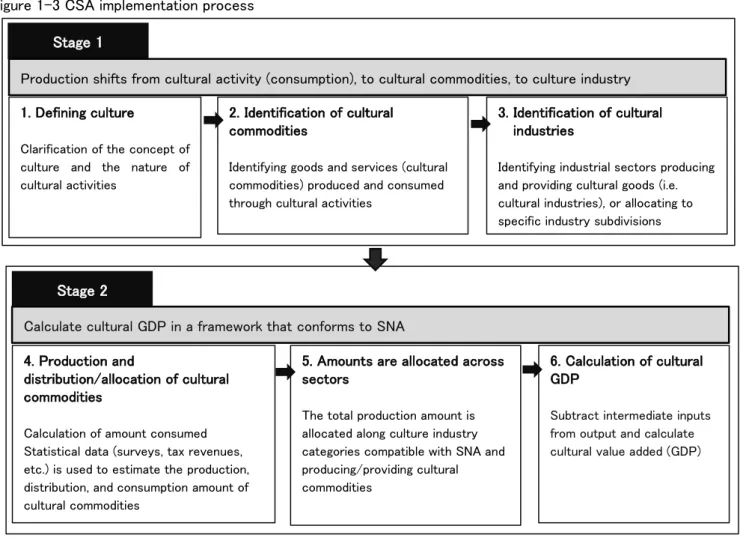
Starting from cultural activities (consumption), the activities (consumption) are converted into products, and the corresponding industrial sector is determined from the products to convert from consumption to production. In this way, the framework conforms to the National Accounts (SNA).3 This is a rough procedure for calculating cultural GDP.4
Figure 1-3 CSA implementation process
Source: Prepared by CDI
3In general, GDP is calculated on the production side. For the calculation, two tables are used: the SNA appendix of goods/services by economic activity (product output table by industry: V table) and the input of goods and services by economic activity (product input table by industry: table U). Specifically, the output is estimated based on the V table, and the GDP is calculated by subtracting the intermediate input in the U table. This is a method of estimating value added by industry (value added method) and is also used in the tourism satellite account (TSA). However, the SNA supplementary table is a rough industrial classification, and it does not correspond to specific cultural products. Therefore, when calculating the cultural GDP in this case study, an input-output table, which is an industry classification corresponding to fine cultural products, was used. For this reason, this report uses the phrase “compatible with SNA”. For movies and sake approached from the production side, the cultural GDP was calculated by excluding non-household consumption expenditure from the gross value-added sector of the relevant industry in the input-output table. For the tea ceremony and national treasure Matsue Castle approached from the consumer side, we calculated the cultural GDP of the entire industry (production side) using the inverse matrix coefficient.
4In general, GDP refers to domestic production value minus intermediate input. However, the gross value added used in this survey is the gross value added sector of domestic production values in the input-output table, excluding non-household consumption expenditure.
This is to correspond to GDP in SNA (National Accounts). SNA gross value added does not include non-family spending.
Stage 1
Stage 1 1. Defining culture
Clarification of the concept of culture and the nature of cultural activities
1. Defining culture
Clarification of the concept of culture and the nature of cultural activities
2. Identification of cultural commodities
Identifying goods and services (cultural commodities) produced and consumed through cultural activities
2. Identification of cultural commodities
Identifying goods and services (cultural commodities) produced and consumed through cultural activities
3. Identification of cultural industries
Identifying industrial sectors producing and providing cultural goods (i.e.
cultural industries), or allocating to specific industry subdivisions
3. Identification of cultural industries
Identifying industrial sectors producing and providing cultural goods (i.e.
cultural industries), or allocating to specific industry subdivisions Production shifts from cultural activity (consumption), to cultural commodities, to culture industry
Production shifts from cultural activity (consumption), to cultural commodities, to culture industry
Stage 2
Stage 2 4. Production and
distribution/allocation of cultural commodities
Calculation of amount consumed Statistical data (surveys, tax revenues, etc.) is used to estimate the production, distribution, and consumption amount of cultural commodities
4. Production and
distribution/allocation of cultural commodities
Calculation of amount consumed Statistical data (surveys, tax revenues, etc.) is used to estimate the production, distribution, and consumption amount of cultural commodities
5. Amounts are allocated across sectors
The total production amount is allocated along culture industry categories compatible with SNA and producing/providing cultural commodities
5. Amounts are allocated across sectors
The total production amount is allocated along culture industry categories compatible with SNA and producing/providing cultural commodities
6. Calculation of cultural GDP
Subtract intermediate inputs from output and calculate cultural value added (GDP)
6. Calculation of cultural GDP
Subtract intermediate inputs from output and calculate cultural value added (GDP) Calculate cultural GDP in a framework that conforms to SNA
Calculate cultural GDP in a framework that conforms to SNA
6
1.2.2. Summary of each stage
Defining culture
The first stage of Culture Satellite Account (CSA) begins by determining the scope and nature of the cultural activity to be accounted for. The calculated value varies depending on the range of culture. Therefore, creating a cultural framework and defining culture are important.
It is also important at what stage the culture is perceived. "UNESCO FCS 2009" states that there are the following five stages of circulation processes. And this report points out that the compilation of CSA needs to capture economic activities (monetary transactions) at the “consumption / participation” stage of the final stage of the process. This expresses the recognition that culture has a social cycle that begins with creation and ends with social enjoyment (consumption/participation).
This UNESCO definition is treated as an international standard in the CSA calculation currently underway in several countries. In this research study, including the scope of the culture in the next section, we are proceeding with examination in accordance with the standards presented by UNESCO.
Figure 1-4 Culture cycle (UNESCO FCS2009)
Source: UNESCO FC2009
CREATION
PRODUCTION
DISSEMINATIO
EXHIBITION/RECEPTION TRANSMISSION CONSUMPTION/
PARTICIPATION
7 Scope of culture
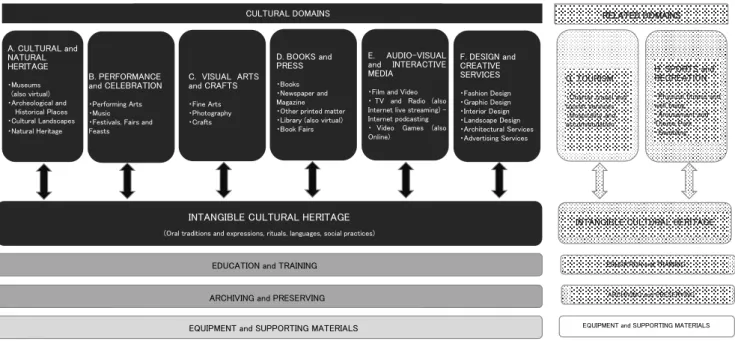
UNESCO has also further defined culture and proposed the following six cultural domains and three lateral domains as a framework (UNESCO FCS 2009). This is the underlying premise used in the form of CSA recommended by UNESCO.
Figure 1-5 Framework for cultural statistics domains (UNESCO FCS2009)
Source: UNESCO FC2009
Identification of cultural commodities
Cultural products are goods and services that are consumed within the scope and content of cultural activities defined so far. These are particular goods and services associated with cultural activities. For example, art activity is a type of cultural activity. Inherent cultural products for art activities include materials and tools such as paint, purchased artworks, art-related books, entrance fees for art exhibitions, and tuition fees for painting classes. As described above, in the area of each cultural activity, “cultural product identification” work is to identify specific products for the cultural activities in those areas.
Identification of culture industries
Industries producing and supplying cultural commodities particular to a given cultural domain are identified and treated as “culture industries.” Taking artistic activity as an example, specific products are linked to the industries that produce them, as follows:
Painter: Writing/Artist Industry (Japan Standard Industry Classification)
Paints and art tools: Other manufactured industrial products (writing and stationery) (37 categories) Brush or painting supplies manufacturing industry (excluding pencils) (Japanese standard industry classification)
Art works: Retail not classified elsewhere (art retail) (Japanese standard industry classification), Artist and Artist (Author / Artist) (Japanese Standard Industry Classification)
A. CULTURAL and NATURAL HERITAGE
・Museums (also virtual)
・Archeological and Historical Places
・Cultural Landscapes
・Natural Heritage
B. PERFORMANCE and CELEBRATION
・Performing Arts
・Music
・Festivals, Fairs and Feasts
C. VISUAL ARTS and CRAFTS
・Fine Arts
・Photography
・Crafts
D. BOOKS and PRESS
・Books
・Newspaper and Magazine
・Other printed matter
・Library (also virtual)
・Book Fairs
E. AUDIO-VISUAL and INTERACTIVE MEDIA
・Film and Video
・TV and Radio (also Internet live streaming) - Internet podcasting
・Video Games (also Online)
F. DESIGN and CREATIVE SERVICES
・Fashion Design
・Graphic Design
・Interior Design
・Landscape Design
・Architectural Services
・Advertising Services
G. TOURISM
・Charter travel and tourist services
・Hospitality and accommodation
H. SPORTS and RECREATION
・Physical fitness and well being
・Amusement and Theme Park
・Gambling RELATED DOMAINS
INTANGIBLE CULTURAL HERITAGE
EDUCATION and TRAINING
ARCHIVING and PRESERVING
EQUIPMENT and SUPPORTING MATERIALS
INTANGIBLE CULTURAL HERITAGE
(Oral traditions and expressions, rituals, languages, social practices)
EDUCATION and TRAINING
ARCHIVING and PRESERVING EQUIPMENT and SUPPORTING MATERIALS
CULTURAL DOMAINS
8
Art books: Information and communication (37 categories), or publishing (Japanese standard industry classification)
Exhibition fee for art exhibition: Education/Research (in case of public art museum/non-profit) (37 areas) Or museum / art museum (Japan Standard Industry Classification)
Painting class: Personal services (37 categories) or other liberal arts / skills teaching (Japanese standard industry classification.
Estimating production, distribution, and consumption of cultural commodities
The amount of production, distribution, and consumption of various goods and services must be estimated at a particular threshold or interval. In Japan, these amounts must be estimated from economic census, household finance surveys, or with reference to industry sales data.
Allocation to specific cultural industries
In accordance with the “1.2.2.4 Extraction of cultural industry” work, allocate to each industry sector and total the amount. By doing so, the production value of each production sector falls within a framework compatible with the National Accounts (SNA) in the process of “starting from the consumption of cultural products to the production sector of cultural products”.
However, as shown in the example of art in “1.2.2.4 Extraction of cultural industry”, the assigned industrial sector as a whole is often not a cultural product production sector. For example, there are cases where paints and art tools are allocated to a plurality of industrial sectors as part of “brush and painting supplies manufacturing industry (excluding pencils)” and “other manufacturing industrial products” in the industrial classification. In such a case, the ratio of cultural products in the sector is set as follows.
Column 3:
Accounting from a consumption and production basisColumn 3:
Accounting from a consumption and production basisAccording to the “three-sided equivalence principle”, the GDP in terms of production is equal to the GDP in terms of expenditure. Therefore, the result is the same whether the account is started from production or consumption (expenditure). If so, it can be considered that starting from production is more efficient in calculating cultural GDP. It also states: “The method of making an industry sector as a producer of cultural activities can lead to overestimation and underestimation of cultural production. Without a reasonable distribution index, all output from an industry sector is cultural. Finland and the UK are making this a future issue. Uruguay raises the risk of overestimation in the fields of communications and information technology as well as in the field of architecture and software." Overcalculation leads to overestimation, and one country's cultural GDP is overestimated.
In this way, capturing culture from consumption (demand) rather than production will lead to the following ideas in addition to problems from the technical side. “Culture is produced by people's cultural activities, not necessarily by the industrial sector.”
According to the “three-sided equivalence principle”, the GDP in terms of production is equal to the GDP in terms of expenditure. Therefore, the result is the same whether the account is started from production or consumption (expenditure). If so, it can be considered that starting from production is more efficient in calculating cultural GDP. It also states: “The method of making an industry sector as a producer of cultural activities can lead to overestimation and underestimation of cultural production. Without a reasonable distribution index, all output from an industry sector is cultural. Finland and the UK are making this a future issue. Uruguay raises the risk of overestimation in the fields of communications and information technology as well as in the field of architecture and software." Overcalculation leads to overestimation, and one country's cultural GDP is overestimated.
In this way, capturing culture from consumption (demand) rather than production will lead to the following ideas in addition to problems from the technical side. “Culture is produced by people's cultural activities, not necessarily by the industrial sector.”
9 Total sales of cultural commodities in the sector
Total sales of all products in the sector
Calculating cultural GDP
Based on SNA itself or a framework suitable for SNA such as an input-output table, intermediate value is subtracted from domestic production value to calculate value added (GDP). Japan's cultural GDP is the sum of the GDP of various cultural and industrial sectors that produce cultural products
Table 1-2 Calculation concept of cultural GDP
Cultural Cultural Cultural Cultural
Industry A Industry B Industry C ・・・・・・・ Industry Z CSA
Intermediate input (a)
x1A x1B x1C ・・・・・・・・ x1Z
x2A x2B x2C ・・・・・・・・ x2Z x3A x3B x3C ・・・・・・・・ x3Z
・ ・ ・ ・ .・ .・
xnA xnB xnC ・ .・ .・ ・ xnZ
Σj x1j Σj x2j
Σj x3j Total of cultural Intermediate input Σj xnj
VA(b-a) vA vB vC ・・・・・・・・・ vZ Σj vj (cultural GDP)
Domestic production (b) xA xB xC ・・・・・・・・・ xZ Σj xj (Domestic cultural Production value) Source: Compiled by CDI
=Proportion of cultural commodities produced
10
■Chapter 2 Case studies
2.1 Summary of case studies
2.1.1 Positioning of case studies
As already mentioned, and as seen in the definition of UNESCO, the areas and contents of cultural activities are broad and diverse, and it takes a lot of time and effort to give and organize a framework. It should also be taken into account that work on the Cultural Satellite Account (CSA) was recently started and is at a trial stage, and no method or technology has been established.
Based on this situation, this study selected four fields as the subject of the case study and tried to calculate cultural GDP for each field. Through case studies in four fields, it will be possible to grasp how technically the CSA calculation work should proceed in the future and the problems that will occur at that time.
2.1.2 Aspects of four domains
The case study covers four areas: movies, tea ceremony, Japanese sake, and Matsue Castle (designated as a national treasure). The characteristics of these four fields and the reasons for selection are as follows.5
Movies
“Movies” is positioned as an industry sector within the framework of the National Accounts (SNA). In addition, the “Specific Services Industry Survey (Ministry of Economy, Trade and Industry)” and statistical data from industry groups are in place. Using these existing data, the cultural GDP of the film industry can be calculated (satellite accounting) within a framework that is compatible with SNA. In addition, related fields such as movie production, DVD sales/rentals, and television broadcasts may be considered as the cultural industry sector. For this reason, the cultural sector and the industrial sector are smoothly connected, and the laborious division and separation of labor required for the satellite account is relatively easy.
Tea ceremony
Tea ceremony” is easy to define as culture because the whole activity is cultural activity. In addition, it is an area in which various other cultural and artistic fields such as flowers, calligraphy, pottery, kimono, gardening, etc. are involved. However, the connection with specific industrial sectors has not been analyzed. In addition, figures such as consumption and production are not available.
This situation is expected in several areas related to culture in the future. For this reason, the tea ceremony field
5 For the calculation, the input-output table used is the 2014 extended input-output table (2014 price) and the 2011 Shimane prefectural input-output table. In addition, the consumption and production value of sake and movies were based on the 2014 Industrial Statistics Survey and the Survey on Specific Service Industries. In addition, the movie rental sales are based on the 2012 economic census, the tea ceremony population is the 2016 basic survey on social life, and the Matsue Castle related statistics are based on the 2016/2017 tourism survey. For this reason, the cultural GDP of each field does not represent a certain year.
11
can be called a miniature version of a satellite account, and is an appropriate field for case studies.
In fields such as the tea ceremony, micro data (data on actual activities and actual consumption) is required to utilize existing macro data (such as SNA, input-output tables, and economic census).
Japanese sake
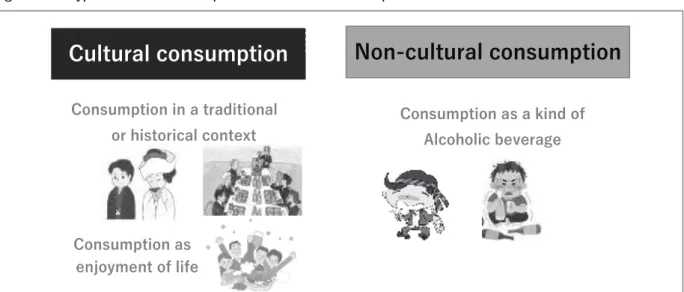
With regard to “Sake”, statistical data on sake itself is incorporated in the economic census and input-output tables, and is relatively well prepared. There are also data on consumption in household surveys. However, when looking at sake from the viewpoint of culture as well as from the amount of production and consumption, it is necessary to define it as a culture by approaching it from the viewpoint of how it is consumed and the awareness of its roles and symbolism.
For example, the same Japanese sake product (for example, the bottle of sake) can be simply consumed as an alcoholic beverage or used as an offering dedicated to a shrine.
In this way, sake is an area where the product itself is easy to grasp, but the issue is the understanding of its cultural characteristics. These issues of sake are similar to the issues of distinguishing general consumption from cultural consumption in the areas of lifestyle and culture (eg clothing, food and housing).
Matsue Castle (a designated national treasure)
This is an attempt to capture the economic effects of “Matsue Castle” designated as a national treasure as cultural GDP. Until now, economic ripple effects have been mainly estimated in relation to national treasure designation, world heritage registration, and Japanese heritage certification. On the other hand, this is a case where the newly induced production effect is seen as added value, and is regarded as cultural GDP.
The regional economic effects of cultural policies can be quantified by examining whether one of the cultural property protection policies designated as a national treasure has boosted regional GDP as its policy effect.
Furthermore, since the target is a cultural property called Matsue Castle, it will be positioned as a clue when trying to convert the existence value of the cultural property into economic value in the future, and will contribute to the study various issues.
12
2.2 Cultural GDP of movies
2.2.1 Stage 1
Defining the movie domain
There are two streams of “movie” as cultural activities: “production, distribution, screening, and appreciation”
(primary use) and “production, DVD production, sales/rentals, and appreciation” / “production, airing on TV, and appreciation” (secondary use). These are all “production, transaction, consumption” cycles. When this is applied to the UNESCO culture cycle, it appears as shown in the figure below.
Figure 2-1 Cultural cycle of the movie domain
Source: Prepared by CDI based on UIS
Identification of movie commodities
This circulation structure is represented by the transaction structure as shown in the figure below. The consumption/participation stage, except for voluntary screening, is mainly in three forms: “watching at a movie theater”, “purchasing/renting a DVD, etc.” and “viewing a TV broadcast”. These are the final consumption/
participation aspects of the movie category, and at the same time, the product unique to the movie domain (the movie itself).6
6 In recent years, Internet distribution such as on-demand distribution has been rapidly increasing in this field. The transaction structure of this research study does not include such factors. This is a future issue to consider.
CREATION
PRODUCTION
DISSEMINATIO
EXHIBITION/RECEPTION TRANSMISSION CONSUMPTION/
PARTICIPATION
Production of movie
Movie distribution and DVD production Movie Screening, broadcast, and rental
Watching movies
13 Figure 2-2 Structure of transactions in the movie industry
(Source: Prepared by CDI)
Identification of movie industries
Based on the transaction structure of the movie industry, movie products are made to correspond to the following industrial sectors related to production, distribution and services, and these are designated as the movie industry.
Figure 2-3 Structure of the movie industry
(Source: Prepared by CDI) Movie theater
firm income Income from
distribution of movies 100% (revenue (income from admission fees, etc.))
50% (distribution income) 50% (screening income)
Profits/production expenses
Distribution fees
Producer/
investors
Production firms
Distribution firms
Movie theater, etc.
Foreign movies (import)
Viewing
TV broadcasters,
etc.
DVD production
firms Sales firms Purchase
Airing
(viewing) Rental
Airing (viewing)
Primary use
Secondary use
Income from production of movies Movie production sector
Primary use
Secondary use
Movie Distribution sector
Movie theater /cinemas
Income from sales in shops
Broadcasting on television/other
media
Production/sale of DVDs, etc.
Rental of DVDs, etc.
Broadcasting sector Movie software production/sale
sector
Movie rental sector
14
2.2.2 Second stage
Calculating production/consumption amounts of movie commodities
The final consumption of movies is entrance fees at movie theaters, DVD purchase or rental fees, television rights for broadcasting, etc. Among these, the business model of primary use of movies (production of movies → distribution
→ entertainment) is unique. In the three stages of production/distribution/entertainment, the final box office revenue (sales) flows back to distribution and production, rather than the transaction structure of purchasing goods and servicess from the previous stage. Specifically, a movie production company does not sell a movie product to a distribution company, and a distribution company does not sell a movie product to an entertainment company (movie theater).
About 50% of the movie theater admission revenue (primary usage) is revenue (sales) by the box office companies such as movie theaters, and the remaining 50% is revenue (sales) by the distribution company and production company.
Therefore, the primary use of movies is linked to the sales of distributors and production companies in the amount consumed in movie theaters. Based on such a transaction structure, the sales of each industrial sector constituting the movie industry are calculated using various statistics of the country and industry.
●Primary use
1. Revenue in movie production and distribution sector
Annual sales of film and video production work in the “2014 Survey on Specific Services Industries”
corresponds to total sales. However, since the film production and distribution cannot be separated in this survey, total sales are combined. The sales amount is 1,947 million US dollars.
2. Theater box office income
According to a report by Japan Filmmakers Federation, 2014 box office income at movie theaters was 1,903 million US dollars. In the subsequent calculation of the added value, an input-output table is used. The total production value of “movie theater” in the input-output table is based on the figures published by the Japan Filmmakers Federation, but not from the “Specific Services Industry Survey”. Therefore, the former amount is used in this calculation.
3. Movie theater income from shops
This revenue amount is calculated by converting (rebating) it into the box office revenue amount based on the composition ratio of the annual sales amount of each operation of “Movie Theater” (“2014 Survey on Specific Services Industry”). As a result, the revenue from movie theaters etc. is 483 million US dollars.
4. Income from movie theater services (production amount)
This was calculated using the same methodology as in 3 above. Services were treated as advertising income (50%) and food services income (50%). The income (production) amount was 62 million US dollars.
5. Revenue from primary use
Totaling revenue from each primary use sector yields 52,017 million US dollars.
15
Table 2-1 Income/revenue from primary use of movies (gross production)
Category Revenue
1. Movie production/distribution 1,947
2. Theater box office income 1,903
3. Theater income from shops 483
4. Revenue from movie theater services 62
Total 4,395
(Source: Prepared by CDI) (Unit: million US dollar)
●Secondary use
1. Sales of movie software
Of the 2014 video software sales (Japan Video Software Association materials), Japanese, Western and Asian movies and animations were calculated. For animation, since the breakdown of theater and TV is unknown, the ratio of the number of theatrical movie titles and the number of TV animation titles was calculated from “Japan Animation Industry/Market Trends” by the Japan Animation Association. The total sales amount is 626 million US dollars.
2. Movie rental revenue
Calculated by apportioning movie content from the rental business of music and video recorded in “2012 Economic Census-Activity Survey”. Specifically, music and video content are calculated based on the ratio of the total sales of Oricon music software, excluding music video software, to the video software rental/cell market estimate, and movie and animation rentals. The amount was divided by the ratio of movies and animations to the total sales of video software. The total amount is 634 million US dollars.
Table 2-2 Revenue or sales of secondary use of movies (total production)
Category Revenue
1. Movie software revenue 626
2. Movie rental revenue 634
Total 1,261
(Source: Prepared by CDI) (Unit: million US dollar)
Based on the above, the total amount of sales for primary and secondary use is regarded as production value, and the total economic weight of movies is approximately 5,656 million US dollars. The breakdown is about 4,395 million US dollars for primary use from the production and distribution of movies to the performance in front of the camera, and about 1,261 million US dollars for secondary use of software sales and rentals. In addition, the broadcasting rights revenue for TV etc. in the secondary use is included in the sales amount of “1.
Movie production/distribution” for the primary use.
16 Allocation to industrial sector
As shown in the table below, the production value of each sector of the movie domain was allocated to the industrial sector of the basic classification (516 × 395 sector table) of the 2014 extended input-output table.
Table 2-3 Allocation of movies to the industry sector
Category of movies Industrial sector
Basic classification (see: 37 categories) Movie theaters Movie theaters/cinemas (Personal services)
Movie shops Retail (Commercial)
Movie theater services: advertising Advertising (Business services) Movie theater services: food Food services (Personal services)
Movie production/distribution Video/audio/text information production (Telecommunications) Movie software sales Video/audio/text information production (Telecommunications) Movie rentals Leasing of goods (excludes rental vehicles) (Business services) (Source: Prepared by CDI)
Calculating cultural GDP
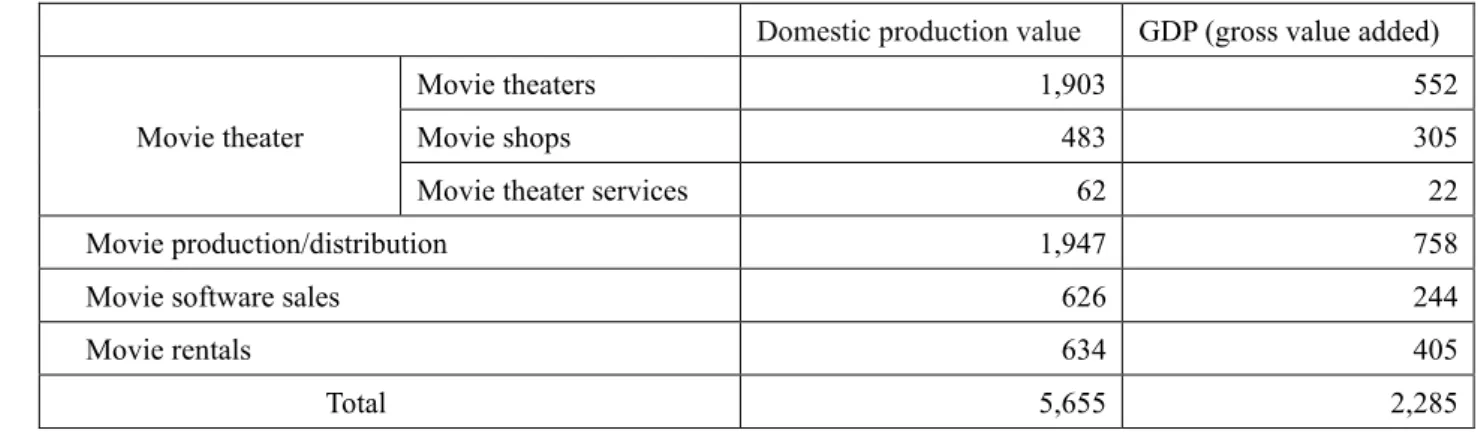
The cultural GDP was calculated using the input ratio of the industry to which each sector of the 2014 extended input-output table belongs. The results are as follows, and the cultural GDP of the movie is estimated to be about 2,298 million US dollars in total.
Table 2-4 Calculation of gross value added (GDP) for the movie industry
Domestic production value GDP (gross value added)
Movie theater
Movie theaters 1,903 552
Movie shops 483 305
Movie theater services 62 22
Movie production/distribution 1,947 758
Movie software sales 626 244
Movie rentals 634 405
Total 5,655 2,285
(Source: Prepared by CDI) (Unit: million US dollar)
17
2.3 Cultural GDP of “tea ceremony”
2.3.1 Calculation procedure
Definition of tea ceremony field
The tea ceremony ("Chado" or "Sado") was established in the 16th century by Sen-no-Rikyu. This example of traditional Japanese culture is still enjoyed by many Japanese people today. A full-fledged tea ceremony is associated with various cultural and art related items such as tools, tea rooms, tea gardens, hanging scrolls, etc., and it is said to be a “comprehensive” art. Even today, the tea ceremony is practiced and enjoyed. There are also various schools. There are two major activities related to the tea ceremony. One is to encounter tea ceremony culture by drinking tea. The second is to learn tea ceremony as a practice or culture. There are various forms and levels of encountering the tea ceremony, but eventually this takes the forms of teaching, learning, knowing about and experiencing the tea ceremony.
In this study, the actual drinking of tea was excluded because that is classified under “food and drink”, and the tea ceremony as the latter, the cultural activity, was targeted.
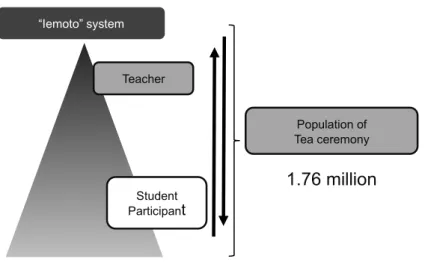
In the world of tea ceremony, there are schools and “iemoto” systems, which are the core of the cultural activities of tea ceremony. There are professors and leaders under the “iemoto” system in each school, and these people often have a qualification given by the school in some way. In some schools, such a system based on the relation between teacher and students is called “syachu”, a kind of association. With the exception of enjoying tea individually, most persons involved in tea ceremony participate in various activities as a member of the association or in the role they have been licensed to fill. Basically, the “iemoto” system has a pyramid structure, and the people who comprise it are the “tea ceremony population”. The figure below shows a model of this.
Figure 2-4 The structure of contemporary tea ceremony
Source: Made by CDI based on “Survey on Time Use and Leisure Activities 2016” (Ministry of Internal Affairs and Communications)
Extraction of tea ceremony products
We conducted interviews with people who attend tea ceremony at several levels, and determined about 90 items of goods and servicess required or consumed in actual activities. The products vary widely and include related areas such as membership fees, tuition fees, powdered tea, Japanese sweets, tea utensils, and Japanese clothing, etc.
“Iemoto” system
Teacher
Student Participant
Population of Tea ceremony
1.76 million
18 Identification of “the tea ceremony industry”
The next task is to identify the industrial sector that produces the determined tea ceremony products. The industrial sector was assigned to 98 integrated middle categories in the extended I-O table of 2015. For example, “membership fees”, “tuition fees, training fees”, etc. are allocated to “097 other personal services”, “tea bowls”, within the category of tea utensils, are allocated to “030 ceramics”, and “tea whisks” are allocated to “010 wooden wares”. “Transportation”
is 70% for “072 railroad”, 30% for “037 road passenger transport”, “expenses for utilities” is “065 water” 25%, “063 electricity” 50%, “064 gas” 25%. The apportionment was made mainly based on the consumption rate from the
“Family income and expenditure survey”.
Calculation of consumption and production value of tea ceremony products
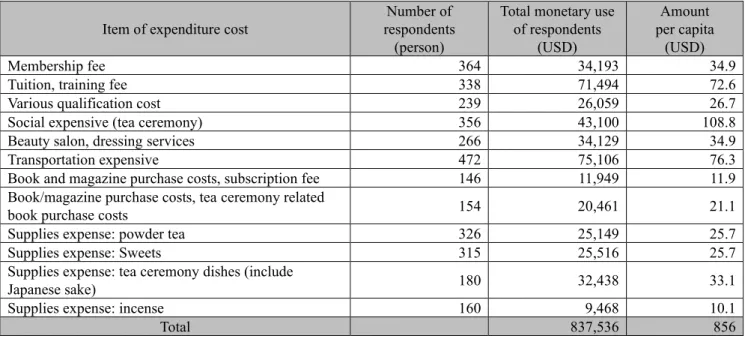
The sum of the consumption and production value of the extracted tea ceremony products corresponds to the consumption or production value of the tea ceremony products. But there is no such data. Therefore, a sample survey on consumption of tea ceremony products was conducted in a questionnaire. The questionnaire was conducted on the internet and was conducted for 979 men and women over the age of 20 who came in contact with the tea ceremony in some way over the past year. It asked about the annual consumption of the extracted tea ceremony products. For example, the survey results below show how values for each product, and sample values of annual consumption for each product, for people who come in contact with tea ceremony in some form, can be obtained.
Table 2-5 Example of annual consumption per person for tea ceremony products
Item of expenditure cost
Number of respondents
(person)
Total monetary use of respondents
(USD)
Amount per capita
(USD)
Membership fee 364 34,193 34.9
Tuition, training fee 338 71,494 72.6
Various qualification cost 239 26,059 26.7
Social expensive (tea ceremony) 356 43,100 108.8
Beauty salon, dressing services 266 34,129 34.9
Transportation expensive 472 75,106 76.3
Book and magazine purchase costs, subscription fee 146 11,949 11.9
Book/magazine purchase costs, tea ceremony related
book purchase costs 154 20,461 21.1
Supplies expense: powder tea 326 25,149 25.7
Supplies expense: Sweets 315 25,516 25.7
Supplies expense: tea ceremony dishes (include
Japanese sake) 180 32,438 33.1
Supplies expense: incense 160 9,468 10.1
Total 837,536 856
Source: compiled by CDI
The result of the questionnaire is the “annual consumption per capita” of people who come in contact with the tea ceremony in one form. The annual consumption per person is US $ 856. Since Total consumption is calculated by multiplying the consumption per person by the total number of people, to calculate the total domestic consumption amount, it is necessary to calculate the "tea ceremony population (the total number of people who come in contact with tea ceremony in some way)" in one year. The tea ceremony population was estimated as follows.
19 Estimation of tea ceremony population
The tea ceremony population can be calculated by multiplying the total population by the tea ceremony participation rate. The tea ceremony participation rate can be obtained from “Survey on time use and leisure activities 2016” (Ministry of Internal Affairs and Communications). In this survey, 1.55% of those surveyed (10 years or older) are in contact with the tea ceremony in some way for more than one day a year. Multiply 113.3 million (persons 10 years old and over) by 1.55% (tea ceremony participation rate) is 1,761,000 participants.
Estimation of the total consumption of tea ceremony
The table below shows the total consumption of tea ceremony products based on the annual consumption of tea ceremony products and the estimated population of tea ceremony (1,761,000 people). The total consumption of tea ceremony products is estimated at approximately US $ 1,507 million.
20 Table 2-6 Estimated consumption by tea ceremony population
Item of expenditure cost Average amount (USD)
Estimating the total amount based on the tea ceremony population
(million USD)
membership fee 34.9 61.5
tuition, training fee 72.6 128.6
various qualification cost 26.7 46.9
social expensive (tea ceremony) 44.1 77.5
beauty salon, dressing services 34.9 61.4
transportation expensive 76.3 135.1
book and magazine purchase costs, subscription fee 11.9 21.5
tea ceremony related book purchase costs 21.1 36.8
supplies expense: powder tea 25.7 45.2
supplies expense: sweets 25.7 45.9
supplies expense: tea ceremony dishes 33.1 58.3
supplies expense: incense 10.1 17.0
supplies expense: flower 17.5 30.7
supplies expense: kaishi 4.6 8.6
supplies expense: kuromoji (chopstics), etc. 3.7 6.4
supplies expense: charcoal 5.5 9.7
supplies expense: utility cost 11.0 19.9
supplies expense: tea towel, towel, rag 4.6 7.9
supplies expense: paper towel, tissue, etc. 3.7 6.1
supplies expense: detergents 3.7 6.9
Supplies expense: other consumables (cosmetics, etc.) 5.5 9.5
tea things: bowl 25.7 45.0
tea things: tea whisk 9.2 16.4
tea things: tea scoop 7.4 13.4
tea things: sifter 6.4 11.9
tea things: tea caddy 9.2 15.6
tea things: pouch for holding a tea caddy 6.4 11.5
tea things: tea container 11.9 21.8
tea things: small silk wrapper 5.5 9.3
tea things: small bag for kaishi 5.5 9.6
tea ceremony related: kettle 9.2 16.6
tea ceremony related: chain 1.8 3.8
tea ceremony related: teakettle 2.8 5.0
tea ceremony related: hearth 2.8 4.2
tea ceremony related: futaoki 0.9 2.2
tea ceremony related: tea ladle stand 1.8 3.4
tea ceremony related: yunoko 1.8 2.5
tea ceremony: waste water container 2.8 4.3
tea ceremony: hot water bowl 1.8 2.5
tea ceremony: water jug 3.7 6.6
tea ceremony: basket,etc 1.8 2.4
tea ceremony: gotoku 0.9 1.8
tea ceremony related: box for charcoal 1.8 2.7
tea ceremony related: hibashi(tongs) 0.9 2.2
tea ceremony related: basket for charcoal 0.9 1.9
tea ceremony related: feather 0.9 2.2
tea ceremony related: ash hoe 0.9 1.6
tea ceremony related: nagaita for hearth 1.8 3.8
tea ceremony related: incense container 1.8 3.6
tea ceremony related: shikiita, etc 0.9 2.1
tea ceremony related: chatu-bako 1.8 2.9
21
Item of expenditure cost Average amount (USD)
Estimating the total amount based on the tea ceremony population
(million USD)
tea ceremony related: flame of hearth 1.8 2.6
tea ceremony related: hanging scroll 10.1 17.7
tea ceremony related: folding screen 2.8 5.2
tea ceremony related: rug 1.8 2.5
tea ceremony related: wainscot paper 0.9 1.8
tea ceremony related: tatami 3.7 6.7
tea ceremony related: shelf, etc. 1.8 3.0
tea ceremony related: flower stand 2.8 4.1
tea ceremony related: flower-cutting scissors 0.9 2.4
tea ceremony related: yahazu 0.9 1.3
tea ceremony related: nail, etc. 0.9 1.3
tea ceremony related: fire shovel 0.9 1.3
tea ceremony related: ash for hearth 1.8 3.1
tea ceremony related: hiokoshi 0.9 1.7
tea ceremony related: cushion 1.8 2.6
tea ceremony related: table, chairs, etc. 0.9 1.7
tea ceremony related: Japanese sandals for garden 0.9 2.1
tea ceremony related: paper-flamed lamp for garden 0.9 1.6
tea ceremony related: broom, dustpan 0.9 1.2
tea ceremony related: gardening expense 3.7 6.0
tea ceremony related: tea room building 1.8 3.4
tea ceremony related: vacuum cleaner, refrigerator 1.8 3.8
tea ceremony related: toilet paper 0.9 2.0
tableware, miscellaneous goods: dish, plate, etc. 7.4 12.2
tableware, miscellaneous goods: bowl for rice and soup 7.4 12.5
tableware, miscellaneous goods: rice container 3.7 7.0
tableware, miscellaneous goods: glass 2.8 5.1
tableware, miscellaneous goods: tray 2.8 5.6
tableware, miscellaneous goods: chopsticks 1.8 4.0
tableware, miscellaneous goods: yunoko 2.8 4.4
tableware, miscellaneous goods: basket for food 2.8 5.4
tableware, miscellaneous goods: tobacco tray, etc. 2.8 4.3
tableware, miscellaneous goods: kettle for sake 3.7 6.3
tableware, miscellaneous goods: bucket for tea towel 1.8 3.2
kimono: kimono, etc. 105.7 186.6
kimono: obi(belt) 32.2 56.8
kimono: small articles for kimono 12.9 22.0
kimono: Japanese sandals 10.1 17.7
Total 855.8 1506.4
Source: compiled by CDI
Allocation to industrial sector
At the time of specific work on the tea ceremony industry, work had already been done to link tea ceremony products and industry. The amount of production for each industry was calculated by applying the amount of consumption for each product calculated in “Estimation of consumption by tea ceremony population” to this allocation table. The masked cells represent the allocation destination.
22
Table 2-7 Allocation table of tea ceremony activity consumption to production areas
I-O table 98 sectors
Note: The masked cells represent the allocation destination Source: compiled by CDI
Estimation of cultural GDP of tea ceremony
The production value was calculated by multiplying the consumption related to the tea ceremony allocated to each industry by the inverse matrix coefficient (open type) of the 2015 extended I-O table, and each value was calculated by multiplying this by the VA ratio. The sum of the VA calculated here is regarded as the tea ceremony culture VA.
The estimation results are as follows.
・tea ceremony consumption US $1,507 million
・tea ceremony related production value US $2,155 million
・tea related VA US $1,120 million
平成26年延長産業連関表
統合中分類98部門
農林業
食料品
・たばこ 飲料 繊維工業 製品
衣服・そ の他の繊 維既製品
木材・木 製品
家具・装 備品
パルプ ・ 紙・板紙・
加工紙 紙加工品
化学最終 製品(医 薬品を 除 く。)
陶磁器 鋳鍛造品 非鉄金属 加工製品
その他の 金属製品
民生用電 気機器
その他の 製造工業 製品
電力 ガス・熱供 給 水道 鉄道輸送
道路輸送
(自家輸 送を 除 く。)
映像・音 声・文字 情報制作
宿泊・飲 食サービ ス
洗濯・理 容・美容・
浴場業 その他の
対個人 サービ ス
会費授業料、稽古費 各種資格取得費用 交際費(茶会など ) 美容院、着付けサービ スなど 交通費 [鉄道0.7 バス・タクシー0.3]
書籍・雑誌購入費 - 定期購読費 書籍・雑誌購入費 - 茶道関連書籍購入費 消耗品費 - 抹茶(薄茶・濃茶)
消耗品費 - 菓子
消耗品費 - 懐石食材費(酒を 含む)[食材0.8酒0.2]
消耗品費 - 香 消耗品費 - 花 消耗品費 - 懐紙 消耗品費 - 黒文字など 消耗品費 - 炭
消耗品費 - 水光熱費 [水道0.25 電気0.5 ガス0.25 ] 消耗品費 - 茶巾、タオル、雑巾類 消耗品費 - ペーパータオル、ティシュ等 消耗品費 - 洗剤類 消耗品費 - その他消耗品(化粧品など ) 茶道具 - 茶碗
茶道具 - 茶筅 茶道具 - 茶杓 茶道具 - 抹茶篩 茶道具 - 棗 茶道具 - 仕覆 茶道具 - 茶入 茶道具 - 帛紗 茶道具 - 懐紙袋・数寄屋袋 茶席関係 - 釜 茶席関係 - 鎖 茶席関係 - 薬かん 茶席関係 - 炉・風炉 茶席関係 - 蓋置 茶席関係 - 杓立 茶席関係 - 湯の子 茶席関係 - 建水 [銅0.1 陶磁器0.9]
茶席関係 - 湯桶 席関係 - 水指 茶席関係 - 籠類 茶席関係 - 五徳
茶席関係 - 炭斗セット [火箸0.35、炭とり0.30、羽根0.35]
茶席関係 - 火箸 茶席関係 - 炭とり 茶席関係 - 羽 茶席関係 - 灰さじ、底取 茶席関係 - 炉用長板 茶席関係 - 香合 茶席関係 - 敷板類 茶席関係 - 茶通箱 茶席関係 - 炉縁 茶席関係 - 軸 茶席関係 - 屏風 茶席関係 - 毛氈 茶席関係 - 腰貼り紙 茶席関係 - 畳・畳張替え 茶席関係 - 棚類 茶席関係 - 花台 茶席関係 - 花切狭 茶席関係 - 矢筈 茶席関係 - 釘など 茶席関係 - 十能 茶席関係 - 炉灰 茶席関係 - 火おこし 茶席関係 - 座布団 茶席関係 - 卓、椅子など 茶席関係 - 露地草履 茶席関係 - 露地行灯 茶席関係 - ほうき、ち りとり、塵箸 茶席関係 - 作庭・庭手入れ費用 茶席関係 - 茶席整備・補修 茶席関係 - 掃除機、冷蔵庫等電気製品 茶席関係 - トイ レットペーパー 食器・雑器類 - 皿、向付 食器・雑器類 - 飯碗、汁椀(漆塗)
食器・雑器類 - 飯器 食器・雑器類 - 盃 食器・雑器類 - 盆 食器・雑器類 - 箸 食器・雑器類 - 湯の子 食器・雑器類 - 食籠 食器・雑器類 - 煙草盆、煙草入、灰吹 食器・雑器類 - 燗鍋 食器・雑器類 - 茶巾盥、バケツ 和装類 - 着物類 和装類 - 帯 和装類 - 和装小物類 和装類 - 草履
89 tea ceremony commodities
23 Table 2-8 Estimation of VA of tea ceremony (major items only)
Consumption of tea ceremony
Tea ceremony related domestic demand
Tea ceremony
related products VA
001 agriculture, forestry 30.7 13.7 39.4 18.4
006 food, tobacco 92.6 45.0 74.9 23.2
007 beverage 56.9 32.0 39.7 19.6
009 wearing apparel and other 326.1 38.2 39.9 13.8
010 lumber and wooden products 77.8 22.9 30.8 10.6
011 wooden products 16.7 8.6 18.8 6.4
012 pulp, paper, etc. 1.8 0.6 18.2 3.6
022 final chemical products 16.4 5.8 17.1 4.3
030 ceramic wares 86.2 28.7 29.2 12.0
034 casting and forging products 47.3 34.9 35.9 12.8
039 miscellaneous metal products 11.9 6.0 18.0 7.6
057 other manufactured goods 135.0 74.3 80.3 26.9
063 electricity 9.9 9.9 60.0 9.5
064 gas 5.0 5.0 15.3 3.7
065 city water 5.0 5.0 14.2 6.2
067 commerce 0.0 404.9 484.8 317.6
068 financial services and insurance 0.0 0.0 37.7 24.1
069 real estate and rent 0.0 0.0 37.9 23.9
072 railroad 94.6 94.2 100.5 66.2
073 road transport 40.5 57.2 76.3 52.7
082 information services 0.0 0.0 18.9 11.2
084 video / audio / text work 58.3 30.3 44.0 16.6
090 renting and leasing services 0.0 0.0 21.2 13.8
091 advertising 0.0 0.0 18.9 5.3
092 motor vehicle repairs 0.0 0.0 21.8 8.3
093 other business services 0.0 0.0 69.8 50.3
094 hotel and drinking eating place 77.5 77.5 78.6 33.7
094 laundry, barber and beauty shop 61.4 61.4 63.7 40.8
097 other personal services 246.3 246.3 249.9 171.3
total 1506.4 1307.4 2155.9 1120.5
Source: compiled by CDI
Note1: Tea ceremony-related consumption was allocated to each industry. Multiply this by the commercial margin and freight rates to convert to producer prices. Next, the domestic demand was calculated by multiplying the self-sufficiency rate. In addition, the production value was calculated by multiplying this result by the inverse matrix coefficient (open type) of the 2014 extended input- output table.
Note2: Multiply the VA rate to calculate added value.
(Unit :1000USD)