2018 Cultural Administration Research Survey
A Quantitative Evaluation:
The Economic and Social Effects of Culture (2)
March 2019
Communication Design Institute
Published in 2019
Agency for Cultural Affairs, Japan
Headquarters for Vitalizing Regional Cultures 43-3 Bishamoncho, Higashiyama-ku, Kyoto 605-8505, Japan
Tel; +81-75-330-6720 Fax; +81-75-561-3512
Email; [email protected] https://www.bunka.go.jp/
©2019 Agency for Cultural Affairs-Japan
Research: Communication Design Institute
83 Tomoecho, Karasuma-dori Muromachi Higashiiru, Nakagyo-ku, Kyoto
604-0863, Japan
i
Foreword
For nearly 70 years, the SNA (System of National Accounts) has been led by the United Nations Statistics Bureau, worldwide, and countries around the world have been measuring GDP etc. based on it. In other words, countries around the world use national accounts as a basic framework for quantitatively testing the effectiveness of various economic policies.
The basic framework of SNA is an input-output table. The Input-Output Table is a framework created by Russian researcher Dr Leonchev in the United States during the 1930s and 1940s. The major industries at that time were, unlike now, agriculture and mining, and their relative proportions were high. However, as long as countries around the world have agreed on this framework and have adhered to it, even if the subsequent economic structure changes and the size of the industry increases, it will respond to new growth industries that have not been incorporated into the original framework. Therefore, if the framework of SNA is changed, it will not be consistent with past data between countries around the world or their own countries. In order to avoid this, there is a history of adhering without changing the existing framework. In other words, they have tolerated the reality that new industries are hiding somewhere in the existing economic framework. In order to investigate and measure where these new industries are hiding, the image and concept of an object in the periphery, the flying satellite(s) orbiting the earth (SNA framework), has emerged. This
"satellite account" concept is enabling more precise measurement.
The first and most successful satellite account has been the Tourism Satellite Account (TSA). In the 1990s, the Canadian Statistical Office led its draft, and in around 10 years various test measurements were published worldwide in Spain and the United States, leading to the measurement of tourism economic activity in around 70 countries, including Japan.
The Culture Satellite Account (abbreviated CSA) is a global standard measurement method for quantitatively measuring cultural economic activity led by the United Nations Statistics Office and the UNESCO Institute for Statistics. As of 2019, the CSA Technical Advisory Group is leading the discussion on CSA and is in the final stages of preparing drafts.
The idea that cultural activities should be measured as economic activities existed earlier than in the tourism field. This can be confirmed by searching for past related papers. On the other hand, the idea that culture was difficult to measure with economic value and method persisted, and CSA's efforts did not make significant headway. Therefore, the TSA advanced by the UNWTO (United Nations World Tourism Organization) led the way. At this same time, however, the need to develop a method for quantitatively measuring the economic activity of culture increased in countries around the world. The reason is that "subsidies to encourage other industrial sectors are determined by the economic evidence of return on investment". Therefore, the United Nations Statistics Bureau has taken measures to address this need.
Japan led the Agency for Cultural Affairs, and independently conducted trial measurements of cultural economic activities, but unfortunately, these results were only available in Japanese, and not made available in other languages.
Because of this, they remained unknown outside this world.
On the other hand, at UNESCO, due to financial constraints, could not fund the first meeting of global CSA experts. This situation was communicated to the Japanese government, and thanks to the efforts of a member of the House of Representatives, Kozo Yamamoto, and with great cooperation from the private sector (Tokyu Corporation, Apamanshop Holdings Co., Ltd., Gourmet Navigator Incorporated, Cultural Tourism Research, Japan Tourism Association for Shrines and Temples), the Agency for Cultural Affairs, The UNESCO CSA Technical Advisory Group meeting was held in Kamakura and Tokyo, co-hosted by the Japan Tourism Agency, the Ministry of Foreign Affairs,
ii
and the Ministry of Economy, Trade and Industry, where the Agency for Cultural Affairs was able to directly announce a proposal for measuring the economic activity of culture to the advisors in English. Prior to this, Asian nations had no international presence in the field of cultural statistics, but Japan quickly became a focus of advanced nations. Here, the Agency for Cultural Affairs presented the world with a measurement proposal that adopted not only European cultural standards but also Asian and Japanese perspectives, and generated a great response. This also had national strategic significance in that the intentions of the Agency for Cultural Affairs were in line with those of the international community. (http://uis.unesco.org/en/news/meeting-technical-advisory-group-culture-satellite-accounts)
The following strategic issues result from looking at the domestic situation in Japan, which has succeeded in attracting 31 million inbound customers annually and is now in its second stage as a tourism nation.
(1) How can we best encourage long-distance visitors other than those from neighboring Asian countries to travel to regions in Japan other than large cities?
(2) How can we ease the burden of Japan’s high cost of living for tourists from overseas, encourage them to spend their tourism yen in rural areas, and to return to Japan?
(3) The key question is: how can we increase the inbound annual consumption of about 4.5 trillion yen, as of 2018, to 15 trillion and 20 trillion while seeing that spending is dispersed as widely as possible outside urban centers.
To promote regional revitalization through Japan’s second stage development as a tourism nation, it is necessary to link a nation-wide cultural policy aimed at “acquiring foreign currency through cultural and tourism consumption”
to local revitalization. A policy is needed to gain acceptance for and export the economic effects of tourism thereby lessening the effects of the aging population and changing the direction of the declining birthrate.
To put it another way, in the second stage of being a tourism nation, we need to more effectively promote the cultural aspects of our nation and communicate the potential tourism resources of each region to the world in English.
Many regional resources are historical and cultural heritage sites that do not require new capital investments. These include historical, and archeological sites as well as shrines. This will require the development of a cultural framework and joint work with tourism to raise foreign currency.
In order to evaluate such policy effects, quantitative measurement of investment effects and economic activity is essential as evidence-based policy evaluation.
It is important to the promotion of Japan as a world leader in culture and tourism in the 21st century, that the Agency for Cultural Affairs promote this CSA work.
Tadayuki Hara, PhD
Associate Dean, Associate Professor and Senior Research Fellow of University of Central Florida, Rosen College of Hospitality Management,
Member of UIS Culture Satellite Account Technical Advisory Group (CSA TAG) Advisor of Cultural Policy Research, Agency for Cultural Affairs, Japan
iii
Abbreviations
CPC Central Product Classification CSA Culture Satellite Account
FCS Framework for Cultural Statistics GDP Gross Domestic Product
ISIC International Standard Industrial Classification SNA System of National Account
TSA Tourism Satellite Account VA Value Added
Note 1: Those without source in figures and tables are CDI created.
Note 2: The figures in the table are rounded off, so the breakdowns and totals may differ.
iv
Table of contents
Framework of this research ... 1
Chapter1 Cultural GDP and Cultural Satellite Account ... 3
1.1 What is the Cultural GDP ... 3
1.2 The Cultural Satellite Account... 4
1.2.1 Concept of the Cultural Satellite Account ... 4
1.2.2 Guidelines of the Cultural Satellite Account ... 4
1.2.3 UNESCO model and specific developments in this survey ... 8
1.2.4 Definition and scope of culture ... 9
1.2.5 Scope of cultural products... 9
1.2.6 Identification of cultural industries ... 11
1.2.7 Technical work ... 11
Chapter2 Japanese Cultural GDP ... 12
2.1 Scope of estimation ... 12
2.2 Results ... 13
2.3 Cultural GDP by Domain ... 14
2.3.1 Museum ... 14
2.3.2 Performance and celebration ... 15
2.3.3 Visual Arts and Crafts ... 16
2.3.4 Books and Press ... 17
2.3.5 Audiovisual and Interactive Media ... 18
2.3.6 Design and Creative Services... 19
Chapter3 Approaches to amateur cultural activities ... 20
3.1 Positioning and development of amateur cultural activities ... 20
3.1.1 Position in the UNESCO model ... 20
3.1.2 Estimation method ... 20
3.2 Hobby and creative amateur cultural activities and cultural GDP ... 21
3.2.1 Amateur activities of performing arts and music ... 21
3.2.2 Amateur activities of art and craft ... 23
Chapter4 Issues to address, and proposals for estimating cultural GDP ... 24
4.1 Significance of cultural GDP estimation ... 24
4.2 Issues of concern when estimating cultural GDP ... 25
4.2.1 Issues related to cultural concepts ... 25
4.2.2 Participation in international discussions ... 25
4.2.3 Furthering cultural theory ... 25
4.2.4 Enhancement of overall cultural statistics ... 26
4.3 Response to national GDP statistical improvements ... 27
4.3.1 Enhancing statistics that connect culture and the economy... 27
4.3.2 Cooperation with economic statistics improvement ... 27
4.4 What must happen before CSA Application (Cultural GDP) can occur? ... 29
4.4.1 Further expand the range of economic measurement of culture ... 29
4.4.2 Localization ... 29
Appendix ... 31
A.1 Production ripple effect of "movies" ... 31
A.1.1 Production value of movies ... 31
A.1.2 Estimating production-induced effects ... 31
A.1.3 Production-induced structure of movie ... 32
v
A.2 Production ripple effect of "newspapers" ... 33
A.2.1 Production value of newspapers ... 33
A.2.2 Production ripple effect of "newspapers" ... 33
A.1.3 Production-induced structure of newspapers ... 34
Index to figures and tables ... 35
1
Framework of this research
This report is the result of the "2018 Cultural Administration Research Survey---A Quantitative Evaluation: The Economic and Social Effects of Culture (2)". The research period is from August 6, 2018 to March 22, 2019, and the framework is as follows.
1. Purpose of the survey
i) To develop methods for quantitatively evaluating the economic and social impact of culture and cultural industries to enable evidence-based planning of national cultural policies. To achieve this, the existing statistical information should be organized, and deficiencies in statistical information should be examined and investigated.
ii) Clarify the economic impact of culture from various industries on life in general. In addition, quantitative evaluation of the economic and social impacts of culture (including international comparisons) will be conducted to consider measures to be taken in the future. In addition, clarification of information deficits in statistical information on cultural relations in Japan, and examination of methods and frameworks that are highly feasible for quantification will be conducted.
2. Survey specifics
i) Estimation of the economic and social impact of new cultural measures by the Agency for Cultural Affairs (Culture satellite account)
Note 1: Estimations employed cultural areas based on the UNESCO model: (A. culture/natural heritage, B. performance/celebration, C. visual arts/crafts, D. books/press, E. audiovisual/interactive media, F. Design/creative services).
Note 2: The specifically estimated domains are:
Domain A. culture/natural heritage: i) museum (includes virtual ones) Domain B. performance/celebration: i) Performing arts ii) music
Domain C. visual arts/crafts: i) some aspects of fine arts ii) photography iii) crafts
Domain D. books/press: i) books ii) newspapers, magazines iii) other printed matter iv) libraries (includes virtual ones)
Domain E. audiovisual/interactive media: i) film/video ii) TV and radio iii) internet podcasting iv) video games
Domain F. design/creative services: i) fashion design ii) graphic design iii) interior design iv) landscape design v) architectural services
vi) advertising services ii) Research on new cultural GDP
Research the improvement of GDP statistics in Japan and study how it is reflected in the new and cultural GDP estimation.
2 iii) Suggestions for new cultural measures
Proposals on the direction of new cultural measures to be addressed by the Agency for Cultural Affairs, focusing on economic and social impacts.
iv) Participation in the UNESCO Cultural Satellite Account Technical Advisory Group and the Trans-Pacific Association of Input-Output Analysis Conference (international conference)
Participated in international conferences on cultural satellite accounts and international conferences of academic associations on input-output tables, reported on the current status of cultural satellite accounts in Japan, participated in discussions, etc., and grasped the progress of international efforts.
In carrying out the survey, a study group was set up by the following experts to promote the survey.
< Study group members*>
Takanobu Nakajima
(Professor, Faculty of Commerce, Keio University: Applied Economics) Tadayuki Hara
(Associate Dean, Associate Professor and Senior Research Fellow of University of Central Florida, Rosen College of Hospitality Management, Member of UIS Culture Satellite Account Technical Advisory Group (CSA TAG), Advisor of Cultural Policy Research, Agency for Cultural Affairs, Japan)
Kiyoshi Fujikawa
(Professor, Nagoya University Organization for Asian Creative Education: Economic Statistics) Tadashi Yagi
(Professor, Faculty of Economics, Doshisha University: Cultural Economics)
*(Occupational titles are as of 2018)
3
Chapter 1
Cultural GDP and Cultural Satellite Account
1.1 What is the Cultural GDP
GDP (Gross Domestic Product) is "the total amount of added value produced in a country within a certain period of time". It is a central indicator of the SNA (System of National Accounts), which is a comprehensive statistical measure of the economy, and is used as an indicator of the economic scale of a country (or one region).
The calculation method of GDP complies with the accounting standards of the national economy set by the United Nations, and has the characteristic of making it possible to use a common measure to evaluate the economic scale of each country.1
Although this occurred around 50 years ago, in 1971, a major newspaper company published a book called "Kick out GNP-The Inside Facts of High Economic Growth" and it became a topic of discussion (at that time nationality was more important than national borders, and GNP (Gross National Product) was in common use). The content is an opposition to measuring a country's economic power with the economic indicator of value added. However, although the first practical version of SNA was published in 1968, the concept has been revised since then. The basic concept of GDP was not “kicked out” for 50 years because of the convenience of being able to evaluate the economic size of each country with a common measure.
There are two types of GDP: nominal GDP, in which value added is represented by the nominal value of each year, and real GDP, in which value added is estimated by fixing the price evaluation point to remove the effects of price fluctuations. Economic growth rate is the growth rate of real GDP. In addition, although GDP is the sum of added value, in principle only the added value related to the production of goods and services traded in the official market is recorded.2
By the way, “added value” is the value created by subtracting the costs of raw materials and fuels required for production from the total production value, and newly created by production activities. Cultural GDP is the added value created by cultural activities. The value created as a result of cultural activities is diverse, including non-monetary and non-market types. However, the only economic added value that is captured in the framework of GDP is cultural GDP. More specifically, cultural GDP is an amount included within the existing GDP framework. This is equivalent to the “function-oriented satellite account” described later. Therefore, it must be noted that cultural GDP does not seek to add new value to cultural activities and cultural creative activities.
1 TheSNA has several versions. The prototype was launched in 1953, the substantial first version in 1968, the revised version in 1993, and the revised version in 2008. Regarding the evaluation of value added, the evaluation method has been modified to match the real economy.
2 Activities that are not traded in the market, with some exceptions, are not included in GDP. For this reason, domestic work and volunteer activities that are not part of the work of registered as non-profit organizations are not included in GDP. The exceptions are farmer's self- consumption (which assumes that they took produce to market and bought it back again) and the rent of an owner's house (the resident who pays rent to a landlord who is him/herself, the tenant). Markets are official markets, and value added in illegal markets such as those of drugs and gambling are not included in GDP. Only production activities create added value. For example, if there is a gain in land transactions, only the real estate brokerage fee is recorded in GDP. In connection with this, the increase in value due to the rise in land prices is not included in added value, and the asset value is recorded as an increase. The same is true for the trading of antiques, paintings, or stock or gold financial assets.
4
1.2 The Cultural Satellite Account
1.2.1 Concept of the Cultural Satellite Account
The SNA system is based on existing industry classifications. The industry classification is based on the criteria of producing similar products (by similar production methods). On the other hand, in cultural activities, the industries that produce them are not necessarily classified as a single field. Rather, in many cases they overlap across multiple industries or are part of an industry. Therefore, in order to estimate cultural GDP, it is necessary to extract the added value (cultural GDP) of cultural activities that are part of GDP in various industrial sectors and recount them. As an example, consider the production and consumption of sake as Japanese culture. In this case, in addition to the added value of sake production a part of the added value of the ceremonial occasion and restaurant business is also added to the “Sake culture GDP”.
A system for estimating such cultural GDP is the Cultural Satellite Accounts (CSA). CSA is a system reconfigured by rearranging the existing SNA.
1.2.2 Guidelines of the Cultural Satellite Account
The purpose of cultural GDP estimation is to grasp the size and growth rate of the cultural industry in one's country, compare it with other domestic industries and make international comparisons. In order for cultural GDP to be internationally comparable, it must be estimated in the same way as existing GDP calculations based on international standards. In this regard, in 2009 UNESCO (UNESCO, the United Nations Educational, Scientific and Cultural Organization) published the 2009 UNESCO Framework for Cultural Statistics (2009FCS), which was used as a guideline for CSA, a system for estimating cultural GDP. Since then, CSA has been created in countries such as Canada, Australia, and South America, and cultural GDP has been estimated.
The estimation of cultural GDP in this study is based on this system (the so-called “UNESCO model”3), which is recommended by UNESCO and has become a global trend.
3 The area of culture is set as the area of UNESCO's 2009 FCS, and the fields that make up each area are based on the 2017 CSA.
5
Figure 1-1 UNESCO Guidelines and Cultural Satellite Account Reports of Canada and South America
2009 UNESCO Framework for Cultural Statistics
Canadian Cultural Satellite Account, 2010 Guía Metodológica para la Implementación de las Cuentas Satélite de Cultura en Iberoamérica
6 There are two types of satellite account:
Type 1: Function oriented satellite accounts
According to 93SNA, this type "includes the rearrangement of the central classification and the introduction of supplementary elements different from the central concept system without largely deviating from the concepts underlying the core system (of SNA)". And this type is suitable for satellite accounts in fields such as culture, education, health and medical care, social protection, travel, environmental protection, research and development (R & D), development assistance, transportation, data processing, housing, and communications.
Type 2: Extension oriented satellite accounts
As stated in 93SNA: This type is obviously more problematic than a function-oriented satellite account, but it is important. It goes beyond what is included in the central system of SNA and therefore provides an opportunity to expand national economic operations. In addition, it tests new concepts and methodologies with much more freedom than the current national accounts work. The research work has the potential to influence the development of the system of central national accounting itself.
One example, an environmental account (not "environmental protection"), has the following characteristics: This account introduces different production boundaries or the concept of expanded consumption and capital formation, or extends the range of assets. This changes the boundaries between economic and natural phenomena that the central system deals with. As a result, the link between income and wealth is placed in the context of the broader concept of wealth, including natural assets.
As described above, the “function oriented satellite account” is re-edited in the SNA system, and the estimated value is the “inner number” of GDP. On the other hand, the “expansion oriented satellite account” is estimated with reference to the SNA system, but since it is originally intended for those not included in the SNA system, the estimated number is the “outer number”.
The Cultural Satellite Account (CSA) is a “function oriented satellite account”.
Figure 1-2 Two Types of Satellite Account
Column 1: Two types of satellite account
SNA System
Function Oriented Satellite Account
Expansion Oriented Satellite Account Reference
Re-edition
7
Here is a look back at the history of National Accounts (SNA). After World War II, there was a growing momentum to develop national income statistics based on internationally common standards, with the primary objective of accurately determining the size of a country's economy. The prototype is "53SNA" published in 1953. The 53SNA was subsequently refined by the United Nations Statistics Commission, led by Richard Stone of Cambridge University, and a revised edition was published in 1968 as the new SNA (68SNA). 68SNA grasps the national economy from the aspects of goods and money, and flows and stocks, and connects it to five economic indicators: an input- output table, a national income account, a fund circulation account, a balance of payments table, and a national balance sheet. 68SNA is a revolutionary system that records the national economy systematically. Richard Stone was honored for this achievement and received the Nobel Prize in Economics in 1984.
As times change, naturally, the way of thinking of SNA will also change. In 1993, "68SNA" was revised and
"93SNA" was published, with two major revisions. The first revision is that the purchase of computer software, which used to be treated as "intermediate consumption", became regarded as gross fixed capital formation (so-called investment), and its stock is classified as "intangible fixed assets". The second revision is that the depletion of fixed capital of government-owned social capital is regarded as social capital services and is added to government final consumption expenditure. The revision will add new value to some intangible goods and services, and will increase gross domestic product (GDP). The response to "93SNA" was extremely cold, as the media was focused solely on increasing GDP. "The government is trying to make GDP look bigger by manipulating statistics," they said. I had hoped the press would report that the move to add value to intangibles was a global trend.
SNA was subsequently revised in 2008.The biggest revision at that time was the expansion of the scope of non- financial assets. As a result of the increasing importance of intellectual stock in production activities, "research and development expenditure", which was previously treated as intermediate input, became regarded as total fixed capital formation, and the accumulation of knowledge stock became treated as a fixed asset.
Efforts to estimate cultural GDP have also been aligned with global trends to add value to intangible goods. The current estimation of "Cultural GDP" by the Agency for Cultural Affairs is to extract production activities related to culture from the GDP estimated based on current standards. However, the estimation of "cultural GDP" is also related to the fundamental question: "what is cultural activity?" For this reason, there are areas that conventional GDP targeting market transactions cannot handle. In the future, the concept of GDP will need to be expanded. In addition, in the compilation of SNA, flows and stocks are consistently accounted for. Regarding cultural GDP, future tasks will be to evaluate the value of cultural stock and to organize the relationship between the flow of cultural assets and stock. Japan is one of the few countries that presents measured values of cultural GDP. It is hoped that Japan will address these issues and make further contributions in the field of cultural GDP.
Kiyoshi Fujikawa
Professor, Nagoya University Organization for Asian Creative Education: Economic Statistics
Column 2: History of cultural GDP estimation
8
1.2.3 UNESCO model and specific developments in this survey
The procedure for estimating cultural GDP consists of two major steps: conceptual work and technical work.
At the conceptual work stage, identify the cultural content (cultural area4) for which GDP is to be estimated. At that time, the status of development of statistical data for the target "cultural field" is also taken into consideration. Next, cultural products related to the cultural area are extracted. Then, the “cultural industry” of the cultural area is specified by associating it with the industrial sector producing the cultural product.
At the technical work stage, first, the production value of cultural products included in each industrial sector is estimated. However, for products for which only the consumption value can be obtained, processing, such as estimating the production value by subtracting the import value from the consumption value, is performed. Finally, we estimate the value added (cultural GDP) by multiplying the value of production by the value added rate of the industry.5 Figure 1-3 The Basic Procedure for Estimating Cultural GDP Figure 1-2 Two Types of Satellite Account
4 The word "domain" is used in UNESCO and other countries already working on CSA.
5 The estimation of cultural GDP in this study considers that the gross value added produced in that area is equivalent to cultural GDP, and the calculation method of multiplying the value of production by the value added rate is the basic calculation method of cultural GDP estimation. The input-output table is used to grasp the added value, and the gross value added rate is based on the input-output table. Non-household consumption expenditures are consumption expenditures paid by companies, such as entertainment expenses and entertainment expenses. In SNA, this is part of intermediate inputs and is not included in gross value added. Since CSA conforms to SNA, the value added rate was calculated using a value added rate that does not include non-household consumption. In other words, the cultural GDP (gross value added) shown in this report does not include non-household consumption expenditure.
Stage 1
1. Defining culture
Clarification of the concept of culture and the nature of cultural activities
2. Identification of cultural commodities
Identifying goods and services (cultural commodities) produced and consumed through cultural activities
3. Identification of cultural industries
Identifying industrial sectors producing and providing cultural goods (i.e.
cultural industries), or allocating goods to specific industry subdivisions Conceptual Work
Stage 2
4. Production and
distribution/allocation of cultural commodities
Calculation of amount consumed Statistical data (surveys, tax revenues, etc.) is used to estimate the production, distribution, and consumption amount of cultural commodities
5. Amounts are allocated across sectors
The total production amount is allocated along culture industry categories compatible with SNA and producing/providing cultural commodities
6. Calculation of cultural GDP
Subtract intermediate inputs from output and calculate cultural value added (GDP) Technical Work
Source: Prepared by CDI
9
1.2.4 Definition and scope of culture
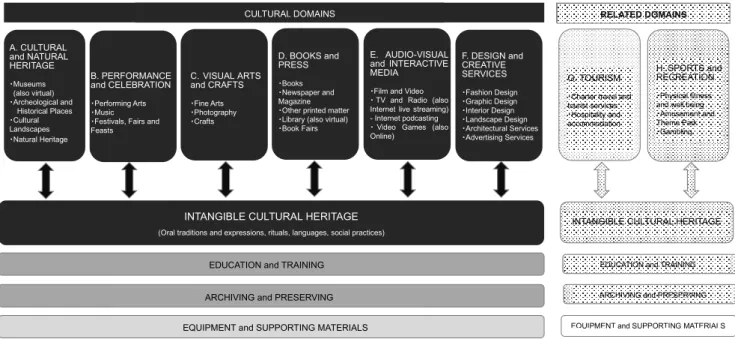
The scope of the culture covered by the CSA follows the UNESCO model. UNESCO's 2009 model consists of six core cultural domains, two related domains and four cross-sectional domains, as shown below.6
This report covers six core cultural areas, as detailed in Chapter 2. However, in the "Cultural Heritage / Natural Heritage" domain, only the museum is targeted, and in the "Visual Arts / Crafts" domain, there are some areas that have not been estimated, such as targeted parts of art, photography, and crafts.
Figure 1-4 The definition and scope of culture according to the UNESCO model
Source: UNESCO FC2009
1.2.5 Scope of cultural products
Regarding the setting of the range of cultural products, the UNESCO model emphasizes the concept of “culture- specific products”7. According to the concept of the UNESCO model, the industry that produces "culture-specific products" is a "cultural industry", and industries and products are strongly related. In other words, it is not considered a cultural industry unless it is an industry that produces “culture-specific products”.
Furthermore, in production activities (activity that creates value added), it is also emphasized that these are goods and services that are linked to “cultural creation” activities.
For example, when it comes to the construction and operation of a museum, architectural design is considered a creative
6 With regard to discussions on CSA at UNESCO, those on setting the boundaries of culture are ongoing. For example, in the 2017 model under consideration, the “education and training” area, which is a cross-sectional area of the 2009 model, and the “cultural management (public and private)” area, which is a completely new area, are core culture area candidates. As described above, the setting of the range of culture has the property of changing according to the way of thinking and the situation. This is the same as changes in the industrial structure and the emergence of new industries. In any case, it should be noted that the definitions of the concept and scope of culture are diverse and change in a certain way, as reflected in the UNESCO debate. It should also be noted that cultural scoping is not an ideal definition, but a pragmatic concept that can be replaced by economic activity.
7 In UNESCO guidelines, it is described as "characteristic cultural product".
A. CULTURAL and NATURAL HERITAGE
・Museums (also virtual)
・Archeological and Historical Places
・Cultural Landscapes
・Natural Heritage
B. PERFORMANCE and CELEBRATION
・Performing Arts
・Music
・Festivals, Fairs and Feasts
C. VISUAL ARTS and CRAFTS
・Fine Arts
・Photography
・Crafts
D. BOOKS and PRESS
・Books
・Newspaper and Magazine
・Other printed matter
・Library (also virtual)
・Book Fairs
E. AUDIO-VISUAL and INTERACTIVE MEDIA
・Film and Video
・TV and Radio (also Internet live streaming) - Internet podcasting
・Video Games (also Online)
F. DESIGN and CREATIVE SERVICES
・Fashion Design
・Graphic Design
・Interior Design
・Landscape Design
・Architectural Services
・Advertising Services
G. TOURISM
・Charter travel and tourist services
・Hospitality and accommodation
H. SPORTS and RECREATION
・Physical fitness and well being
・Amusement and Theme Park
・Gambling RELATED DOMAINS
INTANGIBLE CULTURAL HERITAGE
EDUCATION and TRAINING
ARCHIVING and PRESERVING
EQUIPMENT and SUPPORTING MATERIALS
INTANGIBLE CULTURAL HERITAGE
(Oral traditions and expressions, rituals, languages, social practices)
EDUCATION and TRAINING ARCHIVING and PRESERVING EQUIPMENT and SUPPORTING MATERIALS
CULTURAL DOMAINS
10
service as is the production of culturally unique products. However, the construction of a museum is not included in cultural production. The reason for this is that the construction of an art museum is a production activity of an industry called the "construction industry", but the "construction industry" produces office buildings that are not culturally unique products, as well as ordinary houses and shops. Therefore, the construction industry is not considered to be a production sector for culturally unique products exclusively. However, the operation of museums and art exhibitions is considered a cultural industry.
For example, when it comes to the construction and operation of a museum, architectural design is considered a creative service as is the production of culturally unique products. However, the construction of a museum is not included in cultural production. The reason for this is that the construction of an art museum is a production activity of an industry called the "construction industry", but the "construction industry" produces office buildings that are not culturally unique products, as well as ordinary houses and shops. Therefore, the construction industry is not considered to be a production sector for culturally unique products only. However, the operation of museums and art exhibitions are considered cultural industries. This sector is considered to be producing only culturally specific products as production activities.
There are other examples. The fashion design service is a cultural industry, but the manufacturing of clothing, itself, produced as a related service, is not considered a cultural industry. The television broadcasting industry is a cultural industry, but the manufacture of television equipment is not. Other examples include game software and equipment, publishing and printing. It is also necessary to pay attention to the setting of such cultural (specific) products.
Figure 1-5 Concept of “culture-specific products”
Source: Prepared by CDI
著述
Writer Publishing Book sales
Printing Bookbinding Book/Magazine
CASE 2 CASE 1 Product is culturally specific or creative activity
These products are consumed exclusively for cultural activities or are intermediate inputs.
Products are not necessarily culture-specific It may be partially or sometimes consumed for cultural activity purposes, but is not considered
"culture-specific".
The production sector for such products are the cultural industry.
The production sector for such products are not the cultural industry.
・goods⇒books,movies,
games,some crafts(jewelry, etc), music equipment, etc.
・services⇒concerts,
exhibition,broadcasting,
museums services, library services, architectural design, design, book sales, etc.
・goods⇒buildings,printed matters,media equipment
(TV, radio),daily necessities, etc.
・services⇒retail,
construction,
transportation
include exclude
Clothing
Fashion
design manufacturing Clothing Clothing
sales
Museum
Architectural design
Management
& Operation Art exhibition
Television
TV equipment manufacturing TV equipment
sales Program
production n Broadcasting
Viewing fee Game equipment
Production &
Sales
Game
Game software Production & Sales
(Rental)
Construction
11
1.2.6 Identification of cultural industries
As mentioned above, an industry that produces culture-specific products is regarded as a cultural industry. In order to associate a product with an industry, the product is linked to the industry based on the section classification portion of the input-output table.
1.2.7 Technical work
The estimation of the production value of cultural products and the estimation of the value added rate of each product are described in detail in Chapter 2.
12
Chapter 2
Japanese Cultural GDP
2.1 Scope of estimation
This year's estimation of Japanese cultural GDP aims to be based on the UNESCO model and to respond to the cultural situation in Japan. However, at the same time, the scope of this year's prediction is lacking due to the absence of an estimation method. The estimates are unified with 2016 figures.
From the above, it can be seen that the estimation results for this year do not completely correspond to the UNESCO model. However, for the most part, they succeed in capturing the entire scale and proportions of Japanese cultural GDP. The tables below shows the exceptions, which areas were not estimated, and why.
Figure 2-1 Scope of estimation of Japanese cultural GDP
Cultural area Status Reason
Archeological and Historical Places
Not estimated
(1)Uncertainty of area definition (2)Uncertainty of estimation method (3)Lack of relevant data
Cultural Landscapes Same as above
Natural Heritage Same as above
Festival, Fairs and Feasts Same as above(Especially Uncertainty of area definition)
Book Fairs Same as above(Especially Uncertainty of area definition)
Fine Arts Partial estimation
(1)Lack of data on the art market (2)Uncertainty of estimation method
(Due to the special character of art as a product)
Culture Domains
Design and Creative Services
Audio-Visual and Interactive Media Books and Press Performance and
Celebration Visual arts and
Crafts Cultural and Natural Heritage
・Film and Video
・TV and Radio(also internet live streaming
・Video Games (also Online)
・Fine Arts ・Photography ・Crafts
・Performing Arts
・Music ・Festival, Fairs and Feasts
・Museums(also virtual)
・Archeological and Historical Places
・Cultural Landscapes ・Natural Heritage
・Fashion Design ・Graphic Design
・Interior Design ・Landscape Design
・Architectural Services ・Advertising Services
・Books ・Newspaper and Magazine
・Other printed matter ・Library (also virtual)
・Book Fairs
Full Estimation
Partial Estimation
Not Estimated
Table 2-1 Non-estimated areas of Japanese cultural GDP and reasons for their omission
13
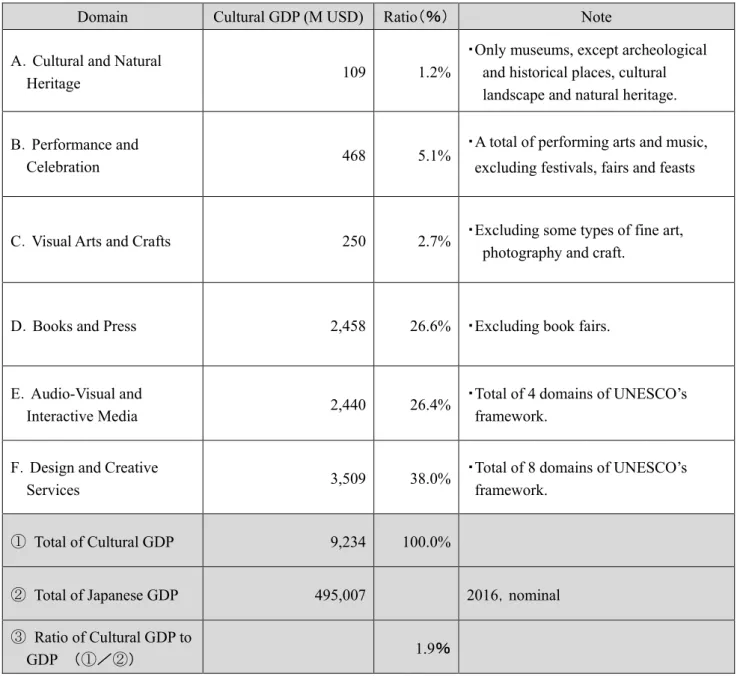
2.2 Results
The total amount of Japanese cultural GDP is 9,234 million USD. This is equivalent to about 1.9% of Japan's total GDP. By comparing cultural GDP with the GDP ratio of agriculture, forestry and fisheries (1.2%), accommodation and food (2.4% ), electricity, gas and water (2.7 %), financial and insurance (4.2%), and transportation (5.0%), its scale can be understood.
The highest share of cultural GDP is the design and creative services domain, at 38.0%, or 3,509 million USD.
This is followed by the books and publishing area (26.6%, 2,458 million USD) and the audiovisual and interactive media area (26.4%, 2,440 million USD). These three domains account for 92.0% of the total.
Domain Cultural GDP (M USD) Ratio(%) Note
A.Cultural and Natural
Heritage 109 1.2%
・Only museums, except archeological and historical places, cultural landscape and natural heritage.
B.Performance and
Celebration 468 5.1% ・A total of performing arts and music,
excluding festivals, fairs and feasts
C.Visual Arts and Crafts 250 2.7% ・Excluding some types of fine art, photography and craft.
D.Books and Press 2,458 26.6% ・Excluding book fairs.
E.Audio-Visual and
Interactive Media 2,440 26.4% ・Total of 4 domains of UNESCO’s
framework.
F.Design and Creative
Services 3,509 38.0% ・Total of 8 domains of UNESCO’s
framework.
① Total of Cultural GDP 9,234 100.0%
② Total of Japanese GDP 495,007 2016,nominal
③ Ratio of Cultural GDP to
GDP (①/②) 1.9%
(Note) Numbers are rounded.
Table 2-2 Japanese Cultural GDP and its Composition
14
2.3 Cultural GDP by Domain
2.3.1 Museum
In the "culture and natural heritage" area, only the museum area was estimated. The reason is that only this area has valid data.
As the museum is a non-profit organization, the project cost of each was regarded as its total production value. The facility activity costs included in the project cost are assumed as intermediate inputs, and other expenditures (personnel costs, tax and public dues, etc.) are estimated as cultural GDP (gross value added).
Museums can be classified into three types: national museums, public museums, and private museums. The estimation results are as follows, and the total gross value added in this area is 109 million USD.
(Unit: M USD)
Total production
value Intermediate input VA
(1) National Museums 2.0 1.1 0.9
(2) Public Museums 15.8 9.9 5.9
(3) Private Museums 8.1 4.0 4.1
Total 25.9 15.0 10.9
The National Museum covered 13 facilities including the Tokyo National Museum. The financial statements of each facility in FY2015 and FY2016 are used as data, and the annual accounts are reset to the calendar year of 2016 to estimate the gross value added in 2016.
There are many public museums. Therefore, in the first stage, the number of target museums was determined.
In the second stage, the financial structure per facility of the public museum was determined, the number of museums was multiplied to extract the overall financial structure, and the VA was estimated.
Private museums, like public museums, determined numbers in the first stage, and in the second stage determined the financial structure and estimated the VA.
Table 2-3 Cultural GDP of Museums
】
15
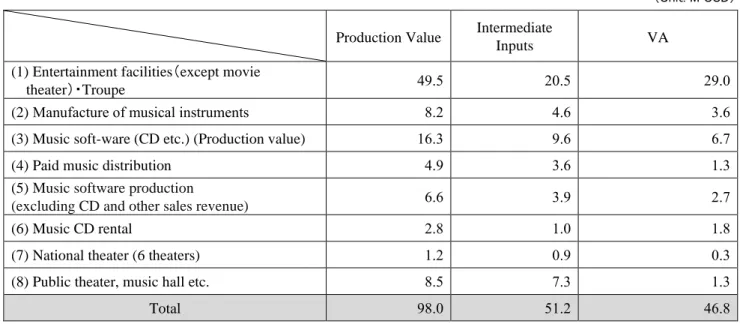
2.3.2 Performance and celebration
In the “performance and celebration” domain, there are subdomains such as “performing arts (including music concerts)”, “musical instrument production”, “music software production”, “concert hall etc.”.
In this domain, first, total sales, total production value, market size, etc. are extracted using various economic statistics of each sector. After that, the VA was estimated using the VA rate of each corresponding department based on the extended input-output table (integrated table).
The estimation in the concert hall etc. uses the same method as in the "museum" domain. The operating cost of the service provider (music hall, etc.) is regarded as the total production value, of which the facility activity costs are considered intermediate inputs, and other expenditures (personnel costs, tax and public dues, etc.) are regarded as the VA .
The estimation results are as follows, and the total VA of this domain is 46 .8 million USD.
(Unit: M USD)
Production Value Intermediate
Inputs VA
(1) Entertainment facilities(except movie
theater)・Troupe 49.5 20.5 29.0
(2) Manufacture of musical instruments 8.2 4.6 3.6
(3) Music soft-ware (CD etc.) (Production value) 16.3 9.6 6.7
(4) Paid music distribution 4.9 3.6 1.3
(5) Music software production
(excluding CD and other sales revenue) 6.6 3.9 2.7
(6) Music CD rental 2.8 1.0 1.8
(7) National theater (6 theaters) 1.2 0.9 0.3
(8) Public theater, music hall etc. 8.5 7.3 1.3
Total 98.0 51.2 46.8
Table 2-4 Cultural GDP of “Performance and Celebration” Domain
】
16
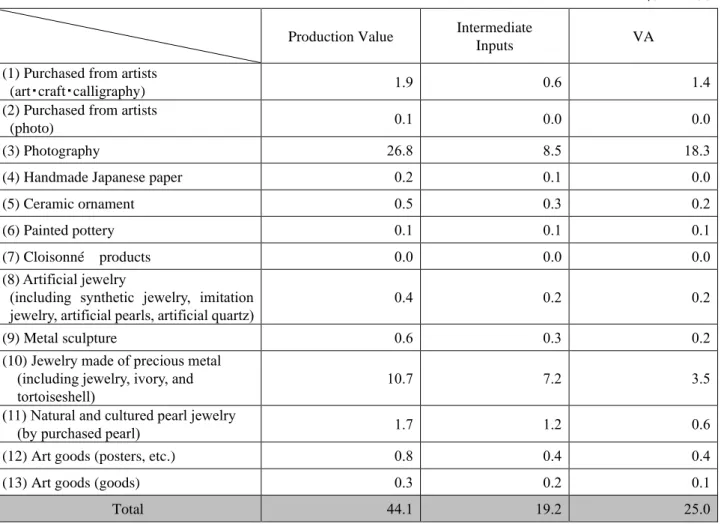
2.3.3 Visual Arts and Crafts
The estimates for the "Visual Arts and Crafts" domain are not complete, and only include direct purchases from artists. In addition, arts include crafts and calligraphy because they cannot be separated statistically. In Japan, there is not enough data on the sale and purchase of artworks by art dealers and galleries, or on the artwork market. Also, the artworks have properties that do not match the "Products (commodities)" definition of SNA.
Data for "photos" and "crafts" are taken from the "Service Industry Trend Survey" (Ministry of Internal Affairs and Communications) and "Industrial Statistics Survey" (Ministry of Economy, Trade and Industry).
As an estimation method, total sales, total production value, market size are extracted using economic statistics for each section. Then, based on the extended input-output table (integrated table), the VA ratio of each corresponding section was used. Cloisonné
Table 2-5 Cultural GDP of “Visual arts and Crafts ” Domain
(Unit: M USD)
Production Value Intermediate
Inputs VA
(1) Purchased from artists
(art・craft・calligraphy) 1.9 0.6 1.4
(2) Purchased from artists
(photo) 0.1 0.0 0.0
(3) Photography 26.8 8.5 18.3
(4) Handmade Japanese paper 0.2 0.1 0.0
(5) Ceramic ornament 0.5 0.3 0.2
(6) Painted pottery 0.1 0.1 0.1
(7) Cloisonné products 0.0 0.0 0.0
(8) Artificial jewelry
(including synthetic jewelry, imitation jewelry, artificial pearls, artificial quartz)
0.4 0.2 0.2
(9) Metal sculpture 0.6 0.3 0.2
(10) Jewelry made of precious metal (including jewelry, ivory, and tortoiseshell)
10.7 7.2 3.5
(11)Natural and cultured pearl jewelry
(by purchased pearl) 1.7 1.2 0.6
(12) Art goods (posters, etc.) 0.8 0.4 0.4
(13) Art goods (goods) 0.3 0.2 0.1
Total 44.1 19.2 25.0
17
2.3.4 Books and Press
This domain is roughly divided into three subdomains: book, magazine publishing and newspaper business, related fields, and libraries. Publishing and newspapers have distinct areas of industry. Therefore, they are well linked to economic statistics, and the figures are relatively clear and easy to estimate.
On the other hand, libraries are public services, so we used the same methods as for museums and public theaters and concert halls.
The VA of this domain estimated by these two methods is 245.8 million USD.
(Unit: M USD)
Production Value Intermediate
Inputs VA
(1) Books 70.1 47.5 22.6
(2) Magazines 82.6 55.9 26.7
(3) Book and magazine retailing
(excluding used books) 107.3 39.1 68.2
(4) Newspaper 109.9 69.5 40.5
(5) Newspaper retail 121.4 44.2 77.2
(6) News agency service 2.2 1.3 0.9
Total 493.6 257.5 236.1
Production Value Intermediate
Inputs VA
(7) National Diet Library 1.6 0.8 0.9
(8) Public Library 21.0 12.2 8.8
Total 22.7 13.0 9.7
Total of “Books and Press” Domain Production Value Intermediate
Inputs VA
Total 516.3 270.5 245.8
Table 2-6 Cultural GDP of “Books and Press” Domain
18
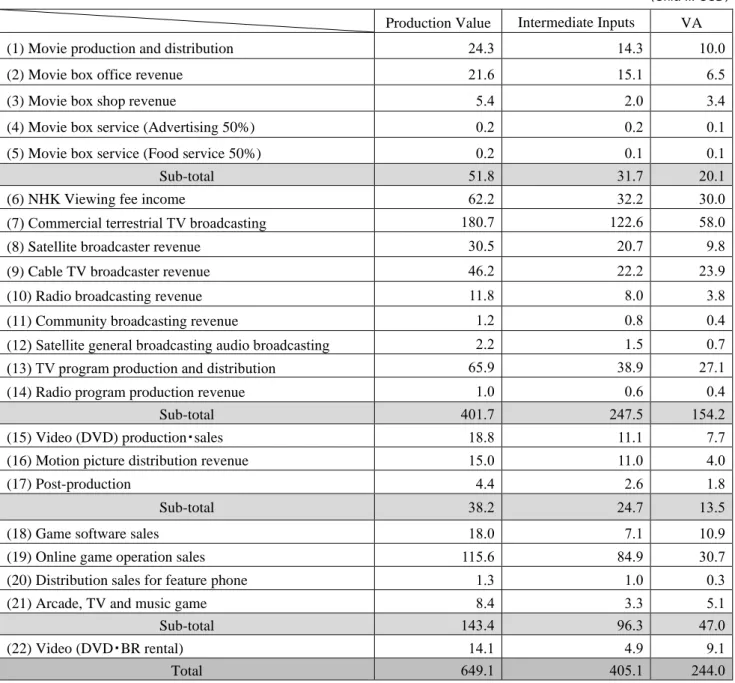
2.3.5 Audiovisual and Interactive Media
This field is characterized by the fact that although the data is relatively complete, the industrial fields are not as detailed as those in the manufacturing industry. Instead, they are united in the service industry. The more detailed division of the service industry is currently a major issue in the study of SNA. In addition, the service industry and its structure are also fields that are rich in change. For example, for movies, the share of online distribution is also increasing. Broadcasting is also diversifying from terrestrial broadcasting to satellite broadcasting and internet broadcasting. Services of online video distribution are also increasing rapidly. The same applies to the game field.
From the mode of enjoying game cassettes (software) on game devices and the mode of enjoying games at a game center, services on the internet and enjoying them have become mainstream. At present, statistical data have not kept up with these changes.
Although there are various issues and problems, the estimation was made by comparing Japan's statistical data with the UNESCO model. The estimated value of VA in this area is 244.0 million USD.
(Unit: M USD)
Production Value Intermediate Inputs VA
(1) Movie production and distribution 24.3 14.3 10.0
(2) Movie box office revenue 21.6 15.1 6.5
(3) Movie box shop revenue 5.4 2.0 3.4
(4) Movie box service (Advertising 50%) 0.2 0.2 0.1
(5) Movie box service (Food service 50%) 0.2 0.1 0.1
Sub-total 51.8 31.7 20.1
(6) NHK Viewing fee income 62.2 32.2 30.0
(7) Commercial terrestrial TV broadcasting 180.7 122.6 58.0
(8) Satellite broadcaster revenue 30.5 20.7 9.8
(9) Cable TV broadcaster revenue 46.2 22.2 23.9
(10) Radio broadcasting revenue 11.8 8.0 3.8
(11) Community broadcasting revenue 1.2 0.8 0.4
(12) Satellite general broadcasting audio broadcasting 2.2 1.5 0.7
(13) TV program production and distribution 65.9 38.9 27.1
(14) Radio program production revenue 1.0 0.6 0.4
Sub-total 401.7 247.5 154.2
(15) Video (DVD) production・sales 18.8 11.1 7.7
(16) Motion picture distribution revenue 15.0 11.0 4.0
(17) Post-production 4.4 2.6 1.8
Sub-total 38.2 24.7 13.5
(18) Game software sales 18.0 7.1 10.9
(19) Online game operation sales 115.6 84.9 30.7
(20) Distribution sales for feature phone 1.3 1.0 0.3
(21) Arcade, TV and music game 8.4 3.3 5.1
Sub-total 143.4 96.3 47.0
(22) Video (DVD・BR rental) 14.1 4.9 9.1
Total 649.1 405.1 244.0
Table 2-7 Cultural GDP of Audiovisual and Interactive Media” Domain
19
2.3.6 Design and Creative Services
This domain consists of two groups of subdomains. These are "fashion design", "graphic design", "interior design", and "landscape design" in design, and "building service" and "advertising service" in creative service.
Both groups cover only creative and intellectual process service activities. Therefore, for example, clothing itself produced by the activity of fashion design is not included in the estimation.
The handling of such industrial fields is one of UNESCO's policies. Manufactured goods are not considered cultural goods unless they are characteristic to cultural activities. (On the other hand, musical instruments and jewelry products are characteristic to culture.)
In the design field, industrial design is not included. It seems appropriate to add fields such as "package design"
and "display design", which are regarded as "design industry" in Japanese economic statistics.
This domain is an area where discussions continue at UNESCO. It is expected that the category of "intellectual property" including copyright issues and copyright processing services will be discussed in the future.
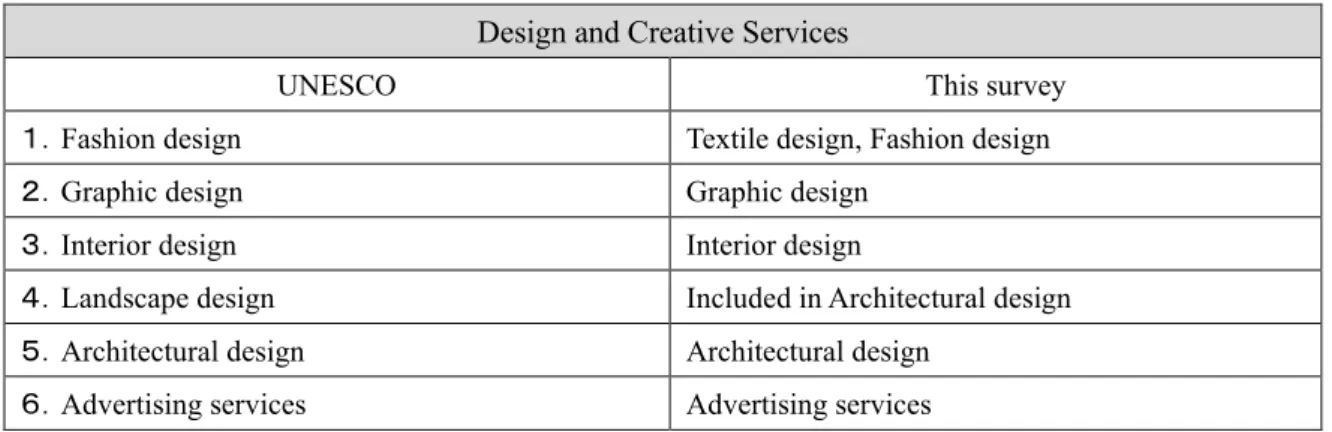
In this estimation, the following changes are applied to the UNESCO framework.
Table 2-8 Compatible with the UNESCO model in “Design and Creative Services” domain Design and Creative Services
UNESCO This survey
1.Fashion design Textile design, Fashion design
2.Graphic design Graphic design
3.Interior design Interior design
4.Landscape design Included in Architectural design
5.Architectural design Architectural design
6.Advertising services Advertising services
The estimated VA of this domain is 350.9 million USD.
(Unit: M USD)
Production Value Intermediate
inputs VA
(1)Textile design, Fashion design 1.5 0.5 1.1
(2)Graphic design 24.4 7.1 17.2
(3)Interior design 1.7 0.5 1.2
(4) Architectural design (also Landscape design) 231.7 72.5 159.2
(5) Advertising services 578.0 405.8 172.2
Total 837.3 486.4 350.9
Table 2-9 Cultural GDP of “Design and Creative Services” domain
】
20
Chapter 3
Approaches to amateur cultural activities
3.1 Positioning and development of amateur cultural activities
3.1.1 Position in the UNESCO model
As mentioned in Chapters 1 and 2, this estimation of Japan's cultural GDP is based on the UNESCO system.
However, there are some problems with using it. In the UNESCO system, only activities with direct market value are included in the category of cultural activities. In other words, it covers only professional cultural activities. However, amateur cultural activities such as club music activities and traditional performing arts by volunteers can also be considered cultural activities. Thus, UNESCO's current system does not clearly include amateur cultural activities.
However, if we try to capture cultural activities socially and practically, we cannot ignore these cultural activities by amateurs.
UNESCO also recognizes this as one of the issues of the Cultural Satellite Account (CSA), and is currently discussing how to position amateur cultural activities, participation activities, and volunteer activities in the cultural field within the CSA. Based on the awareness of these issues, this year's survey attempted to estimate cultural GDP through amateur cultural activities in the fields of arts and crafts and music.
3.1.2 Estimation method
The estimation method estimates cultural demand from the consumption of amateur cultural activities. This is an approach from the consumer side, not the approach from the production side adopted in the UNESCO model CSA.
The idea and procedure of the estimation are as follows.
(1) Artifacts created by amateur cultural activities are not actually traded on the market. Therefore, the product is not marketable and not a commodity. In other words, the amount of output from amateur cultural activities cannot be calculated.8
(2) However, amateur cultural activities consume goods and services necessary for their activities. That is, there is demand. We focus on what is produced in response to this demand. In other words, focus on intermediate inputs, not on products. Examples of intermediate inputs are dance costumes, musical instruments and tools, membership fees, and texts.
(3) Since these intermediate inputs are essential for cultural activities, they are regarded as “cultural products”.
(4) The estimated added value of these “cultural products” is regarded as cultural GDP.
8 There is also a method to estimate the added value of non-market activities such as volunteer activities. However, in this method, the added value of amateur cultural activities becomes an "expansion-oriented satellite account", which is outside the SNA system. This case seeks to estimate the cultural GDP included in SNA.
21
3.2 Hobby and creative amateur cultural activities and cultural GDP
In the “Leisure White Paper 2017” (Japan Productivity Center), a sample survey (valid collections: 3,328) was conducted online for men and women aged 15 to 79 years old (every year). The main survey contents are the activity content, the activity frequency, and the amount of consumption accompanying the activity. Using the input-output table and this data, make the following estimations.
3.2.1 Amateur activities of performing arts and music
Calculate the active population based on the activity participation rate in the “Leisure White Paper 2017”.
Domain Activity Number of participants (thousand people)
Performing Arts
Dance (Japanese style) 700
Dance (Western style) 1,200
Music
Chorus 2,200
Playing western instruments 7,000
Japanese music and folk songs 2,100
Estimate annual consumption by multiplying the per capita consumption by the number of activists.
Equipment cost per person
(annual average) (thousand JPY)
Membership fee per person (annual average)
(thousand JPY)
Total annual consumption per person
(thousand JPY)
Equipment cost (total) (B JPY)
Membership fee (total)
(B JPY)
Annual total (B JPY) Dance
(Japanese style) 44.8 51.7 96.5 31,360 36,190 67,550
Dance (Western style) 22.3 33.8 56.1 26,760 40,560 67,320
Chorus 8.3 12.7 21.0 18,260 27,940 46,200
Playing western
instruments 27.1 16.3 43.5 189,700 114,100 304,500
Japanese music and
folk songs 16.3 26.9 43.2 34,230 56,490 90,720
The content of consumption is divided into membership fees and equipment costs. The latter vary depending on the field. The details cannot be grasped from this data. In the music domain, the portion counted in the musical instrument manufacturing industry is double counted. This estimate covers only items such as membership fees.
In the next step, VA is estimated using the VA rate of "individual teaching work" in the extended input-output table (integrated table). VA is estimated at 1,991 million USD.
Source: CDI based on "Leisure White Paper 2017" (Japan Productivity Center)
Table 3-2 Estimating annual consumption of hobby and creative amateur cultural activities
】
Table 3-1 Number of participants in hobby and creative amateur cultural activities
】
Source: CDI based on "Leisure White Paper 2017" (Japan Productivity Center)
22
(Unit: m USD)
Production Value Intermediate
Inputs VA
Dance (Japanese style) 333 71 262
Dance (Western style) 373 79 293
Chorus 256 55 202
Playing western instruments 1,049 223 825
Japanese music and folk songs 519 110 408
Total 2,530 540 1,991
Table 3-3 Estimating cultural GDP of hobby and creative amateur cultural activities
】
23
3.2.2 Amateur activities of art and craft
The method and procedure are the same as those for performing arts and music amateur activities. First, determine the active population.
Domain Activity Number of participants
(thousand people)
Art Drawing and sculpture 65,00
Craft
Pottery 14,00
Braid, paper craft, leatherwork, etc. 48,00
Knitting, weaving, handicraft 11,500
Photography Photo production 14,300
Estimate annual consumption by multiplying the per capita consumption by the number of activists.
Equipment cost per person (annual average)
(thousand JPY)
Membership fee per person (annual average)
(thousand JPY)
Total annual consumption per person
(thousand JPY)
Equipment cost (total)
(B JPY)
Membership fee (total)
(B JPY)
Annual total (B JPY) Drawing and
sculpture 8.9 5.7 14.6 57,850 37,050 94,900
Pottery 13.6 5.8 19.4 19,040 8,120 27,160
Braid, paper craft,
leatherwork, etc. 10.8 5.4 16.2 51,840 25,920 77,760
Knitting, weaving,
handicraft 7.8 3.1 10.9 89,700 35,650 125,350
Photo production 17.1 2.6 19.7 244,530 37,180 281,710
Only the consumption amount, such as membership fees, is estimated. The VA is estimated using the VA rate of
"individual teaching work" in the extended input-output table (integrated table).
The VA is estimated at 1,041 million USD.
(Unit: m USD)
Production Value Intermediate Inputs VA
Drawing and sculpture 341 73 268
Pottery 74 16 59
Braid, paper craft, leatherwork, etc. 238 51 188
Knitting, weaving, handicraft 328 70 258
Photo production 342 73 269
Total 1,323 282 1,041
Table 3-4 Number of participants in amateur activities of
art and craft
】
Table 3-5 Estimating annual consumption of creative amateur of
art and craft
Estimating annual consumption of hobby and creative amateur cultural activities
】
Table 3-6 Estimating cultural GDP of creative amateur of
art and craft
】
Source: CDI based on "Leisure White Paper 2017" (Japan Productivity Center)
Source: CDI based on "Leisure White Paper 2017" (Japan Productivity Center)
24
Chapter 4 Issues to address, and proposals for estimating cultural GDP
4.1 Significance of cultural GDP estimation
Estimating cultural GDP involves numerically measuring the impact of culture on the economy. Because cultural GDP is estimated within the National Accounts (SNA) system, it can be compared to other industries that are also within the SNA system. Since SNA is an international system, international comparisons are also possible.
By comparing cultural and economic figures within the SNA system, it is possible to numerically understand the economic and economic position (properties, scale, structure, linkage, etc.) of an aspect of culture.
Since GDP is an economic indicator that is the axis of economic growth, if we can grasp the economic position of culture from the viewpoint of GDP, we can express the contribution of culture to GDP (economic growth) in concrete figures.
The following developments can be expected as a result of using specific cultural GDP figures as evidence.
① Confirmation of the importance of culture in economic activities
② Strengthening cooperation between economic and cultural activities
③ Strengthening economic support for culture
From the cultural side, the objective quantitative measure of culture broadens the perspective on the effects and results of cultural policies. Based on this, the following developments in cultural policy can be expected.
① Quick numerical measurement of the effects of cultural policies and the addition and modification of cultural policies based on them
② Cooperation between cultural and economic policies
③ Emphasis on the contribution of culture to economic and industrial development
Cooperation between culture and the economy will clarify the social composition of sustainable mutual revitalization, and will enable rapid development of effective cultural policies in this regard.
Of course, the position of the international culture of Japan can be grasped numerically. It can also strengthen the relationship between culture and economy in regional development.