2020 Cultural Administration Research Survey
A Quantitative Evaluation:
The Economic and Social Effects of Culture (4)
March 2021
Agency for Cultural Affairs, Japan
Published in 2021
Agency for Cultural Affairs, Japan
Headquarters for Vitalizing Regional Cultures 43-3 Bishamoncho, Higashiyama-ku, Kyoto 605-8505, Japan
Tel; +81-75-330-6720 Fax; +81-75-561-3512
Email; [email protected] https://www.bunka.go.jp/
©2021 Agency for Cultural Affairs-Japan
Research: Communication Design Institute
83 Tomoecho, Karasuma-dori Muromachi Higashiiru, Nakagyo-ku, Kyoto
604-0863, Japan
i
Table of contents
The Framework of this research ... 1
1. Purpose of the survey ... 1
2. Survey content ... 2
Chapter1 Cultural GDP and its Estimation ... 5
1. The Concept of Cultural GDP ... 5
2. Concept of estimating cultural GDP ... 7
3. Determining the Range of Culture ... 9
4. Methodology ... 10
Chapter 2 Estimation of Japanese Cultural GDP and Employment ... 11
1.Overall picture ... 11
1-1 Cultural GDP ... 11
1-2 Transition ... 12
2. Estimation of Cultural Employment ... 13
2-1. Methodology ... 13
2-2. Estimated result(2018) ... 13
3. Cultural GDP by domain ... 15
3-1 Cultural/Natural Heritage ... 15
3-2 Performance/Celebration ... 16
3-3 Visual arts/ Crafts ... 17
3-4 Books/Press ... 18
3-5 Audio-visual/Interactive media ... 20
3-6 Design/Creative services ... 22
Chapter 3 Economic Ripple Effect of Culture ... 23
1.Concept and Methodology ... 23
2. Estimations(2018) ... 23
2-1 Cultural facility admission fee (related to cultural/natural heritage) ... 23
2-2 Theater (related to performance/celebration) ... 24
2-3 Concerts (related to performance/celebration) ... 25
2-4 Art exhibition (related to visual arts/crafts) ... 25
2-5 Book and Magazine (related to books/press) ... 26
2-6 Newspaper (related to books/press) ... 27
2-7 Movie (related to audio-visual/interactive media) ... 28
Chapter 4 CSA of Other Countries ... 29
1. USA ... 29
2. UK ... 31
3. Australia ... 33
4. Canada... 34
5. Germany ... 36
6. France ... 37
7. Mexico ... 39
Chapter 5 Proposals for new cultural policies ... 41
ii Figures and Tables
[Figure 1-1 Cultural circle] ... 7
[Figure 1-2 Framework for cultural statistics domains (UNESCO FCS2009) ... 9
[Figure 1-3 The Basic Procedure for Estimating Cultural GDP] ... 10
[Figure 2-1 Breakdown of cultural GDP (2018)] ... 11
[Figure 2-2 Transitions in Cultural GDP (2016-2018)] ... 12
Tables [Table 2-1 Domestic production of Japanese culture (2018)] ... 11
[Table 2-2 Cultural Employment (2018)] ... 14
[Table 2-3 Transitions in Cultural Employment (2016-2018)] ... 14
[Table 2-4 Domestic product and VA of cultural/natural heritage (2018)] ... 15
[Table 2-5 Annual transitions in cultural/natural heritage (2016-2018)] ... 15
[Table 2-6 Domestic product and VA of performance/celebration (2018)] ... 16
[Table 2-7 Transitions in Performance/Celebration (2016-2018)] ... 16
[Table 2-8 Domestic product and VA of visual arts/crafts (2018) ... 17
[Table 2-9 Transitions in visual arts/crafts (2016-2018)]... 17
[Table 2-10 Domestic product and VA of books/press (2018)] ... 18
[Table 2-11 Transitions in books/press (2016-2018)] ... 19
[Table 2-12 Domestic product and VA of audio-visual/interactive media (2018)] ... 20
[Table 2-13 Transitions in audio-visual/interactive media (2016-2018)] ... 21
[Table 2-14 Domestic product and VA of design/creative services (2018)] ... 22
[Table 2-15 Transitions in design/creative services (2016-2018)] ... 22
[Table 3-1 Estimation of domestic demand for cultural facility admission fee] ... 23
[Table 3-2 Estimation of ripple effect from cultural facility admission fees] ... 24
[Table 3-3 Estimations of the domestic demand for theater] ... 24
[Table 3-4 Estimations of the ripple effect of theater] ... 24
[Table 3-5 Estimation of domestic demand for concerts] ... 25
[Table 3-6 Estimations of the Ripple Effect of Concerts] ... 25
[Table 3-7 Estimation of domestic demand for concert] ... 25
[Table 3-8 Estimation of ripple effect of art exhibition] ... 26
[Table 3-9 Estimation of domestic demand for book and magazine] ... 26
[Table 3-10 Estimation of ripple effect of book and magazine]... 27
[Table 3-11 Estimation of domestic demand for newspaper]... 27
[Table 3-12 Estimation of ripple effect of newspaper] ... 28
[Table 3-13 Estimation of domestic demand for movie]... 28
[Table 3-14 Estimations of the ripple effect of movies] ... 28
[Table 4-1 Cultural GDP and employment of USA (2017)] ... 29
[Table 4-2 Cultural GVA of UK (2018)] ... 32
[Table 4-3 Cultural GDP of Australia (2018)] ... 34
[Table 4-4 Cultural GDP of France (2018) ... 38
iii
Note 1: This survey was conducted with the advice, cooperation, and supervision of the
"Research Council for “A Quantitative Evaluation: The Economic and Social Effects of Culture” organized by the trustee, CDI. (The Agency for Cultural Affairs commissioned the research council members.) “This survey” or “we” in this report refers to this research council.
Note 2: Monetary amounts converted into Japanese yen or US dollars in this report use the IMF (International Monetary Fund) exchange rate (annual average).
Note 3: Figures and tables in the text with no visible references were created by CDI and are primarily based on the sources listed at the end of this document.
Note 4: The figures in the table are rounded off. Breakdowns and totals may differ.
iv
Abbreviations
CAB Convenio de Andrés Ballo CPC Central Product Classification CSA Culture Satellite Account EBPM Evidence-Based Policy Making FCS Framework for Cultural Statistics GDP Gross Domestic Product
GVA Gross Value Added
ISIC International Standard Industrial Classification NAICS North American Industry Classification System SNA System of National Accounts
TSA Tourism Satellite Account UIS UNESCO Institute for Statistics
VA Value Added
1
The Framework of this research
This report is the result of the "2020 Cultural Administration Research Survey---A Quantitative Evaluation: The Economic and Social Effects of Culture (4)". The research period extended from June 23, 2020 to March 31, 2021, and used the following framework.
1. Purpose of the survey
Japan's cultural GDP estimation and cultural satellite account (CSA) compilation began in 2015. To date, we have conducted case studies on cultural GDP, preliminary estimates, surveys of leading countries, and discussions with the UNESCO Institute for Statistics (UIS). This year, based on the progress so far, we re- estimated Japan's cultural GDP and estimated employment on a full scale using the UNESCO model. It can be said that this has made it possible to grasp the fundamental numerical values regarding the relationship between Japan's culture and economy.
In addition to cultural GDP and cultural employment estimations, the following work was also carried out this year.
(1) Estimations of the ripple effect of culture on the economy (2) Updating of the international comparison
(3) Estimations of the cultural heritage GDP as seen from final demand
(1) substitutes a useful indicator of the impact of culture on the economy, which differs from the UNESCO model method of estimating cultural GDP. (2) secures an important viewpoint for utilizing the results of cultural GDP estimation in cultural policy. In this way, one aspect of Japan's cultural and economic position in the world can be grasped quantitatively. (3) is Japan's experimental approach to the challenges faced by the countries of the world working on CSA, including UIS, in estimating the cultural GDP using the UNESCO model.
The results obtained from the above work comprise the foundation for establishing a path leading to EBPM (evidence-based policy making) of cultural policy, using CSA as a "tool" in the future. In other words, the quantification of the economic and social impact of culture can be broadened, and the foundation for planning, drafting, and executing cultural policies can be enriched.
2
2. Survey content
This research study is roughly divided into two stages. In Stage 1, we enhanced the UNESCO model's cultural GDP estimation, and estimated the economic ripple effect of the associated culture. In Stage 2, we compare the results of Stage 1 with those of other countries, participate in international conferences, etc., widely publicize the results, and encourage proposals for new cultural policies.
(1) Estimate of value-added induction effect (estimation of cultural GDP)
Cultural GDP was estimated within the framework of the UNESCO model of culture. For the 2018 estimation, we used various statistical results (basic data) of confirmed values and the 2016 extended input-output table. Estimates for 2016 and 2017 are also based on the same criteria.
(2) Estimate of production-inducing effect (estimating the economic spillover effect)
The production-inducing effect is the "production spillover effect that occurs when demand newly increases," and is viewed from the demand side. This differs from the estimation of cultural GDP of the UNESCO model viewed from the production side. In this study, the entire final demand (total demand) of each cultural industry (each domain) is regarded as "additional final demand".
The final demand was extracted from the data of existing surveys such as the annual household survey / household consumption survey (Ministry of Internal Affairs and Communications) and the White Paper on Leisure (Japan Productivity Center). The added value was estimated using the input- output table. However, since there is a limit to obtainable data, the estimation was made using only valid data. The cultural activities targeted for the estimation are limited.
(3) Estimate of employment induction effect
There are two types of employment: employment created by production activities and employment created by production-inducing effects. The former is linked to the estimation of the value-added effect, and the latter is linked to the estimation of the production-inducing effect. For these two, the number of employees corresponding to the production value, etc. was estimated for the three years of 2016, 2017, and 2018 using the employment table (calculation of employment coefficient) of the 2015 input-output table.
(4) Comparing the survey with those of other countries
We have updated and enhanced the survey on international comparisons conducted last year. The countries surveyed are those making advanced efforts to compile CSA and estimate the economic scale of the cultural and creative industries: the United States, the United Kingdom, Australia, Canada, Germany, France, and Mexico.
3 (5) Publicizing our findings at international conferences
Participated in an international conference and gave a presentation.
The following English materials were created and used in conjunction with our presentations.
・Outline of the presentation
・Presentation handouts/slides for the day
・Research papers on which the presentation was based
(6) Preparation of report / English translation / preparation of summary (simplified report) (7) Proposals for new cultural policies
In carrying out the work, a study group was set up by the following members, and the work was promoted while receiving advice and supervision.
< Study Group Members*>
Tadayuki Hara
(Associate Dean, Associate Professor and Senior Research Fellow of University of Central Florida, Rosen College of Hospitality Management, Member of UIS Culture Satellite Account Technical Advisory Group (CSA TAG), Advisor of Cultural Policy Research, Agency for Cultural Affairs, Japan) Takanobu Nakajima
(Professor, Faculty of Commerce, Keio University: Applied Economics) Kiyoshi Fujikawa
(Professor, Faculty of Economics, Aichi Gakuin University: Economic Statistics) Tadashi Yagi
(Professor, Faculty of Economics, Doshisha University: Cultural Economics)
*(Occupational titles are as of 2020) ICES 2021(Pan Pacific Association of Input -Output Studies (PAPAIOS)
19-21 March, 2021
Kobe International House (Kobe City)
4
5
Chapter1 Cultural GDP and its Estimation
1. The Concept of Cultural GDP
GDP (Gross Domestic Product) is "the total amount of added value produced in a country within a certain period of time". It is a central indicator of the SNA (System of National Accounts), which is a comprehensive statistical measure of the economy, and is used as an indicator of the economic scale of a country (or single region). GDP is calculated in compliance with the accounting standards of the national economy set by the United Nations, which makes it possible to apply a common measure to the evaluation of each country’s economic scale.1 Although this occurred around 50 years ago, in 1971, a major newspaper company in Japan published a book entitled, "Kick out GNP-The Inside Facts of High Economic Growth"
(direct translation of Japanese title) which brought discussion of the issues around GNP to the forefront. (At the time, nationality was more important than national borders, and GNP (Gross National Product) was in common use). The content of this popular book opposed measuring a country's economic power with the economic indicator of value added. However, although the first practical version of SNA was published in 1968, the concept has been revised since that time. It took 50 years to “kick out” the basic concept of GDP because it enabled the convenience of evaluating the economic size of each country with a common measure.
In fact, there are two types of GDP: nominal GDP, in which value added is represented by the nominal value of each year, and real GDP, in which value added is estimated by fixing the price evaluation point to remove the effects of price fluctuations. Economic growth rate is the growth rate of real GDP. In addition, although GDP is the sum of added value, in principle only the added value related to the production of goods and services traded in the official market is recorded.2
“Added value” is the value created by subtracting the costs of raw materials and fuels required for production from the total production value, and newly created by production activities. Cultural GDP is the added value created by cultural activities. The value created as a result of cultural activities is diverse, and includes non-monetary and non-market types. However, the only economic added value that is captured in the framework of GDP is cultural GDP. More specifically, cultural GDP is an amount included within the existing GDP framework. This is equivalent to the “function-oriented satellite account” described later. Therefore, it
1 The SNA has several versions. The prototype was launched in 1953, the substantial first version in 1968, the revised version in 1993, and the revised version in 2008. Regarding the evaluation of value added, the evaluation method has been modified to match that of the real economy.
2 Activities that are not traded in the market, with some exceptions, are not included in GDP. For this reason, domestic work and volunteer activities that are not part of the work of registered non-profit organizations are not included in GDP. The exceptions are farmer's self-consumption (which assumes that they took produce to market and bought it back again) and the rent of an owner's house (the resident who pays rent to a landlord who is him/herself, the tenant). Markets are official markets, and value added in illegal markets such as those of drugs and gambling are not included in GDP. Only production activities create added value. For example, if there is a gain in land transactions, only the real estate brokerage fee is recorded in GDP. In connection with this, the increase in value due to the rise in land prices is not included in added value, and the asset value is recorded as an increase. The same is true for the trading of antiques, paintings, or stock or gold financial assets.
6
must be noted that cultural GDP does not seek to add new value to cultural activities or cultural creative activities.
7
2. Concept of estimating cultural GDP
The SNA framework presupposes existing industry classifications. The industrial classification is based on the criteria that similar products are produced by similar production methods. On the other hand, in cultural activities, the industries that produce them are not necessarily classified as one group, and in most cases, they are part of an industry or cross multiple industries. Therefore, in order to estimate cultural GDP, it is necessary to extract and recount the value added (cultural GDP) of cultural activities that are part of GDP in various industrial sectors. For example, if we look at music activities as an industry, we will extract the musical instrument manufacturing part from the manufacturing industry, and then perform the artist's performance (entertainment), and also record it, manufacture the CD, sell it, rent it. This is referred to as the "cultural circle" of cultural activities, and industrial activities are involved in each stage of these cultural activities. The
"cultural production" of music activities is the integration of the music activities of each stage in relation to industrial activities. What is more, the value added created there is the "GDP of music culture".
In addition to music, the total of industrial activities in fields related to activities considered to be human cultural activities, such as performing arts, visual arts, literature, and protection and utilization of cultural properties, is cultural production, and its value added is cultural GDP. This cultural GDP is estimated based on SNA. The estimation system is Cultural Satellite Accounts (CSA). CSA is a system reconfigured by recombining an existing SNA.3。
[Figure 1-1 Cultural circle]
3 CSA is a cultural version of SNA. As SNA is also a type of GDP indicator, CSA is a "cultural GDP indicator", but SNA includes factors such as gross national income and its distribution by industry in addition to GDP. Therefore, it is possible to estimate employment by culture in addition to cultural GDP. This survey also estimates cultural employment. Internationally, CSA is an account that includes not only cultural GDP but also cultural imports and exports in addition to the estimation of employment by culture.
1.創造
2.生産
3.普及
4.展示/受信 /発信 5.消費/参加
Source: UNESCO FC2009 4.Exhibition/Reception/
Transmission
1.Creation
2.Production
3.Dissemination 5.Consumption
/Participation
8
In order to estimate cultural GDP, the following two tasks are required.
①Determining the range of culture
②Determining the estimation method
Regarding these two tasks, the UNESCO Institute for Statistics has published the "2009 UNESCO Framework for Cultural Statistics" (2009 FCS) as a guideline. This guideline is the current international standard for CSA preparation and is the basis for CSA preparation and cultural GDP estimation in countries such as Canada, Australia and South American countries. The "determining of the range of culture" and
"method of estimation" in this research have also been determined based on this.
9
3. Determining the Range of Culture
The cultural scope of the cultural GDP estimation in this research study is set as shown in the figure below, based on the 2009 FCS. The gray area is the scope of cultural GDP estimation. This corresponds to the core cultural area of 2009 FCS. In addition to the core cultural areas, the UNESCO framework includes related areas and cross-disciplinary areas, but these are not included in the estimation in this study.4
[Figure 1-2 Framework for cultural statistics domains (UNESCO FCS2009)
4 Discussions on determining the scope of culture are still ongoing at UNESCO. For example, in the 2017 model under consideration, the cross-disciplinary area of “education / training” of the 2009 model and the completely new area of “cultural management (public and private)” are candidates for core cultural areas. Cultural scope determination is not a conceptual definition, but a pragmatic one that can be replaced with economic activity.
Source:UIS (2015) “Culture Satellite Account: An Examination of Current Methodologies and Country Experiences”
10
4. Methodology
The procedure for estimating cultural GDP consists of two major steps: conceptual work and technical work. The content (cultural area) of the culture to be estimated by GDP is classified at the conceptual work stage. This is as shown in the previous section.
Next, the cultural products related to the cultural domain are extracted. At the technical work stage, the production value of cultural products included in each industrial sector is first estimated. However, for products for which only the consumption value can be obtained, processing such as estimating the production value by subtracting the import amount from the consumption value is performed. Then, by multiplying the production value by the value-added ratio of the industry, the value-added value (cultural GDP) is estimated.5
[Figure 1-3 The Basic Procedure for Estimating Cultural GDP]
5 The cultural GDP estimation of this survey considers that the gross value added produced in that area corresponds to the cultural GDP, and "multiplying the production value by the added value rate" is the basic calculation method of the cultural GDP. The input- output table is used to grasp the added value, and the gross value-added ratio is based on the input-output table. In the input-output table, the gross value added includes "non-household consumption expenditure". Non-household consumption expenditure is
consumption expenditure paid by companies such as entertainment expenses and entertainment expenses, but in SNA this is part of the interim input and is not included in gross value added. Since CSA conforms to SNA, the value-added rate was calculated using the value-added rate that does not include non-household consumption. In other words, the cultural GDP (gross value added) shown in this report does not include non-household consumption expenditure.
Stage 1
1. Defining culture
Clarification of the concept of culture and the nature of cultural activities
2. Identification of cultural commodities
Identifying goods and services (cultural commodities) produced and consumed through cultural activities
3. Identification of cultural industries
Identifying industrial sectors producing and providing cultural goods (i.e.
cultural industries), or allocating goods to specific industry subdivisions Conceptual Work
Stage 2
4. Production and
distribution/allocation of cultural commodities
Calculation of amount consumed
Statistical data (surveys, tax revenues, etc.) is used to estimate the production, distribution, and consumption amount of cultural commodities
5. Amounts are allocated across sectors
The total production amount is allocated along culture industry categories compatible with SNA and producing/providing cultural commodities
6. Calculation of cultural GDP
Subtract intermediate inputs from output and calculate cultural value added (GDP) Technical Work
Source: Prepared by CDI
11
Chapter 2 Estimation of Japanese Cultural GDP and Employment
1.Overall picture
1-1 Cultural GDPIn 2018, the domestic production of Japanese culture was 25,954.6 billion yen, and the gross domestic product (cultural GDP) was 10,538.5 billion yen. Cultural GDP accounted for 1.9% of Japan's total GDP.
[Table 2-1 Domestic production of Japanese culture (2018)]
(Billion JPY)
Domestic production Gross domestic product (cultural GDP)
Cultural production 25 954.6 10 538.5
Ratio to total production 2.5% 1.9%
The breakdown of cultural GDP shows that the design / creative service sector accounts for about 48.7% of the total. The audiovisual/interactive media sector accounts for 25.5%, and the books/press sector accounts for 15.9%. These three divisions account for 90.1% of the total.
[Figure 2-1 Breakdown of cultural GDP (2018)]
1,346 2,751
6,287
16,768
26,887
51,346
0 10,000 20,000 30,000 40,000 50,000 60,000
文化遺産/自然遺産 ビジュアルアーツ/工芸 パフォーマンス/セレブレーション 著作・出版/報道 オーディオ・ビジュアル/インタラクティブメディア デザイン/クリエイティブサービス
(100 million JPY)
Design/Creative services Audiovisual/Interactive media Books/Press Performance/Celebration Visual arts/Crafts Cultural/Natural Heritage
(48.7%) (25.5%)
(15.9%)
(6.0%)
(2.6%)
(1.3%)
12 1-2 Transition
The transition of cultural GDP from 2016 to 2018 has changed slightly in both the 10 trillion yen range and 1.8% range. The two-year growth rate of cultural GDP was 4.1%. At the same time, Japan's GDP growth rate was 2.2%.
[Figure 2-2 Transitions in Cultural GDP (2016-2018)]
101,261 101,318
105,385 1.86%
1.83%
1.89%
1.50%
1.60%
1.70%
1.80%
1.90%
2.00%
100,000 101,000 102,000 103,000 104,000 105,000 106,000 107,000 108,000 109,000 110,000
2016年 2017年 2018年
文化GDP合計(左目盛) 文化GDPの比率(右目盛)
(100 million JPY)
2016 2017 2018
Cultural GDP (Left scale) Ratio of Cultural GDP (Right scale)
13
2. Estimation of Cultural Employment
2-1. Methodology
SNA estimates employee income by industry from the value of domestic production by industry. Using this estimate, the number of employments for each cultural industry (cultural domain) can be estimated. In this survey, we estimated the number of employees by domain, using this as cultural employment.
Number of employees in industry A
Production value of industry ANumber of employees in industry
Statistically, workers and employers are not synonymous (employee = self-employed + family employee + employer), but here the culture "employment" is used for convenience. Also, the "employment coefficient" is the reciprocal of labor productivity, and the smaller the employment coefficient, the higher the production volume per worker.
2-2. Estimated result(2018)
Cultural employment in 2018 is estimated to be 1,226 thousand. This is equivalent to 1.8% of the total number of jobs in Japan. (Cultural GDP is 1.9%) The design/creative services sector accounts for about 48%
of the total employment. This is followed by 20% in the books/press department and 18% in the audio- visual/interactive media department. These three divisions account for 86% of the total. As for GDP per capita, the average for the whole culture is higher than the average for the whole country. However, only two domains, audio-visual/interactive media and design/creative services, are above the national average.
The transition of cultural employment from 2016 to 2018 is 1.2 million, 1.7-1.8%, which is a minimal change. Cultural employment grew at 4.2% for two years. The total employee growth rate in Japan during the same period was 2.8%.
= Employment Coefficient
14
[Table 2-2 Cultural Employment (2018)]
Domain
Production Value
100 million JPY
VA (GDP) 100 million JPY
Employment Thousands of people
Cultural/Natural Heritage 3,548 1,346 34
Performance/Celebration 12,430 6,287 80
Visual Arts/Crafts 4,546 2,751 73
Books/Press 35,978 16,768 239
Audio-visual/Interactive media 73,669 26,887 217
Design/Creative service 129,376 51,346 583
Total 259,546 105,385 1,226
National Total 10,494,453 5,561,896 68,006
Ratio of National Total 2.47 1.89 1.80
[Table 2-3 Transitions in Cultural Employment (2016-2018)]
2016 2017 2018
Number of Persons Employed 1,177 1,176 1,226
Ratio of National Total 1.78% 1.76% 1.80%
(Unit: thousands of people)
15
3. Cultural GDP by domain
3-1 Cultural/Natural Heritage
Estimations(2018)
Production Value
3,548
VA
1,346
[Table 2-4 Domestic product and VA of cultural/natural heritage (2018)]
Production Value VA
(1) National museums 302 126
(2) Public museums 1,703 657
(3) Private museums 788 340
Subtotal 2,793 1,122
(4) Cultural property protection 722 206
(5) Natural heritage protection 33 18
Total 3,548 1,346
Annual Transitions
[Table 2-5 Annual transitions in cultural/natural heritage (2016-2018)]
Domain/Classification 2016 2017 2018
Museums Production Value 2,788 2,871 2,793
VA 1,207 1,207 1,122
Cultural property protection
Production Value 725 737 722
VA 197 203 206
Natural heritage protection
Production Value 35 36 33
VA 21 20 18
Total Production Value 3,548 3,644 3,548
VA 1,425 1,430 1,346
[Notes on the following description]
*1 Since the figures in each table are rounded off, the total and the breakdown may not match.
*2 For the estimation of cultural GDP, we used a table (extended input-output table integrated table) that integrated the transaction amount table (506 x 386 sector table) of the 2016 extended input- output table into 187 sectors related to cultural industry.
(100 million JPY)
(100 million JPY)
(100 million JPY)
16 3-2 Performance/Celebration
Estimations(2018)
Domestic Product
12,430
VA
6,287
[Table 2-6 Domestic product and VA of performance/celebration (2018)]
Production Value VA
(1) Entertainment facilities (except movie theaters)・Troupe
7,533 4,479
(2) Manufacture of musical instruments 856 433
(3) Music software (CD’s etc.) (Production value)
1,576 624
(4) Paid music distribution 612 150
(5) Music software production
(excluding CD’s and other sales revenue)
639 253
(6) Music CD rental 268 171
Subtotal 11,483 6,109
(7) National theater (6 theaters) 129 40
(8) Public theater, music hall etc. 818 138
Subtotal 947 178
Total 12,430 6,287
Annual Transitions
[Table 2-7 Transitions in Performance/Celebration (2016-2018)]
Domain/Classification 2016 2017 2018
Performance Production Value 10,350 10,673 11,483
VA 5,407 5,617 6,109
Theater and Music Hall
Production Value 964 966 947
VA 178 175 178
Total Production Value 11,314 11,639 12,430
VA 5,585 5,793 6,287
(100 million JPY)
(100 million JPY)
(100 million JPY)
17 3-3 Visual arts/ Crafts
Estimations(2018)
Domestic Product
4,546
VA
2,751
[Table 2-8 Domestic product and VA of visual arts/crafts (2018)]
Production Value VA
(1) Purchased from artists (art・craft・calligraphy) 205 142
(2) Art goods (posters, etc.) 115 54
Subtotal 320 196
(3) Purchased from artists (photo) 6 4
(4) Photography 2,673 1,916
Subtotal 2,679 1,920
(5) Crafts 1,546 635
Subtotal 1,546 635
Total 4,546 2,751
Annual Transitions
[Table 2-9 Transitions in visual arts/crafts (2016-2018)]
Domain/Classification 2016 2017 2018
Art Production Value 311 331 320
VA 194 216 196
Photography Production Value 3,514 3,300 2,679
VA 2,519 2,365 1,920
Crafts Production Value 1,550 1,529 1,546
VA 631 627 635
Total Production Value 5,375 5,160 4,546
VA 3,344 3,208 2,751
(100 million JPY)
(100 million JPY)
(100 million JPY)
18 3-4 Books/Press
Estimations(2018)
Domestic Product
35,978
VA
16,768
[Table 2-10 Domestic product and VA of books/press (2018)]
Production Value VA
(1) Books 7,312 2,993
(2) Magazines 8,088 3,310
(3) Book and magazine retailing 2,320 1,522
Subtotal 17,720 7,825
(4) Newspaper 10,968 4,780
(5) Newspaper retail 4,323 2,836
(6) News agency service 712 282
Subtotal 16,003 7,898
(7) National Diet Library 153 94
(8) Public Library 2,102 951
Subtotal 2,255 1,045
Total 35,978 16,768
(100 million JPY)
(100 million JPY)
19
Annual Transitions
[Table 2-11 Transitions in books/press (2016-2018)]
Domain/Classification 2016 2017 2018
(1) Books
Production Value 7,628 7,442 7,312
VA 3,122 3,046 2,993
(2) Magazines
Production Value 8,990 8,473 8,088
VA 3,680 3,468 3,310
(3) Book and magazine retailing
Production Value 2,361 2,199 2,320
VA 1,549 1,443 1,522
(4) Newspaper Production Value 11,958 11,677 10,968
VA 5,211 5,088 4,780
(5) Newspaper retail
Production Value 4,438 4,309 4,323
VA 2,911 2,827 2,836
(6) News agency service
Production Value 244 228 712
VA 97 90 282
(7) National Diet Library
Production Value 155 152 153
VA 94 93 94
(8) Public Library
Production Value 2,053 2,068 2,102
VA 957 947 951
Total Production Value 37,827 36,548 35,978
VA 17,620 17,002 16,768
(100 million JPY)
20 3-5 Audio-visual/Interactive media
Estimations(2018)
Domestic Product
73,669
VA
26,887
[Table 2-12 Domestic product and VA of audio-visual/interactive media (2018)]
Production Value VA
(1) Movie production and distribution 2,561 1,014
(2) Movie box office revenue 2,225 638
Subtotal 4,786 1,652
(3) NHK Viewing fee income 7,106 3,354
(4) Commercial terrestrial TV
broadcasting 19,298 6,462
(5) Satellite broadcaster revenue 3,448 1,155
(6) Cable TV broadcaster revenue 5,020 2,555
(7) Radio broadcasting revenue 1,234 413
(8) Community broadcasting revenue 140 47
(9) Satellite general broadcasting audio
broadcasting 190 64
(10) TV program production and
distribution 8,373 3,314
(11) Radio program production revenue 98 39
Subtotal 44,909 17,402
(12) Video (DVD) production・sales 2,067 818
(13) Motion picture distribution revenue 2,200 540
(14) Post-production 484 192
Subtotal 4,751 1,549
(15) Game software sales 1,970 1,127
(16) Online game operation sales 14,701 3,606
(17) Distribution sales for feature phone 61 15
(18) Arcade, TV and music game 866 496
Subtotal 17,598 5,244
(19) Video (DVD・BR) rental 1,624 1,039
Total 73,669 26,887
(100 million JPY)
(100 million JPY)
21
Annual Transitions
[Table 2-13 Transitions in audio-visual/interactive media (2016-2018)]
Domain/Classification 2016 2017 2018
Movie Production Value 5,003 4,908 4,786
VA 1,723 1,693 1,652
Broadcasting Production Value 43,699 43,172 44,909
VA 16,879 16,683 17,402
Audio-visual Production Value 4,125 4,774 4,751
VA 1,387 1,611 1,549
Games Production Value 15,596 17,326 17,598
VA 4,767 5,223 5,244
Video rental Production Value 1,461 1,507 1,624
VA 935 964 1,039
Total Production Value 69,884 71,686 73,669
VA 25,691 26,175 26,887
(100 million JPY)
22 3-6 Design/Creative services
Estimations(2018)
Domestic Product
129,376
VA
51,346
[Table 2-14 Domestic product and VA of design/creative services (2018)]
Production Value VA
(1) Design 4,403 3,028
(2) Architectural services (include landscape design) 32,713 22,816
(3) Advertising services 92,260 25,502
Total 129,376 51,346
Annual Transitions
[Table 2-15 Transitions in design/creative services (2016-2018)]
Domain/Classification 2016 2017 2018
Design Production Value 5,209 5,375 4,403
VA 3,582 3,697 3,028
Architectural services (includes landscape design)
Production Value 25,203 26,143 32,713
VA 17,578 18,234 22,816
Advertising services Production Value 95,637 93,267 92,260
VA 26,436 25,780 25,502
Total Production Value 126,049 124,785 129,376
VA 47,596 47,711 51,346
(100 million JPY)
(100 million JPY)
(100 million JPY)
23
Chapter 3 Economic Ripple Effect of Culture
1.Concept and Methodology
The idea of the CSA is the structure of "what is a cultural product, where it is produced, and how much value (added value) is produced there". On the other hand, the economic spillover effect is based on the idea of "what kind of production is triggered by the demand for new cultural products". In addition, CSA is an approach from the production side, while the economic spillover is approached from expenditure (final demand). To simplify, CSA seeks to view the composition of cultural activities and phenomena through cultural products. The economic spillover broadens the ecosystem to include the spillover. If the content (composition) of culture is accurately grasped by CSA and the ecosystem (relationship) of a wider culture is grasped based on it, the horizons will be broadened and an expanded way of thinking about cultural policy will be achieved. Even in TSA, there are two parts, a satellite account part and a spillover part. In terms of culture, if the spillover effect part is constructed as CSA is constructed, it is thought that the basis for quantitative evaluation of the economic and social impact of the cultural arts will be further enriched.
2. Estimations(2018)
2-1 Cultural facility admission fee (related to cultural/natural heritage)
Estimation of domestic demand
[Table 3-1 Estimation of domestic demand for cultural facility admission fee]
Industrial classification c. Final consumption
(100 billion JPY) d. Self-sufficiency rate Domestic demand (100 billion JPY) (c×d)
Social Education (Non-profit) 1,154 1.00000 1,154
24
Estimations of the Ripple Effect
[Table 3-2 Estimation of ripple effect from cultural facility admission fees]
(Unit: 100 million JPY, thousands of people)
Production induced value
VA (excludes non-
household consumption)
Compensation of employees
Employment inducement effect
(in thousands)
Direct effect (a) 1,154 625 484 11
The first indirect effect 801 395 186 5
The second indirect effect 670 390 160 5
Total effect (b) 2,625 1,410 829 21
Effect magnification 2.3 2.3 1.7 1.9
2-2 Theater (related to performance/celebration)
Estimations of Domestic Demand
[Table 3-3 Estimations of the domestic demand for theater]
Industrial classification c. Final consumption
(100 billion JPY) d. Self-sufficiency rate Domestic demand (100 billion JPY) (c×d)
Entertainment 1,882 0.91628 1,724
Estimations of the ripple effect
[Table 3-4 Estimations of the ripple effect of theater]
(Unit: 100 million JPY, thousands of people)
Production induced value
VA (excludes non-
household consumption)
Compensation of employees
Employment inducement effect
(in thousands)
Direct effect(a) 1,724 1,025 553 11
The first indirect effect 908 499 253 6
The second indirect effect 807 470 192 6
Total effect(b) 3,439 1,994 998 24
Effect magnification 2.0 1.9 1.8 2.2
25 2-3 Concerts (related to performance/celebration)
Estimations of Domestic Demand
[Table 3-5 Estimation of domestic demand for concerts]
Industrial classification c. Final consumption
(100 billion JPY) d. Self-sufficiency rate Domestic demand (100 billion JPY) (c×d)
Entertainment 5,498 0.91628 5,038
Estimations of the Ripple Effect
[Table 3-6 Estimations of the Ripple Effect of Concerts]
(Unit: 100 million JPY, thousands of people)
Production induced value
VA (excludes non-
household consumption)
Compensation of employees
Employment inducement effect
(in thousands)
Direct effect(a) 5,038 2,995 1,616 33
The first indirect effect 2,653 1,459 740 19
The second indirect effect 2,357 1,372 562 18
Total effect(b) 10,048 5,826 2,917 69
Effect magnification 2.0 1.9 1.8 2.1
2-4 Art exhibition (related to visual arts/crafts)
Estimation of domestic demand
[Table 3-7 Estimation of domestic demand for concert]
Industrial classification c. Final consumption
(100 billion JPY) d. Self-sufficiency rate Domestic demand (100 billion JPY) (c×d)
Social Education (Non-profit) 1,098 1.00000 1,098
26
Estimation of ripple effect
[Table 3-8 Estimation of ripple effect of art exhibition]
(Unit: 100 million JPY, thousands of people)
Production induced value
VA (excludes non-
household consumption)
Compensation of employees
Employment inducement effect
(in thousands)
Direct effect(a) 1,098 595 460 11
The first indirect effect 763 376 177 5
The second indirect effect 638 371 152 5
Total effect(b) 2,499 1,342 789 20
Effect magnification 2.3 2.3 1.7 1.8
2-5 Book and Magazine (related to books/press)
Estimation of domestic demand
[Table 3-9 Estimation of domestic demand for book and magazine]
Industrial classification c. Final consumption
(100 billion JPY) d. Self-sufficiency rate Domestic demand (100 billion JPY) (c×d)
Publish 4,553 0.97720 4,449
Whole sails 207 0.99695 207
Retail sails 1,121 1.00000 1,121
Rail freight transport 3 1.00000 3
Road freight transport 193 0.99981 193
Air freight transport 1 0.72507 1
Freight transportation 16 1.00000 16
Warehouse 48 1.00000 48
Total 6,141 6,037
27
Estimation of ripple effect
[Table 3-10 Estimation of ripple effect of book and magazine]
(Unit: 100 million JPY, thousands of people)
Production induced value
VA (excludes non-household
consumption)
Compensation of employees
Employment inducement effect
(in thousands)
Direct effect(a) 6,037 2,886 1,773 43
The first indirect effect 5,060 2,492 1,240 29
The second indirect effect 3,014 1,755 718 23
Total effect(b) 14,111 7,133 3,731 95
Effect magnification 2.3 2.5 2.1 2.2
2-6 Newspaper (related to books/press)
Estimation of domestic demand
[Table 3-11 Estimation of domestic demand for newspaper]
Industrial classification c. Final consumption
(100 billion JPY) d. Self-sufficiency rate Domestic demand (100 billion JPY) (c×d)
Newspaper 9,215 0.99862 9,202
Retail sails 4,945 1.00000 4,945
Rail freight transport 1 1.00000 1
Road freight transport 515 0.99981 515
Air freight transport 0.5 0.72507 0.4
Freight transportation 33 1.00000 33
Total 14,709 14,696
28
Estimation of ripple effect
[Table 3-12 Estimation of ripple effect of newspaper]
(Unit: 100 million JPY, thousands of people)
Production induced value
VA (excludes non-
household consumption)
Compensation of employees
Employment inducement effect
(in thousands)
Direct effect(a) 14,696 7,662 5,005 119
The first indirect effect 10,732 5,240 2,551 61
The second indirect effect 7,559 4,401 1,801 57
Total effect(b) 32,987 17,304 9,357 237
Effect magnification 2.2 2.3 1.9 2.0
2-7 Movie (related to audio-visual/interactive media)
Estimation of domestic demand
[Table 3-13 Estimation of domestic demand for movie]
Industrial classification c. Final consumption
(100 billion JPY) d. Self-sufficiency rate Domestic demand (100 billion JPY) (c×d)
Movie theater 2,924 0.84660 2,476
Estimations of the ripple effect
[Table 3-14 Estimations of the ripple effect of movies]
(Unit: 100 million JPY, thousands of people)
Production induced value
VA (excludes non-
household consumption)
Compensation of employees
Employment inducement effect
(in thousands)
Direct effect(a) 2,476 710 424 23
The first indirect effect 2,823 1,329 642 15
The second indirect effect 1,067 621 254 8
Total effect(b) 6,366 2,661 1,321 46
Effect magnification 2.6 3.7 3.1 2.0
29
Chapter 4 CSA of Other Countries
1. USA
In 2012, the Bureau of Economic Analysis (BEA) of the Department of Commerce and the National Arts Fund (NEA) partnered to create a CSA framework. Based on that framework, they report their annual estimations. The name of the US CSA is Arts and Cultural Production Satellite Account (ACPSA).
The US CSA is estimated based on the National Accounts and Product Accounts (NIPAs) and extensive economic census. The domain framework is based on the North American Industry Classification System (NAICS). For employment, Occupation Employment Statistics (OES) is used. It is also made with reference to UNESCO's FCS2009 and other countries.
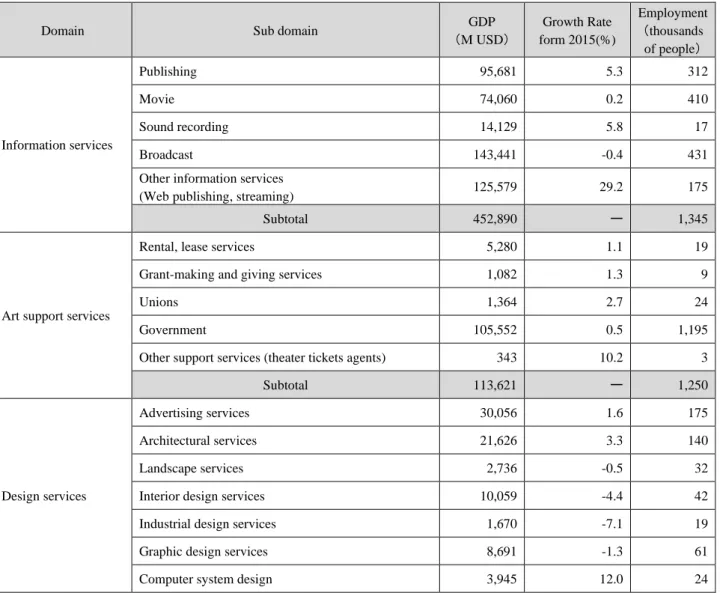
Cultural GDP is $ 877.8 billion (2017), which is 4.5% of total GDP. The GDP and the number of employees by domain are as follows.
[Table 4-1 Cultural GDP and employment of USA (2017)]
Domain Sub domain GDP
(M USD)
Growth Rate form 2015(%)
Employment
(thousands of people)
Information services
Publishing 95,681 5.3 312
Movie 74,060 0.2 410
Sound recording 14,129 5.8 17
Broadcast 143,441 -0.4 431
Other information services
(Web publishing, streaming) 125,579 29.2 175
Subtotal 452,890 ー 1,345
Art support services
Rental, lease services 5,280 1.1 19
Grant-making and giving services 1,082 1.3 9
Unions 1,364 2.7 24
Government 105,552 0.5 1,195
Other support services (theater tickets agents) 343 10.2 3
Subtotal 113,621 ー 1,250
Design services
Advertising services 30,056 1.6 175
Architectural services 21,626 3.3 140
Landscape services 2,736 -0.5 32
Interior design services 10,059 -4.4 42
Industrial design services 1,670 -7.1 19
Graphic design services 8,691 -1.3 61
Computer system design 3,945 12.0 24
30
Domain Sub domain GDP
(M USD)
Growth Rate form 2015(%)
Employment
(thousands of people)
Photography, Photo treatment services 8,444 -0.8 66
Other design services 1,048 -5.6 9
Subtotal 88,275 ー 568
Performing Arts
Performing arts companies 13,957 1.0 122
Performing arts presenters 15,288 5.5 112
Agents and managers 5,139 4.1 15
Independent artists, writers, and performers 38,255 -0.4 51
Subtotal 72,639 ー 300
Arts retail trade 40,800 4.3 600
Wholesale and transportation industries 36,560 0.8 207
All other industries 22,104 0.6 163
Manufacturing
Jewelry and silverware manufacturing 3,078 4.1 23
Printed goods manufacturing 6,491 -2.7 73
Musical instrument manufacturing 758 0.3 10
custom architectural woodwork or an engineering
firm offering industrial design services 3,091 1.4 39
Other manufacturing 3,048 1.2 28
Subtotal 16,466 ー 173
Construction 16,357 7.5 128
Museums 7,876 2.5 149
Education services 7,538 0.3 99
Fine arts education 2,633 -0.3 126
Total 877,759 4.5 5,108
(Source:NEA (2020))