Transcranial magnetic stimulation over the
cerebellum induces long latency motor response
during visually guided manual tracking task
著者
松木 明好
内容記述
学位記番号:論保第7号, 指導教員:平岡浩一
博士学位論文
Transcranial magnetic stimulation over the
cerebellum induces long latency motor response
during visually guided manual tracking task
大阪府立大学大学院
総合リハビリテーション学研究科
博士後期課程
Contents
Abstract ・・・・・・・・・・・・・・・・・・・・・・・・・・・・・・1 Overview
Ⅰ. Transcranial magnetic stimulation over the cerebellum ・・・・3 Ⅱ. Role of the cerebellum during visually guided manual tracking ・4 Ⅲ. The first experiment ・・・・・・・・・・・・・・・・・・・・・5 Ⅳ. The second experiment ・・・・・・・・・・・・・・・・・・・・・6 Ⅴ. Conclusion ・・・・・・・・・・・・・・・・・・・・・・・・・・7 Chapter1: Long latency fluctuation of finger movement preferentially induced by cerebellar TMS during visually guided manual tracking
Ⅰ. Introduction ・・・・・・・・・・・・・・・・・・・・・・・・・8 Ⅱ. Methods
1. Subjects and apparatus ・・・・・・・・・・・・・・・・・・10 2. Tracking a moving target ・・・・・・・・・・・・・・・・・10 3. TMS ・・・・・・・・・・・・・・・・・・・・・・・・・・・・11 4. Procedure ・・・・・・・・・・・・・・・・・・・・・・・・11 5. Data analysis ・・・・・・・・・・・・・・・・・・・・・・12 Ⅲ. Results
1. Active motor threshold of cerebellar TMS ・・・・・・・・・14 2. Long latency fluctuation of finger movement ・・・・・・・・14 3. Long latency EMG response after TMS ・・・・・・・・・・・・15 4. Background EMG amplitudes ・・・・・・・・・・・・・・・・・15 5. RMS error ・・・・・・・・・・・・・・・・・・・・・・・・・16 Ⅳ. Discussion
1. Methodological consideration ・・・・・・・・・・・・・・・22 2. Fluctuation of finger movement ・・・・・・・・・・・・・・23 3. Tracking error and finger fluctuation ・・・・・・・・・・・24 4. Site specificity of cerebellar TMS ・・・・・・・・・・・・24
Ⅴ. Summary ・・・・・・・・・・・・・・・・・・・・・・・・・・・・26 Chapter 2: Long latency EMG response is preferentially induced by cerebellar TMS during continuous visually guided manual tracking
Ⅰ. Introduction ・・・・・・・・・・・・・・・・・・・・・・・・27 Ⅱ. Methods 1. Subjects ・・・・・・・・・・・・・・・・・・・・・・・・・29 2. Apparatus ・・・・・・・・・・・・・・・・・・・・・・・・・29 3. Motor task ・・・・・・・・・・・・・・・・・・・・・・・・30 1) Continuous tracking (CT) ・・・・・・・・・・・・・・・・30 2) Discrete tracking (DT) ・・・・・・・・・・・・・・・・30 3) Phasic contraction (PC) ・・・・・・・・・・・・・・・・30 4) Tonic contraction (TC) ・・・・・・・・・・・・・・・・31 4. Magnetic stimulation (MS) ・・・・・・・・・・・・・・・・31 5. Data analysis ・・・・・・・・・・・・・・・・・・・・・・32 Ⅲ. Results 1. MS condition ・・・・・・・・・・・・・・・・・・・・・・・36 2. Neck twitch ・・・・・・・・・・・・・・・・・・・・・・・36 3. Response during CT ・・・・・・・・・・・・・・・・・・・・36 4. Response during DT ・・・・・・・・・・・・・・・・・・・・37 5. Response during PC ・・・・・・・・・・・・・・・・・・・・38 6. Response during TC ・・・・・・・・・・・・・・・・・・・・39 Ⅳ. Discussion 1. Methodological consideration ・・・・・・・・・・・・・・・45 2. Fluctuation of index finger movement ・・・・・・・・・・・46 3. Possible pathway of Long latency EMG response ・・・・・・・47 4. Long latency EMG response ・・・・・・・・・・・・・・・・・48 Ⅴ. Summary ・・・・・・・・・・・・・・・・・・・・・・・・・・・50 References ・・・・・・・・・・・・・・・・・・・・・・・・・・・・51 Acknowledgement ・・・・・・・・・・・・・・・・・・・・・・・・・・57
- 1 - Abstract 視 覚 標 的 追 従 課 題 中 の 小 脳 へ の 経 頭 蓋 磁 気 刺 激 (Transcranial magnetic stimulation:TMS)で誘発される長潜時指運動変動の出現確率は、不動標的に指 を固定する課題中の小脳 TMS で誘発される指運動変動出現確率より有意に高か った(Hiraoka et al. 2010)。視覚標的追従課題では目と手の協調が必要である ことから、小脳 TMS で誘発される長潜時運動反応は、目と手の協調に関連する 小脳活動を反映している可能性が示唆された。目と手の協調には、操作手と同 側の小脳半球が関与している(Vercher et al. 1998)。小脳 TMS で誘発される 長潜時運動反応が目と手の協調に関連する小脳活動を反映しているならば、視 覚標的追従課題中の操作手と同側の小脳への TMS で特異的に長潜時運動反応が 誘発されると考えられる。第一研究ではこの仮説を検証した。被験者をオシロ スコープの前に座らせ、右前腕を固定し示指を伸展させ、柔軟に曲がるプレー トに指先を当てさせた。指を屈伸するとプレートの変位を介して、オシロスコ ープ上のラインが上下に動くようにした。このラインを指変位ラインと呼ぶ。 同じ画面上に、0.2Hz で正弦波 Y 軸変動する標的ラインを提示し、指変位ライン で追従させた。また、示指 MP 関節の屈曲主動作筋である第一背側骨間筋(first dorsal interosseous:FDI)から筋電図(electromyography:EMG)を記録した。こ の視覚標的追従課題中に、左、中央、右の小脳と Pz に TMS、および sham TMS を 行い、指運動変動出現確率を比較した。小脳 TMS 条件の指運動変動の onset 潜 時は約 100ms、EMG 反応の onset 潜時は約 60ms であった。左、中央、右の小脳 TMS 条件の指運動変動出現確率は、Pz 条件、sham TMS 条件より有意に高かった が、小脳 TMS 条件間に有意な差はなかった。以上より、視覚標的追従課題中の 長潜時指運動変動は小脳 TMS で特異的に誘発される可能性が示唆された。 小脳 TMS で誘発される長潜時運動反応が、視覚標的追従課題に関連する小脳 活動を反映しているならば、課題によってその出現確率は異なると考えられる。 よって、第二研究では、小脳 TMS で誘発される長潜時運動反応が視覚標的追従 課題で特異的に誘発されるかを検証した。また、小脳への反復 TMS による皮質 脊髄下降路興奮性の変化は、頚部への反復磁気刺激(magnetic stimulation:MS)
- 2 - でも生じる(Gerschlager et al. 2002)。小脳 TMS と頚部 MS では同様に頚部運 動が生じることから、この皮質脊髄下降路興奮性変化は頚部運動に由来してい る可能性を否定できない。つまり、小脳 TMS で誘発される長潜時運動反応も頚 部運動に由来している可能性がある。第二研究では、小脳 TMS で誘発される長 潜時運動反応が頚部運動に由来するかについても検証した。0.2Hz で正弦波 Y 軸 変動する標的ラインを追従し続ける課題(continuous tracking:CT)、非連続的 に 1 周期分提示される標的ラインを追従する課題、標的ラインと指変位ライン を提示せずに指屈曲を一回だけ行う課題、指を動かさずに FDI の収縮を行う課 題を行わせた。各課題中、小脳 TMS、頚部 MS、および sham TMS を行い、指運動 変動、EMG 反応の出現確率を比較した。指運動変動出現確率は、いずれの課題に おいても小脳 TMS 条件、頚部 MS 条件が sham TMS 条件より有意に高かったが、 小脳 TMS 条件と頚部 MS 条件間に有意差はなかった。長潜時 EMG 反応出現確率は、 CT において、小脳 TMS 条件が頚部 MS 条件、sham TMS 条件より有意に高かった が、頚部 MS 条件と sham TMS 条件間に有意な差はなかった。他の課題において は、いずれの刺激条件間にも有意な差はなかった。以上より、小脳 TMS によっ て誘発される長潜時指運動変動は、課題特異的な小脳活動を反映しない可能性 が示唆された。また、長潜時指運動変動は頚部運動に由来している可能性は否 定できなかった。他方、長潜時 EMG 反応出現確率は、CT では小脳 TMS が頚部 MS、 sham TMS より有意に高かったが、他の運動課題では刺激条件間に有意差はなか った。CT ではリズミカルな指運動を行うための時間的制御が必要となる。つま り、長潜時 EMG 反応はリズミカルな指運動における時間的制御に関連する小脳 活動を反映している可能性が示唆された。 以上より、小脳 TMS で誘発される長潜時指運動変動は、局所的、課題特異的 な小脳活動を反映しないが、長潜時 EMG 反応は課題特異的な小脳活動を反映す る可能性があると結論する。 キーワード:小脳、経頭蓋磁気刺激、長潜時反応、追跡課題
Key words: Cerebellum, Transcranial magnetic stimulation, Long latency response, Tracking task
- 3 -
Overview
Ⅰ. Transcranial magnetic stimulation over the cerebellum
Transcranial magnetic stimulation (TMS) over the cerebellum 5-8 ms before TMS over the contralateral motor cortex reduces the amplitude of motor evoked potential (MEP) in the first dorsal interosseous (FDI) muscle1,2,3. Furthermore, cerebellar TMS (C-TMS) immediately modulates short
interval intracortical inhibition in the motor cortex4. The inhibitory
effect was absent in patient with a lesion in the cerebellum5 or in the
thalamus6. These findings indicate that C-TMS induce the short latency
inhibitory effect on the corticospinal excitability via the cerebello-thalamo-cortical pathway.
C-TMS not only induces the short latency inhibitory effect but also induces a long latency motor response. C-TMS induced electromyographic (EMG) response at the latency of approximately 100 ms in bilateral soleus in standing human7 and the latency was shorted by optokinetic stimulation
to activate vestibulospinal tract8. These findings indicate that C-TMS
induce long latency motor response in the soleus muscle via vestibulospinal tract. Long latency motor response is induced by C-TMS not only in the soleus muscle but also in the hand. TMS over the right cerebellum induces fluctuation of right index finger movement with the latency of approximately 100 ms and the EMG response in the FDI muscle with the latency of approximately 65 ms during tracking a target moving up and down rhythmically with the right index finger movement9. The probability of
fluctuation induced by C-TMS during the visually guided manual tracking task was significantly higher than that induced by C-TMS during keeping a line moved by the index finger on the stationary target line. Thus, the difference in the probability of fluctuation may reflect the difference
- 4 -
in the cerebellar activity associated with visually guided manual tracking task. Visual feedback control, eye-hand coordination and temporal control could be required during visually guided manual tracking task. Therefore, long latency motor response induced by C-TMS may be associated with the cerebellar activity of visual feedback control, eye-hand coordination or temporal control.
Ⅱ. Role of the cerebellum during visually guided manual tracking The cerebellar hemisphere plays an important role of visual feedback control, eye-hand coordination and temporal control during visually guided manual tracking. Cerebellar activity increases during the pointing task in which visual feedback control is indispensable10 and during visually
guided manual tracking task in which eye-hand coordination is indispensable11-13. Eye-hand coordination was impaired in the patient with
cerebellar lesion14,15. Lesion of a dentate nucleus in the cerebellum
impaired the performance of visually guided manual tracking in baboon16.
Purkinje cells in the lateral cerebellum were activated during visually guided reaching task in cats17. Furthermore, the movement time in the
eye-hand coordination task was increased by repetitive TMS (rTMS) over the cerebellum18. These findings indicate that the cerebellum plays a role in
visual feedback control and eye-hand coordination during visually guided manual tracking task.
The cerebellum plays an important role not only in visual feedback control or eye-hand coordination but also in temporal control. Cerebellar activity increased when subjects performed finger tapping according with rhythmic metronome tones19. rTMS over the cerebellum increased variability
of the intertap interval of finger tapping according with externally paced rhythmic auditory cues20. These findings suggest that the cerebellum plays
an important role on temporal control of rhythmic finger movement. Based on these findings, I established a hypothesis that long latency motor
- 5 -
response induced by C-TMS preferentially appears when visual feedback control, eye-hand coordination or temporal control is required, if long latency motor response induced by C-TMS reflects the local cerebellar activity of these motor control.
Ⅲ. The first experiment
Visually guided manual tracking is impaired after ipsilateral dentate nucleus lesions in baboons16, indicating that the cerebellum ipsilateral
to the tested hand contributes to visually guided manual tracking. If long latency motor response induced by TMS over the cerebellum is related to the local cerebellar activity of visually guided manual tracking, long latency motor response must be preferentially induced by TMS over the right cerebellum during visually guided manual tracking. In the first experiment, I investigated whether long latency fluctuation of finger movement is preferentially induced by TMS over the right cerebellum during visually guided manual tracking. TMS was delivered to the left, middle or right cerebellum or Pz when the subjects tracked the moving target with right index finger movement. The probability of fluctuation of finger movement induced by TMS over the cerebellum was significantly higher than that induced by TMS over the Pz or sham TMS, but there was no significant difference in the probability of fluctuation among the stimulation conditions. The latency of fluctuation of index finger movement and EMG response induced by TMS over the cerebellum were approximately 100 ms and 65 ms respectively. These findings indicate that long latency fluctuation during visually guided manual tracking task is induced by TMS specifically over the cerebellum, but is not preferentially induced by a specific site of the cerebellum.
- 6 -
Ⅳ. The second experiment
I investigated whether the appearance of long latency motor response depend on the task in the second experiment. If long latency motor response associates with the cerebellar activity of visual feedback control, eye-hand coordination or temporal control of finger movement, long latency motor response induced by C-TMS preferentially appear during continuous visually guided manual tracking that is the task in previous study reported by Hiraoka et al.9.
On the other hand, there is a methodological concern about C-TMS. Single pulse21 or repetitive TMS22 over the cerebellum or over the dorsal
neck similarly affect the corticospinal excitability. One possible explanation is that the effect is caused by neck twitch induced by contraction of dorsal neck muscle by TMS over the cerebellum or by over the dorsal neck. Thus, long latency motor response may be originated from neck twitch concomitantly induced by C-TMS.
In the second experiment, TMS was delivered over the right cerebellum (C-TMS) or magnetic stimulation was delivered over the right dorsal neck (N-MS) to evoke neck twitch and sham TMS (S-TMS) was delivered during the four tasks, which were continuous or discrete visually guided manual tracking, and phasic or tonic contraction of the FDI muscle. The probability of fluctuation of index finger movement induced by C-TMS or N-MS was significantly higher than that induced by S-TMS, but there was no significant difference between the probability of EMG response induced by N-MS and that induced by S-TMS during each task. The probability of EMG response induced by C-TMS was significantly higher than that induced by N-MS or S-TMS during continuous tracking (CT) but there was no significant difference of the probability of EMG response between the stimulation conditions during the other tasks. Thus, I can not rule out the possible that the origination of fluctuation of finger movement is concomitantly neck twitch induced by C-TMS, and long latency EMG response can not be
- 7 -
explained by neck twitch. Externally paced rhythmic finger movement based on temporal control was required only during CT, so the cerebellar activity of temporal control of rhythmic finger movement are the possible neural mechanism underlying that long latency EMG response was preferentially induced by C-TMS during CT.
Ⅴ. Summary
Fluctuation of finger movement induced by C-TMS must not reflect the local cerebellar activity and must not represent task-specific response. Further, I can not rule out a possibility that fluctuation is originated from neck twitch evoked by C-TMS. On the other hand, long latency EMG response induced by C-TMS must reflect the cerebellar activity of temporal control of rhythmic finger movement and long latency EMG response must not be originated from neck twitch.
- 8 -
Chapter 1: Long latency fluctuation of finger movement preferentially induced by cerebellar TMS during visually guided manual tracking
Ⅰ. Introduction
Transcranial magnetic stimulation (TMS) over the cerebellum affects the motor system. Conditioning TMS or electrical stimulation over the cerebellum 5-8 ms before TMS over the motor cortex reduces the amplitude of motor evoked potential (MEP) in the first dorsal interosseous (FDI) muscle1,23. Conditioning electrical stimulation over the cerebellum 3 ms
before TMS over the motor cortex increases the size of MEP in the FDI muscle24.
Cerebellar TMS immediately modulates short interval intracortical inhibition in the motor cortex4. Cerebellar TMS during ballistic movement
modulates the triphasic electromyographic (EMG) pattern25,26.
TMS over the cerebellum induces an EMG response in the soleus muscle with a latency of approximately 100 ms in standing7,8. More recently, it has
been reported that cerebellar TMS induces a fluctuation of index finger movement during visually guided manual tracking task9. In this study, the
subjects tracked an oscillatory moving target with their index finger. The trajectory of the finger movement fluctuated 92 ms after cerebellar TMS, and fluctuation was accompanied by an EMG burst in the FDI muscle with an onset of 65 ms after cerebellar TMS. However, several questions remain to be answered about this finding.
First, it remains unclear whether fluctuation is preferentially activated by TMS over any specific site of the cerebellum. Cerebellar TMS did not induce a long latency fluctuation of finger movement during a stationary task, but it did during visually guided manual tracking task9.
This finding implies that fluctuation may be related to visually guided manual tracking. Performance of visually guided manual tracking is impaired
- 9 -
after ipsilateral dentate lesions in baboons16. Purkinje cells in the
lateral cerebellum are activated during visually guided reaching task in cats17. Based on these findings, I hypothesized that a long latency
fluctuation of finger movement during visually guided manual tracking is preferentially induced by TMS over the cerebellum ipsilateral to the operating hand.
Secondary, it remains unclear whether long latency fluctuation of finger movement is induced by TMS preferentially over the cerebellum. Simple reaction times are shortened similarly after TMS delivered over the different sites, such as M1, Cz, or Pz27,28, indicating a general TMS effect
on the motor system no matter which point is stimulated. Accordingly, the TMS-induced long latency fluctuation of finger movement observed in the previous study may be induced by TMS not only over the cerebellum but also over the other stimulus sites. Thus, it must be confirmed whether long latency fluctuation of finger movement induced by cerebellar TMS during visually guided manual tracking appears only when TMS is delivered over the cerebellum. Therefore, I investigated cerebellar TMS-induced long latency fluctuation of finger movement to answer these questions.
- 10 -
Ⅱ. Methods 1. Subjects and apparatus
Ten healthy humans aged between 24 and 36 years were recruited. The subjects did not have orthopedic or neurological histories. The subjects were seated on a height-adjustable chair. The right forearm was placed on a table in a neutral position between pronation and supination. The right forearm and right palm were fixed by metal frames to prevent unwanted motion (Fig. 1.1). The right index finger was extended comfortably, and the fingertip was placed on a flexible plate. The flexible plate was warped with flexion of the metacarpophalangeal joint of the index finger. The degree of warp, expressed as fingertip displacement, was measured via strain gauges attached to the flexible plate. The signals from the strain gauges were amplified via strain amplifier (DPM-712B, Kyowa Dengyo). The fingertip displacement indirectly represented index finger movement. Ag/AgCl surface electrodes were placed on the right FDI muscle 1 cm apart to record EMG signals. The EMG signals were amplified with a pass-band filter of 50 Hz to 3 kHz using an amplifier (MEG-2100, Nihon Kohden). The signals from the strain gauges and EMG signals were converted to digital signals at a sampling rate of 10 kHz and stored in a personal computer. 2. Tracking a moving target
A sinusoidal curve with cycle duration of 5 s was generated using a function generator (FG-273, Kenwood). The y-axis of the sinusoidal curve was displayed on an oscilloscope as a horizontal line (target line). The amplitude of the y-axis of the sinusoidal curve corresponded to approximately 20 mm of the fingertip displacement. On the same oscilloscope, the fingertip displacement was displayed as another horizontal line. The line was at the bottom when the fingertip displacement was 0 (neutral
- 11 -
position), and the line went up with flexion of the index finger (flexion position).
3. TMS
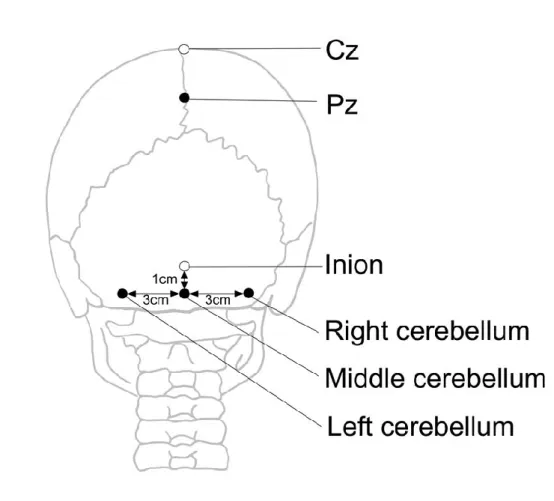
TMS was delivered by a double-cone coil (YM-133B, Nihon Kohden) connected to a magnetic stimulator (SMN-1200, Nihon Kohden). The maximum intensity of the coil was 0.96 T. The center of the junction region of the coil was placed at three sites over the cerebellum; 1 cm below and 3 cm to the right of the inion to stimulate the right cerebellum, 1 cm below and 3 cm to the left of the inion to stimulate the left cerebellum, and 1 cm below the inion to stimulate the middle cerebellum29 (Fig. 1.2). In
addition, Pz was stimulated by TMS as a point other than the sites over the cerebellum28
. The coil was placed to produce downward current in the coil, evoking an upward current in the brain. When delivering sham TMS, the coil was held at a 90-degree angle from the scalp over the back of the head.
The active motor threshold of short latency motor response induced by TMS over the left, middle, and right cerebellum in the FDI muscle were estimated during visually guided manual tracking task. The active motor threshold was defined as the lowest stimulus intensity producing a liminal short latency motor response in five out of ten consecutive stimuli. The intensity of test TMS was 90% of the lowest threshold among the three TMS sites over the cerebellum. If the short latency motor response was not induced by TMS with maximum stimulator output, the TMS intensity was set as 90 % of the maximum stimulator output.
4. Procedure
The subjects gazed at a target line on the oscilloscope and tracked the target line with the index finger. TMS was delivered when the fingertip displacement reached approximately 15 mm during flexion of the index finger
- 12 -
for visually guided manual tracking task. A trigger producing TMS was generated using a trigger generator system (EC-601J, Nihon Kohden). Sites of coil placement were randomly changed between the trials. Thirty trials were conducted for each TMS condition. The interval between the trials was about 10 s.
5. Data analysis
To determine the presence or absence of fluctuation of finger movement, the acceleration of the fingertip displacement was estimated. If the peak-to-peak amplitude of acceleration in the time window between 0 and 300 ms after TMS exceeded 1.5 times that in the time window between 0 and 200 ms before TMS, fluctuation of finger movement was judged to be present. The probability of fluctuation of finger movement was expressed as the number of positive trials divided by the number of whole trials (30 trials). The average EMG amplitude in the time window between 0 and 1000 ms before TMS was defined as the background EMG amplitude.
The onset latency and peak latency of EMG response induced by cerebellar TMS was visually estimated from the average rectified EMG trace from all the trials of all the subjects. The root mean square of tracking error (RMS error) in time window between 0 and 1000 ms before TMS was calculated to quantify the performance level of the tracking task.
One-way ANOVA was conducted to test the different in means among the TMS conditions. Fisher's PLSD test was conducted if the ANOVA revealed statistical significance. Unpaired t-tests were conducted to test the difference in background EMG amplitude between the trials with a fluctuation of finger movement and the trials without fluctuation. The alpha level was 0.05. Data are presented as the mean values and standard error of the mean.
- 13 -
Fig. 1. 1 An illustration of experimental setup.
Fig. 1. 2 An illustration of coil position. Filled circle indicate position of center of double cone coil and open circle indicate reference point for the coil position.
- 14 -
Ⅲ. Results 1. Active motor threshold of cerebellar TMS
The short latency motor response did not appear even at the maximum TMS intensity in 8 subjects in the left cerebellum condition, in 6 subjects in the middle cerebellum condition, and in 7 subjects in the left cerebellum condition. In the subjects who showed the short latency motor response, the active motor threshold of the short latency motor response ranged from 88 to 99 % of the maximum output in the left cerebellum condition, ranged from 83 to 99 % of the maximum output in the middle cerebellum condition, and ranged from 88 to 99 % of the maximum output in the left cerebellum condition. TMS intensity used in the experiment was 87.1 ± 5.2 % of the maximum output. TMS over the cerebellum with this intensity induced neck twitch in all trials, but TMS over the Pz or sham TMS did not induce that in all trials.
2. Long latency fluctuation of finger movement
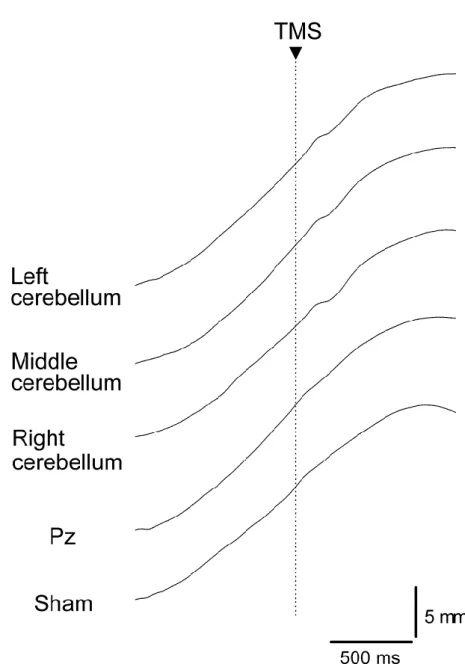
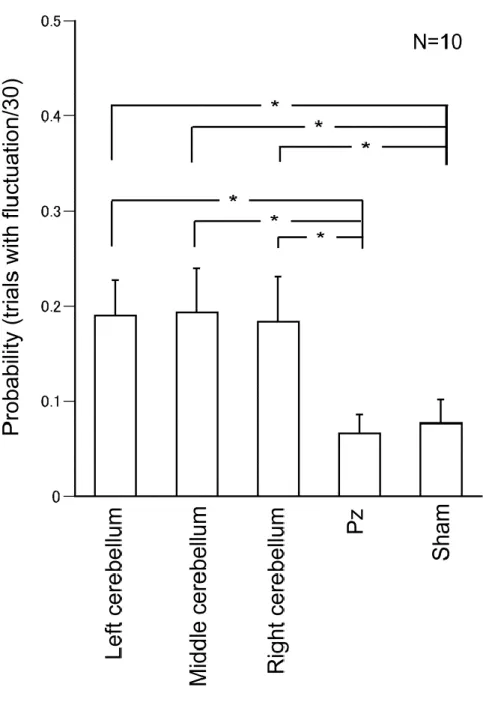
Specimen record of fingertip displacement and FDI-EMG during visually guided manual tracking task is illustrated in Fig. 1. 3. The amplitude of the fingertip displacement was 20.7 ± 0.6 mm. TMS was delivered when the fingertip displacement reached 13.2 ± 0.1 mm. Specimen records of the averaged trajectory of the fingertip displacement are shown in Fig. 1. 4. The probability of fluctuation of finger movement was 19.0 % in the left cerebellum condition, 19.3 % in the middle cerebellum condition, and 18.3 % in the right cerebellum condition (Fig. 1. 5). The probability of fluctuation of finger movement was much less in the non-cerebellar TMS conditions (i.e. 6.7 % in the Pz condition; 7.6 % in the sham condition) as compared to the cerebellar TMS conditions. One-way ANOVA revealed a significant difference in the probability of fluctuation of finger movement
- 15 -
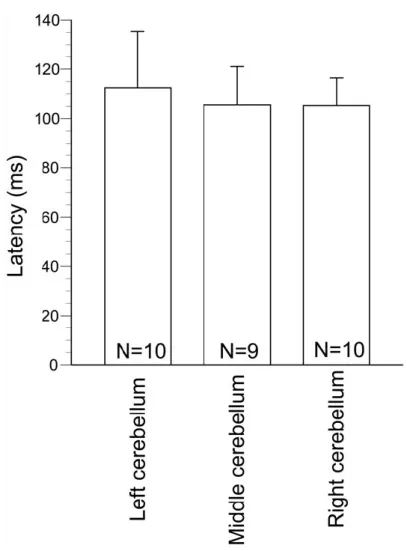
among the TMS conditions (F(4,45)=3.03; P<0.05). A post-hoc test revealed that the probability of fluctuation of finger movement in the cerebellar TMS conditions was significantly higher than that in the non-cerebellar TMS conditions (P<0.05). There was no significant difference in the probability of fluctuation of finger movement among the cerebellar TMS conditions and between the Pz and sham conditions (P>0.05). The latencies of fluctuation of finger movement induced by cerebellar TMS were 112 ± 23 ms in the left cerebellum condition, 106 ± 15 ms in the middle cerebellum condition, and 105 ± 11 ms in the right cerebellum condition, respectively (Fig. 1. 6).
3. Long latency EMG response after TMS
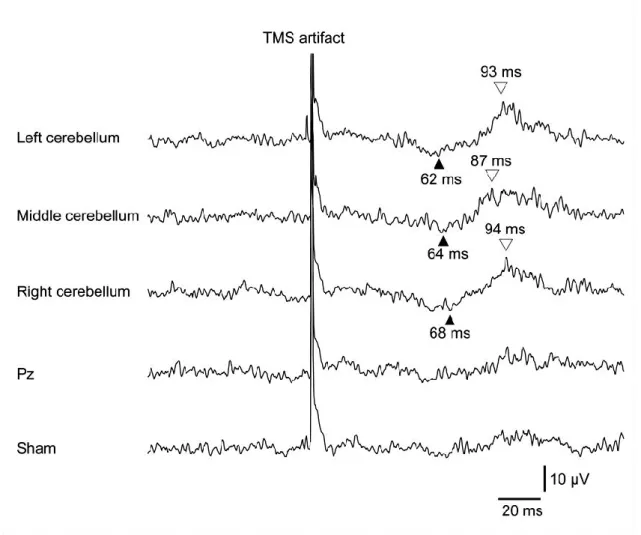
Averaged EMG traces are shown in Fig. 1. 7. An EMG response after TMS was clearly observed in the cerebellar TMS conditions, but not in the Pz and sham conditions. The onset latency of the EMG response ranged from 62 to 68 ms in the cerebellar TMS conditions. The peak latency of the EMG response ranged from 87 to 94 ms in the cerebellar TMS conditions. 4. Background EMG amplitudes
Background EMG amplitudes were 17 ± 1 μV in the right cerebellum condition, 16 ± 1 μV in the middle cerebellum condition, 16 ± 1 μV in the left cerebellum, 16 ± 1 μV in the Pz condition, and 17 ± 1 μV in the sham condition. One-way ANOVA revealed no significant difference in background EMG amplitude among the TMS conditions (F(4,45)=0.01; P=1.00). Background EMG amplitudes averaged for trials with fluctuation ranged from 13 to 15 μV, and that for trials without fluctuation ranged from 16 to 18 μV for the TMS conditions. There was no significant difference in average background EMG amplitudes between the trials with fluctuation and those without fluctuation (P>0.05).
- 16 -
5. RMS errors
RMS errors were 2.0 ± 0.1 mm in the left cerebellum condition, 2.1 ± 0.1 mm in the middle cerebellum condition, 2.1 ± 0.1 mm in the right cerebellum condition, 2.1 ± 0.1 mm in the Pz condition, and 2.2 ± 0.1 mm in the sham condition. One-way ANOVA revealed no significant difference in RMS error among the TMS conditions (F(4,45)=0.23; P=0.92). RMS errors averaged for trials with fluctuation ranged from 1.5 to 2.2 mm, and that for trials without fluctuation ranged from 1.9 to 2.2 mm. There was no significant difference in average RMS errors between the trials with fluctuation and those without fluctuation (P>0.05).
- 17 -
Fig. 1. 3 Specimen record of target, fingertip displacement, tracking error and FDI-EMG during visually guided manual tracking task. At the top of the figure, smooth curves are the target and jaggy curves are the fingertip displacement. Tracking errors indicate the difference between the target and the tracking trajectory.
- 18 -
Fig. 1. 4 Specimen record of the averaged trajectory of the fingertip displacement. A dashed vertical line indicates TMS onset.
- 19 -
Fig. 1. 5 Probability of fluctuation of finger movement averaged for all the subjects. Bars indicate means and error bars indicate standard error. An asterisk indicates statistical significance.
- 20 -
Fig. 1. 6 Latency of fluctuation of finger movement induced by TMS. Bars indicate means and error bars indicate standard error.
- 21 -
Fig. 1. 7 Averaged rectified EMG traces for each condition. On set latency (filled triangles) and peak latencies (open triangles) are shown for the cerebellar TMS conditions.
- 22 -
Ⅳ. Discussion
The aim of this study was to investigate whether the finger movement during visually guided manual tracking task is fluctuated by TMS specifically over the cerebellum and is differently fluctuated by TMS over different sites of the cerebellum. Our data showed the high probabilities of fluctuation of finger movement evoked by cerebellar TMS as comparing to the probability of that induced by TMS over the site other than the cerebellum. However, the probabilities are not significantly different between the TMS sites over the cerebellum.
1. Methodological considerations
An inhibitory conditioning effect of electrical or magnetic stimulation over sites around the inion on MEP in the FDI muscle is present in healthy subjects1, but absent in patients with cerebellar lesions1,5,30,31.
These previous findings indicate that TMS over sites around the inion activate neural pathways in the cerebellum. Cerebellar TMS was delivered in the present study in a similar way as that in these previous studies. Accordingly, cerebellar TMS could have stimulated certain cerebellar structures in this study.
There is a concern as to whether cerebellar TMS induced a motor response by direct stimulation of the brainstem. TMS over the inion or sites around the inion evokes a short latency motor response in the FDI muscle by direct stimulation of the brainstem30,32. In the present study, TMS below
the active motor threshold of a short latency motor response was delivered. Furthermore, no motor responses were found on the averaged EMG trace between 0 and 60 ms after cerebellar TMS. These findings indicate that a short latency motor response was not induced by TMS, and that the motor response induced by cerebellar TMS was not originated from direct stimulation of
- 23 -
the brainstem.
Another concern was that background EMG activity levels may have affected the probability of fluctuation of finger movement. A previous study found no significant difference in the background EMG amplitude between the trials with fluctuation and those without fluctuation during visually guided manual tracking task9. In the present study, the background
EMG amplitude was not significantly different between the trials with fluctuation and trials without fluctuation as consistent with the previous finding and was not significantly different among all the TMS conditions. These findings indicate that background muscle activity level is not a determinant of the probability of fluctuation of finger movement induced by TMS.
The other concern was that cerebellar TMS-induced contraction of the neck muscles may have produced movement artifact affecting finger movement. However, this possibility is not likely, because the right forearm and right palm were fixed by metal frames to prevent unwanted motion. Furthermore, if TMS-induced movement artifact is a cause of fluctuation of finger movement, fluctuation must occur during any of the motor tasks. However, it has been confirmed that fluctuation of finger movement is rarely induced by cerebellar TMS during stationary task9. Fluctuation of finger movement
was preceded by an EMG response in the FDI muscle, indicating that muscle response in the FDI muscle is likely to be the cause of fluctuation of finger movement. Accordingly, fluctuation of finger movement can not be derived from movement artifact induced by cerebellar TMS.
2. Fluctuation of finger movement
The probability of fluctuation of finger movement induced by cerebellar TMS was higher than that induced by the TMS over the Pz or sham TMS. These findings suggest that fluctuation of finger movement during visually guided manual tracking task is not a general effect of TMS but
- 24 -
that is induced by TMS specifically over the cerebellum. The latency of long latency motor response in soleus muscle recorded by Sakihara et al. (100 ms) resembles the latency of long latency motor response observed in the present study. The authors observed that the latency of the motor response was dependent upon optokinetic stimulation, indicating that the vestibulospinal pathway is the neural pathway mediating long latency motor response8. Accordingly, the vestibulospinal tract is a possible pathway
mediating long latency motor response. 3. Tracking error and finger fluctuation
A previous study hypothesized that the cerebellar activity for correcting error of movement may be related to fluctuation of finger movement induced by cerebellar TMS9
. This hypothesis is derived from a previous finding of an inverse correlation between cerebellar activation and motor performance33. In the present study, we tested the hypothesis by
investigating the relationship between the size of the tracking error and the probability of fluctuation of finger movement. There was no significant difference in the size of the tracking error between the trails with fluctuation and without fluctuation under all the TMS conditions, indicating that fluctuation of finger movement induced by cerebellar TMS is not related to the cerebellar activity for correcting error of movement. 4. Site specificity of cerebellar TMS
The probability of fluctuation of finger movement was not significantly different among the cerebellar TMS conditions. This finding was consistent with previous findings on cerebellar TMS-induced motor responses. TMS over the 7 sites of the back and left of the head except the inion similarly induced long latency motor response in the soleus muscle in standing7, and the response was induced by TMS over both the left and
- 25 -
eye-hand coordination task induced by repetitive TMS (rTMS) over the cerebellum was not significantly different between rTMS over the cerebellum ipsilateral to the hand tested and that over the cerebellum contralateral to the hand tested18.
Different sites of the cerebellum take different functional roles34.
Therefore, if long latency fluctuation of finger movement induced by cerebellar TMS had reflected the direct activation of the cerebellum, fluctuation would be dependent on TMS sites over the cerebellum. This contradiction raises a doubt that long latency fluctuation of finger movement may not be derived from direct activation of the cerebellum. Long latency fluctuation of finger movement induced by non-site specific cerebellar TMS is logically explained by a view that long latency fluctuation of finger movement is induced by activity of neural pathways activated by TMS over any site of the cerebellum. Cervical spinal cord can not have been directly activated by cerebellar TMS, because TMS intensity was below the motor threshold of the short latency motor response induced by direct stimulation of the spinal cord. The afferents of the neck muscles can have been activated by cerebellar TMS, because neck twitch was similarly observed in all the cerebellar TMS conditions. A previous study reported that rTMS over the cerebellum and that over the neck similarly facilitated MEP in the hand muscle22, indicating that the some neural pathways are
commonly activated by magnetic stimulation over the cerebellum or the dorsal neck. Accordingly, it is possible that TMS over any site of the cerebellum may have activated neck muscle afferents and this activation may have mediated activation of the neural pathways inducing long latency fluctuation of finger movement.
- 26 -
Ⅴ. Summary
Long latency fluctuation of finger movement during visually guided manual tracking task is induced by TMS specifically over the cerebellum, but is not preferentially induced by a specific site of the cerebellum. Long latency fluctuation of finger movement can be mediated by the neural pathways which are activated by TMS over any site of the cerebellum. Cerebellar TMS induced long latency motor response during visually guided manual tracking task may be useful to investigate the neural pathways activated by TMS over the cerebellum.
- 27 -
Chapter 2: Long latency electromyographic response is preferentially induced by transcranial magnetic stimulation over the cerebellar during continuous visually guided manual tracking
Ⅰ. Introduction
Transcranial magnetic stimulation (TMS) over the cerebellum evokes electromyographic (EMG) response with the latency of approximately 100 ms in the soleus muscle in standing human7,8. Furthermore, cerebellar TMS
(C-TMS) induces EMG response in the first dorsal interosseous (FDI) muscle with the latency of approximately 60 ms and induces fluctuation of index finger movement with the latency of approximately 100 ms during visually guided manual tracking task9,35
. The probability of fluctuation of the index finger induced by C-TMS during visually guided manual tracking task was higher than that induced by C-TMS during stationary task to keep the line moved by index finger at the stationary target line9. The subjects tracked
a target moving up and down rhythmically with the index finger during visually guided manual tracking task, so visual feedback control, eye-hand coordination and temporal control for rhythmic finger movement must be processed during the task. In contrast, eye-hand coordination, temporal control could be hardly required during stationary task. Thus, eye-hand coordination and temporal control are the possible neural mechanism underlying that long latency motor response is preferentially induced by C-TMS during visually guided manual tracking task. In this study, to confirm what kind of factors of motor control is necessary for preferential appearance of long latency motor response induced by C-TMS, I inspect the probability of long latency motor response induced by C-TMS during several tasks including some of these motor controls.
There are concerns about the effect of C-TMS. The inhibitory effect of conditioning C-TMS on motor evoked potential (MEP) in the FDI muscle
- 28 -
is available by magnetic stimulation (MS) over the dorsal neck (N-MS)21.
Furthermore, repetitive C-TMS and repetitive N-MS similarly increase MEP amplitude in the FDI muscle22. Neck twitch via contraction of the dorsal
neck muscle is observed in either of the stimulation conditions. The contraction of the neck dorsal muscle can induce afferent feedback and motion artifact on hand, so there is a possible that the afferent feedback and motion artifact induced by C-TMS affected corticospinal excitability in these previous studies. Long latency fluctuation of finger movement and EMG response induced by C-TMS can be associated with concomitantly neck twitch induced by C-TMS because neck twitch must be evoked when C-TMS was delivered during visually guided manual tracking task. In this study, to confirm whether the neck twitch associate with long latency fluctuation of finger movement and EMG response, the probability of long latency fluctuation of finger movement and EMG response induced by C-TMS is compared with that induced by N-MS which evokes neck twitch to be same amplitude of the neck twitch evoked by C-TMS.
- 29 -
Ⅱ. Methods 1. Subjects
Eleven healthy humans aged between 22 and 37 years were recruited. The subjects did not have orthopedic or neurological histories. The experimental protocol was explained, and the subjects gave their written informed consent to subject in this experiment. The ethics committee of Osaka Prefecture University approved the experimental procedures, and the study was conducted according to the Declaration of Helsinki.
2. Apparatus
The subjects were seated on a height-adjustable chair ahead of oscilloscope and the electrogoniometer was attached to a jaw and precordia to record the neck motion of flexion and extension (Fig. 2. 1A). Earplugs were inserted to both ears to prevent the effect of concomitantly auditory stimulation of TMS. The right forearm was placed on a table in a neutral position between pronation and supination. The right forearm and palm were fixed by metal frames to prevent unwanted motion. The right index finger was extended comfortably and the fingertip was placed on a flexible plate (Fig. 2. 1C). The flexible plate was warped with flexion of the metacarpophalangeal joint of the index finger. The degree of warp, expressed as fingertip displacement, was measured via strain gauges attached on the flexible plate. The signals from the strain gauges were amplified via strain amplifier (DPM-712B, Kyowa Dengyo). The fingertip displacement indirectly represented index finger movement. Ag/AgCl surface electrodes were placed on the right FDI muscle 1 cm apart to record EMG signals. The EMG signals were amplified with a pass-band filter of 5 Hz to 3 kHz using an amplifier (MEG-2100, Nihon Kohden). The signals from the strain gauges and EMG signals were converted to digital signals at a
- 30 -
sampling rate of 10 kHz (PowerLab, ADInstruments) and stored in a personal computer.
3. Motor task
1) Continuous tracking (CT)
A sinusoidal curve with cycle duration of 5 s was generated using a function generator (FG-273, Kenwood) and the y-axis of the sinusoidal curve was displayed on an oscilloscope as a horizontal line defined as target line (Fig. 2. 2A). The amplitude of sinusoidal curve was corresponded to approximately 20 mm of the fingertip displacement. On the same oscilloscope, the fingertip displacement was displayed as another horizontal line defined as fingertip displacement line. The line was at the bottom when the fingertip displacement was 0 (neutral position), and the line went up with flexion of the index finger (flexion position). The subjects track the continuously and rhythmically moving target by flexion and extension of index finger.
2) Discrete tracking (DT)
Subject gazed at oscilloscope which nothing was displayed on and the finger was fixed at neutral position, and the moving target and fingertip displacement line was displayed at random timing (Fig. 2. 2B). The subject started tracking moving target as soon as the target comes to the bottom that is point of neutral position of fingertip displacement. Subject continues tracking till the lines disappear at the middle point of extension phase. The intervals of trials were 10 sec or more and at random.
3) Phasic contraction (PC)
The target and fingertip displacement line was not displayed throughout the trial (Fig. 2. 2C). The subject was asked the index finger flexed at the same degree of speed and range of motion during DT at self-generated
- 31 -
timing.
4) Tonic contraction (TC)
EMG amplitude of the FDI muscle on lined was displayed on monitor put ahead of subject but not displayed the target and fingertip displacement line. The subject was asked the index finger continuously fixed at approximately 15 mm flexion position and the amplitude of EMG with contraction matching with that in the tracking at approximately 15 mm flexion position of index finger (Fig. 2. 2D).
4. Magnetic stimulation
MS was delivered by a double-cone coil (YM-133B, Nihon Kohden) connected to a magnetic stimulator (SMN-1200, Nihon Kohden). The maximum intensity of the coil was 0.96 tesla. The center of junction region of the coil was placed at the point 1 cm below and 3 cm to right of the inion to stimulate the right cerebellum hemisphere9,25,29,36-38 (Fig. 2. 1B). The coil
was placed to evoke upward current in the brain. The active motor threshold, which of short latency motor response is induced by C-TMS in the FDI muscle, was estimated during tracking the moving target. The active motor threshold was defined as the lowest stimulus intensity producing a short latency motor response in five out of ten consecutive stimuli. The intensity of test TMS was 90% of the lowest threshold. If the short latency motor response was not induced by TMS with maximum stimulator output, the TMS intensity was set as 90 % of the maximum stimulator output. This stimulation condition was defined as C-TMS condition.
Another stimulus position is a point in 2 cm to right and below two-third of the distance of inion and C7 from inion to stimulate peripheral structures around back of the head except cerebellum (Fig. 2. 1B). The coil was placed to produce downward current in the coil. The intensity was estimated to be same the range of neck motion induced by magnetic
- 32 -
stimulation (MS) over the neck and that by C-TMS during tracking task. It is not possible that the certain cerebellar structure is not stimulate directly if the coil is put these site on neck, but peripheral structure, which associate with neck twitch at least, is stimulated by degree same as the C-TMS condition if the amplitude of neck twitch is same as C-TMS condition. This stimulation setting was defined as neck MS (N-MS) condition. When delivering sham TMS (S-TMS), the coil was held at a 90-degree angle from the scalp over inion. The intensity was set at degree of C-TMS.
TMS was delivered when the fingertip displacement reached approximately 15 mm during the task with flexion of the index finger. A trigger producing TMS was generated using a trigger generator system (EC-601J, Nihon Kohden). In TC without finger flexion, TMS was delivered by manual operation at random timing. Twenty times of TMS was performed during the task at the interval 5 sec or more in either task.
5. Data analysis
Peak to peak of trajectory of neck motion was measured after TMS in each trials and it was defined as amplitude of neck motion. The onset latency was visually estimated in each trial. The acceleration of the fingertip displacement was estimated to determine the presence or absence of fluctuation of finger movement. If the peak-to-peak amplitude of acceleration in the time window between 0 and 300 ms after TMS exceeded 1.5 times that in the time window between 0 and 200 ms before TMS, fluctuation of finger movement was judged to be present. The probability of the positive was expressed as the number of positive trials divided by the number of whole trials. The onset latency of fluctuation of finger movement was visually estimated on an averaged trace of fingertip displacement from trials with fluctuation of each subject.
Baseline of the EMG trace was adjusted to be 0, and the adjusted EMG trace was rectified. A regression equation and residuals were calculated
- 33 -
from the averaged EMG trace in all trials in the time window between 0 and 300 ms before TMS (Fig. 2. 1D). A line was calculated in the way to add 7 times of the residuals to the regression line, which was defined as threshold line. Then, if the EMG amplitude was beyond the calculated threshold line in the time window between 30 and 100 ms after TMS, it was judged that the EMG response present in the condition. The onset latency of EMG response induced by C-TMS was from 62 to 68 ms and the peak latency of that was from 87 to 94 ms35, so the time window suit to judge the appearance
of EMG response. Therefore, the condition, which EMG response present in, was defined as positive condition, and the condition, which EMG response was absent in, was defined as negative condition. The probability of the positive was expressed as the number of positive trials divided by the number of all conditions. The onset latency and peak latency of EMG response were visually estimated in averaged EMG trace in positive trial.
One-way ANOVA was conducted to test the different in means between TMS conditions and paired t-tests were conducted to test the difference between the stimulation conditions. Chi square test was conducted to compare ratio of positive between the TMS conditions in fluctuation of finger movement and EMG response. Thus, z-tests for the equality of two proportions were conducted to test the difference between the stimulation conditions in fluctuation of finger movement and EMG response. The alpha level was set at 0.05 for t-test, ANOVA and Chi-square test. Bonferroni correction was conducted in multiple comparisons. Data are presented as the mean values and standard error of the mean.
- 34 -
Fig. 2. 1 (A) An illustration of the experimental setup. The subject was seated ahead of the oscilloscope or the monitor and the electrogoniometer was attached a jaw and precordia. (B) An illustration of the points to place a double cone coil. Filled circles indicate the point at which center of junction region of the coil is placed. Open circles indicate reference points to determine the position of the coil. (C) An illustration of setting to measure of right index finger movement. (D) An illustration explaining a way of analysis of EMG response. Gray solid line is FDI-EMG. Bottom diagonal solid line is regression line. Upper diagonal solid line is threshold line.
- 35 -
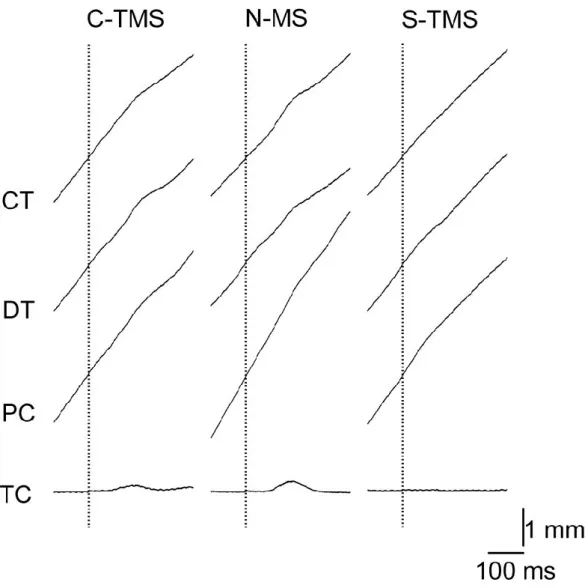
Fig. 2. 2 An illustration of experimental tasks, which are (A) continuous tracking, (B) discrete tracking, (C) phasic contraction and (D) tonic contraction. Squares indicate oscilloscope, and gray line is moving target and black line is fingertip displacement line. In lower berth in each figure, gray solid trace is a trajectory of target and black solid trace is a trajectory of fingertip displacement, and both are displayed on oscilloscope. Dotted trace is not displayed on oscilloscope. Open triangle indicate TMS timing and filled triangle indicate timing of start to move.
- 36 -
Ⅲ. Results 1. MS condition
MS was delivered when the fingertip displacement was 14.3 ± 0.4 mm during CT, DT, or PC, and 14.0 ± 1.2 mm during TC (Fig. 2. 3A). There was no significant difference in the fingertip displacement when MS was delivered among the stimulation conditions during CT [F(3, 32)=0.14; P=0.87], DT[F(3, 32)=0.33; p=0.72], PC[F(3, 32)=2.60; P=0.10], or TC[F(3, 32)=0.72; p=0.50]. The short latency motor response did not induced by C-TMS even at the maximum TMS intensity in all subjects during tracking. Then TMS intensity used in the C-TMS condition and S-TMS condition was 90 % of maximum output in all subjects. Intensity of TMS in N-MS condition was 81 ± 5 % of maximum output and the short latency response was absent. 2. Neck twitch
Neck twitch was evoked by C-TMS or N-MS but that was not evoked by S-TMS as shown in specimen record that was averaged in all trials (Fig. 2. 3B). Thus the amplitude induced by C-TMS or N-MS could be measured. The amplitude of neck twitch induced by C-TMS was 4.4 ± 0.6°and that induced by N-MS was 4.6 ± 0.7°. There was no significant difference between the amplitude of neck twitch induced by C-TMS and that induced by N-MS during each task (P>0.05) (Fig. 2. 3C). The latency of neck twitch induced by C-TMS was 17 ± 1 ms and that induced by N-MS was 24 ± 1 ms. The latency of neck twitch induced by C-TMS was significantly shorter than that induced by N-MS during each task (P<0.05) (Fig. 2. 3D).
3. Response during CT
Specimen record of averaged trajectory of fingertip displacement was illustrated in Fig. 2. 4. The probability of fluctuation of finger movement
- 37 -
induced by C-TMS was 24.5 %, that induced by N-MS was 29.5 % and that induced by S-TMS was 6.8 % (Fig. 2. 5A). Chi-square test revealed that the probability of fluctuation of finger movement was difference between the stimulation conditions (P<0.05). z-test revealed the probability of fluctuation induced by C-TMS and that induced by N-MS were significantly higher than that induced by S-TMS (P<0.017), but there was no significant difference between the probability of fluctuation induced by C-TMS and that induced by N-MS (P>0.017). The onset latency of fluctuation of finger movement induced by C-TMS was 109 ± 17 ms, that induced by N-MS was 53 ± 12 ms and that induced by S-TMS was 136 ± 17 ms (Fig. 2. 5B).
Background EMG amplitude was not difference between the stimulation conditions, that was revealed by one-way ANOVA (P>0.05) (Fig. 2. 4). Averaged EMG trace is illustrated in Fig. 2. 7. The probability of EMG response in C-TMS was 72.7 %, that in N-MS was 9.1 % and that in S-TMS was 9.1 % (Fig. 2. 8A). Chi-square test revealed that the probability of EMG response was significant difference between the stimulation conditions. z-test revealed that the probability of EMG response induced by C-TMS was significant higher than that induced by N-MS and S-TMS (P<0.017), but there was no significant difference between that induced by N-MS and that induced by S-TMS (p=1). The onset and peak latency of EMG response induced by C-TMS were 69 ±4 and 85 ± 3 ms, that induced by N-MS were 59 ± 7 and 73 ± 14 ms, and that induced by S-TMS were 67 and 86 ms (Fig. 2. 8B).
4. Response during DT
The probability of fluctuation of finger movement induced by C-TMS was 25.0 %, that induced by N-MS was 31.8 % and that induced by S-TMS was 9.0 % (Fig. 2. 6A). Chi-square test revealed that the probability of fluctuation of finger movement was difference between the stimulation conditions (P<0.05). z-test revealed the probability of fluctuation induced by C-TMS and that induced by N-MS were significantly higher than
- 38 -
that induced by S-TMS (P<0.017), but there was no significant difference between that induced by C-TMS and that induced by N-MS (P>0.017). The onset latency of fluctuation of finger movement in C-TMS condition was 109.0 ± 18 ms, that in N-MS condition was 63.8 ± 17 ms and that in S-TMS was 78.3 ± 25 ms (Fig. 2. 6B).
Background EMG amplitude was not difference between the stimulation conditions, that was revealed by one-way ANOVA (P>0.05) (Fig. 2. 4). The probability of EMG response induced by C-TMS was 36.4 %, that induced by N-MS was 27.3 % and that induced by S-TMS was 9.1 % (Fig. 2. 8A). Chi-square test revealed that the probability of EMG response was not significant difference between the stimulation conditions. The onset and peak latency of EMG response induced by C-TMS were 72 ±4 and 90 ± 3 ms, that induced by N-MS were 73 ± 6 and 90 ± 3 ms and that induced by S-TMS were 83 and 91 ms (Fig. 2. 8B).
5. Response during PC
The probability of fluctuation of finger movement induced by C-TMS was 20.5 %, that induced by N-MS was 29.5 % and that induced by S-TMS was 7.3 % (Fig. 2. 6A). Chi-square test revealed that the probability of fluctuation of finger movement was difference between the stimulation conditions (P<0.05). z-test revealed the probability of fluctuation induced by C-TMS and that induced by N-MS were significantly higher than that induced by S-TMS (P<0.017), but there was no significant difference between that induced by C-TMS and that induced by N-MS (p>0.017). The onset latency of fluctuation induced by C-TMS was 93.5 ± 13 ms, that induced by N-MS was 53 ± 11 ms and that induced by S-TMS was 130 ± 31 ms (Fig. 2. 6B).
Background EMG amplitude was not difference between the stimulation conditions, that was revealed by one-way ANOVA (P>0.05) (Fig. 2. 4). The probability of EMG response induced by C-TMS was 63.6 %, that induced by
- 39 -
N-MS was 54.5 % and that induced by S-TMS was 18.2 % (Fig. 2. 8A). Chi-square test revealed that the probability of EMG response was not significant difference between the stimulation conditions. The onset and peak latency of EMG response induced by C-TMS were 63 ± 2 and 85 ± 4 ms, that induced by N-MS were 68 ± 8 and 88 ± 5 ms and that induced by S-TMS were 68 ± 9 and 81 ± 13 ms (Fig. 2. 8B).
6. Response during TC
The probability of fluctuation of finger movement induced by C-TMS was 21.4 %, that induced by N-MS was 31.4 % and that induced by S-TMS was 3.2 % (Fig. 2. 6A). Chi-square test revealed that the probability of fluctuation of finger movement was difference between the stimulation conditions (P<0.05). z-test revealed the probability of fluctuation induced by C-TMS and that induced by N-MS were significantly higher than that induced by S-TMS (P<0.017), but there was no significant difference between that induced by C-TMS and that induced by N-MS (P>0.017). The latency of fluctuation of finger movement induced by C-TMS was 65 ± 17 ms, that in N-MS condition was 55 ± 15 ms and that in S-TMS was 117 ± 36 ms (Fig. 2. 6B).
Background EMG amplitude was not difference between the stimulation conditions, that was revealed by one-way ANOVA (P>0.05) (Fig. 2. 4). The probability of EMG response induced by C-TMS was 18.2 %, that induced by N-MS was 27.3 % and that induced by S-TMS was 0 % (Fig. 2. 8A). Chi-square test revealed that the probability of EMG response was not significant difference between the stimulation conditions. The onset and peak latency of EMG response induced by C-TMS were 75 ± 6 and 94 ± 3 ms, that induced by N-MS were 67 ± 5 and 85 ± 6 ms and that induced by S-TMS were 68 ± 23 and 71 ± 22 ms (Fig. 2. 8B).
- 40 -
Fig. 2. 3 (A) Averaged fingertip displacement when TMS was delivered in all conditions in continuous tracking (CT), discrete tracking (DT), phasic contraction (CT) and tonic contraction (TC). (B) Averaged trace of neck motion in all trials. (C) Averaged amplitude of neck twitch. (D) Averaged latency of neck motion. Each bar indicates means and each error bar indicates standard errors of the mean.
Fig. 2. 4 Background EMG amplitude. Bar indicate mean and error bar indicate standard error.
- 41 -
Fig. 2. 5 Specimen record of averaged trajectory of fingertip displacement. Dashed vertical lines indicate the MS onset.
- 42 -
Fig. 2. 6 Probability of fluctuation of finger movement (A) and onset latency of fluctuation (B). Bars indicate the means and error bars indicate standard errors of the mean. Asterisks indicate significant difference. The number in the bar is number of subject with positive trial.
- 43 -
Fig. 2. 7 An averaged EMG trace during continuous tracking (CT), discrete tracking (DT), phasic contraction (PC) and tonic contraction (TC).
- 44 -
Fig. 2. 8 Probability of EMG response (A) and onset and peak latency of the EMG response (B). Bars indicate the means and error bar indicate the standard errors of the mean. An asterisk indicates statistical significance. The number in the bar is number of subject with positive condition.
- 45 -
Ⅳ. Discussion
The probability of fluctuation of index finger movement induced by C-TMS and that induced by N-MS were higher than that induced by S-TMS but there was no significant difference between the probability of fluctuation of finger movement induced by C-TMS and that induced by N-MS during all the tasks. Therefore, I can not rule out a possibility that fluctuation is induced by neck twitch concomitantly evoked by MS. On the other hand, the probability of EMG response by C-TMS was higher than that induced by N-MS and S-TMS but that induced by N-MS was not higher than that induced by S-TMS during CT, and there was no significant difference in the probability of EMG response between the stimulation conditions during DT, PC and TC. These findings indicate that EMG response induced by C-TMS preferentially appears during CT and the neck twitch can not be origin of the EMG response.
1. Methodological consideration
TMS over around the inion induces EMG response with the latency of approximately 20 ms in the FDI muscle through direct stimulation of the brainstem or the spinal cord30,31. In the present study, the intensity of
TMS below the active motor threshold of a short latency motor response was delivered and there was not short latency response that of latency is approximately 20 ms in all trials. Therefore, motor response induced by C-TMS in the present study is not a short latency motor response due to direct stimulation of the brainstem or the spinal cord.
Conditioning C-TMS reduces MEP amplitude in the ipsilateral FDI muscle1,2,21,32, but the inhibitory effect is absent in the patients with
cerebellar infarction1,5. These findings indicate that the reduction of MEP
- 46 -
of the cerebellar structures. Furthermore, coil position of TMS for stimulating the cerebellar hemisphere is a site 1 cm below and 2 to 4 cm lateral to the inion according to a previous study using functional resonance imaging (fMRI) guided frameless stereotaxy38. Thus, C-TMS applied
in the present study should have stimulated the certain cerebellar structures.
There is another possibility that auditory startle response is induced by auditory stimulation of TMS. In the previous study, auditory startle response was evoked in FDI-EMG and the latency approximately 100 ms39. If
long latency motor response induced by TMS is startle response induced by loud noise produced by TMS, the probability of EMG response induced by C-TMS and that induced by S-TMS should not had been significantly different. However, indeed, the probability of EMG response was significantly higher than that induced by S-TMS. Therefore, auditory startle response must not be cause of long latency EMG response induced by C-TMS.
2. Fluctuation of index finger movement
The amplitude of neck twitch evoked by C-TMS was not significantly different from that evoked by N-MS in all the tasks. The probability of fluctuation of finger movement induced by C-TMS or that induced by N-MS was significantly higher than that induced by S-TMS. In contrast, the probability of fluctuation of finger movement induced by C-TMS was not significantly difference from that induced by N-MS in all the tasks. These findings indicate that the fluctuation of finger movement occurred when the neck twitch was evoked by MS in all the tasks. N-MS site was away from the appropriate site for stimulation of the cerebellum so N-MS can evoke neck twitch but can not precisely stimulate the cerebellum. Therefore, we can not rule out the possible that the neck twitch is cause of fluctuation of index finger movement.
- 47 -
3. Possible pathway of long latency EMG response
The probability of long latency EMG response induced by C-TMS was higher than that induced by N-MS or S-TMS, and there was no significant difference between the probability of EMG response induced by N-MS and that induced by S-TMS during CT. There was no significant difference between the amplitude of neck twitch evoked by C-TMS and that induced by N-MS during CT. These findings indicate that the neck twitch is not necessary for inducing long latency EMG response during CT. Therefore, the neck twitch must not be origin of long latency EMG response.
C-TMS 5-8 ms before TMS over the contralateral motor cortex reduces MEP amplitude in the FDI muscle1-4 and the inhibitory effect was absent in
patient with cerebellar lesion5 or with lesion in the thalamus6. These
findings indicate that C-TMS affect the corticospinal excitability via the cerebello-thalamo-cortical pathway in short period. In contrast, the onset latency of EMG response induced by C-TMS was approximately 60 ms. Thus, long latency EMG response must not be mediated by cerebello-thalamo-cortical pathway.
C-TMS induces long latency EMG response in the bilateral soleus muscle in standing human and the latency is approximately 100 ms7. The latency was
shorted by optokinetic stimulation to activate vestibulospinal tract8,
indicating that long latency EMG response induced by C-TMS is mediated by vestibulospinal tract. In this study, coil position was around inion and the peak latency of EMG response in the FDI muscle induced by C-TMS was approximately 90 ms. Therefore, TMS condition and the latency in this study is consistent with previous study by Sakihara et al.7,8. Thus, long latency
EMG response in the FDI muscle induced by C-TMS can be mediated by vestibulospinal tract.
- 48 -
4. Task dependency of long latency EMG response
The probability of EMG response induced by C-TMS was significantly higher than that induced by N-MS or S-TMS during CT but there was no significant difference among the stimulation condition during DT, PC and TC. These findings indicate that long latency EMG response is preferentially induced by C-TMS only during CT.
Cerebellar blood oxygenation signal increased as eye-hand coordination increased during visually guided manual tracking task12. Eye
hand coordination is impaired in patients with cerebellar lesion 14. Lesion
of a dentate nucleus in the cerebellar hemisphere impaired the performance of visually guided manual tracking requiring eye-hand coordination in baboon16. These findings indicate that the cerebellum plays important role
on eye-hand coordination during visually guided manual tracking. In this study, eye-hand coordination was necessary during CT and DT. Thus, the cerebellum must have activated during CT and DT. However, the statistically significant effect of C-TMS on the probability of long latency EMG response was present only during CT. Therefore, eye-hand coordination can not be crucial mechanism that long latency EMG response is preferentially induced by C-TMS during CT.
The cerebellum plays an important role not only on eye-hand coordination but also on temporal control of finger movement. The lateral cerebellum was active during a motor task requiring temporal control in the previous study using functional MRI40, indicating the cerebellum
contributes to temporal control in motor aspect. The cerebellar activity increased when subjects tapped with finger to rhythmic metronome tones in the previous study using positron emission tomography19. rTMS over the
cerebellum increases variability of the intertap interval to the finger movement with externally paced rhythmic cue20. These findings suggest that
the cerebellum plays an important role on temporal control of rhythmic finger movement. In this study, the target was moving up and down