Economic Effects of Foreign Direct Investment on the Sakhalin Region from 1995 to 2005
Keiko Suganuma
*Abstract
This paper quantitatively evaluates the economic effects of foreign direct investment (FDI) on Russia’s regional development, concentrating on the Sakhalin region in the construction stage of both Sakhalin Projects 1 and 2. The region has enjoyed a relatively large amount of FDI compared to others with similar situations of relevant early main economic elements. This analysis shows that the FDI into the region has had a positive economic effect on the nominal wage levels, domestic investment, international trade, economic growth, and the upgrading and expanding of social capital. On the other hand, the effects on employment, real wage levels, technology, and budget revenue are not statistically significant.
Keywords: foreign direct investment (FDI), Russia, Sakhalin, economic effects
1. Introduction
For Russia and its constitutional regions, economic revitalization is an urgent challenge.
Promoting foreign direct investment (FDI) is one effective method to address this challenge because such direct investment from overseas can usher in a wide range of economic effects to the receiving country and its region. The economic effects of FDI include
*
Center for Far Eastern Studies, University of Toyama, Gofuku 3190, Toyama City, 930-8555, Japan.
E-mail: [email protected]
I wish to thank Ichiro Iwasaki, Kazuhiro Kumo, Masaaki Kuboniwa, Fumikazu Sugiura, Taku Suzuki,
Yoshisada Shida, and the referees of the
Far Eastern Studiesfor providing valuable comments on an earlier
draft of the paper and Yuko Fujiwara for her assistance with my research. However, I blame no one but
myself for any mistakes.
economic, employment, and income growth, technological transfer, and industrial structural change (Tanaka 1994; Blomstrom and Kokko 1998; Odagiri 2000; JBIC Institute 2002;
Ohashi 2003; Gorg and Greenaway 2004).
In the case of Russia, FDI has been concentrated in the cities and regions with large economies and existing resources (Iwasaki and Suganuma 2005; Ledyaeva 2009). This concentration is prominent, especially in the Sakhalin region, when looking at the FDI cumulative total value and cumulative value per capita from 1995 to 2005
1. In fact, as shown in Table 1, a great amount of FDI went into the fuel sector of this region. Due to data limitations, tracing the FDI trends of each sector in every region is not feasible;
however, the ratio of FDI into the Russian fuel sector increased to 27.9% of the total FDI in 1999, which is the year the Sakhalin Project gained momentum and FDI into Sakhalin abruptly increased. Since a large amount of FDI has been put into the fuel sector, the accumulative amount between 1999 and 2005 reached 23.0% of the FDI ratio into the Russian fuel sector of the total FDI (Table 1). Moreover, since the major companies involved in the Sakhalin Project were from Japan (Sakhalin 1 and 2), Holland (Sakhalin 2), India (Sakhalin 1), and the U.S. (Sakhalin 1) and these countries topped the list of FDI into the Sakhalin region, the FDI into it is clearly concentrated on the Sakhalin Project (Table 2)
2.
Based on the above characteristics, many discussions have focused on the influence of the Sakhalin Project as attracting FDI into the Sakhalin region, but very few researches quantitatively verify the economic influence of FDI in this region
3. Due to the non-
1
However, we must keep in mind that FDI inflow is recorded in the region where the headquarters of the investment firm is located. In other words, if a foreign company with many branches all over Russia and headquarters in Moscow invests in other regions than Moscow, the investment is recorded for Moscow.
Therefore, perhaps FDI inflow into other regions remains underestimated (Iwasaki and Suganuma 2005).
2
However, it has been pointed out that the investment amount by Japan dropped radically while the
investment amount by Holland increased rapidly because the investments into Sakhalin Energy made by such Japanese corporations as Mitsui & Co. and Mitsubishi Corporation were summed as Dutch investment (Endo 2007).
3
For example, the operational companies of the Sakhalin Project of course trumpet the economic effects on
the region in their reports. Ruzanov (1999) and Sugimoto and Furuta (1999) also refer to the economic
contribution that the Sakhalin Project brought to the economy of the Sakhalin region. However, they did not
conduct quantitative analysis. On the other hand, Thornton (2002) and Thornton (2007) did point out such
economic effects as budget revenue and wages in the Sakhalin region, but it is difficult to say that these
studies did quantitative analyses.
availability of micro data in the Sakhalin region, without using a regression analysis method, this paper quantitatively examines FDI’s economic effects by concentrating on the local economy of the Sakhalin region, which has previously been emphasized by descriptive facts. Such methodology is different from previous studies.
The paper is structured as follows: the next section reviews the previous studies of the economic influence of FDI on host countries and presents hypotheses for a quantitative analysis taking Sakhalin’s case into consideration. The third section explains the analytical methods of the economic influence of FDI on the Sakhalin region, and the fourth section reports the result of analysis. The last section summarizes and offers a conclusion.
Table 1 Foreign Direct Investment Trend in Russia
Russian Federation ($Million) 2,020 2,440 5,333 3,361 4,260 4,429
Far East Federal District ($ Million) 127 242 196 250 1,097 305
Sakhalin Region ($ Million) 50 43 49 132 1,022 246
Ratio of Sakhalin Region in Russian Federation (%) 2.5 1.8 0.9 3.9 24.0 5.6
Ratio of Sakhalin Region in Far East Federal District
(%) 39.1 17.7 25.1 52.8 93.2 80.8
By sector (fuel) ($ Million) 262 196 315 307 1,187 442
Ratio of FDI into fuel sector in Russian Federation (%) 13.0 8.0 5.9 9.1 27.9 10.0
Cumulative Total
Cumulative Total per
Capita1)
Russian Federation ($ million) 3,980 4,003 6,781 9,420 13,072 59,099 414
Far East Federal District ($ million) 458 724 2,093 3,396 3,942 12,831 1,960
Sakhalin Region ($ million) 375 680 2,008 3,272 3,801 11,677 22,199
Ratio of Sakhalin Region in Russian Federation (%) 9.4 17.0 29.6 34.7 29.1 19.8
Ratio of Sakhalin Region in Far East Federal District
(%) 81.7 93.9 95.9 96.3 96.4 91.0
By sector (fuel) ($ million) 430 667 1,917 3,984 3,913 13,620
Ratio of FDI into fuel sector in Russian Federation (%) 10.8 16.7 28.3 42.3 29.9 23.0
Note: 1) Cumulative total per capita was calculated using population on January 1, 2006. The unit is 1$.
Source: Goskomstat RF (2001a; 2003a), Rosstat (2005a; 2007a; 2009a). Population was calculated by author using Rosstat (2009b).
1999 2000
2005
1995 to 2005
1995 1996
2001 2002 2003 2004
1997 1998
Table 2 Foreign Investment Trends into Sakhalin Region
Cumulative Total
Cumulative Total per Capita
2)Total Foreign Investment ($ million) 388.9 706.7 2,083.1 3,927.1 4,861.6 11,967.4 22,751.7
FDI ( $ million ) 374.6 679.8 2,007.7 3,272.1 3,800.8 10,135.0 19,268.1
Ratio of FDI in Total Foreign Investment (%) 96.3 96.2 96.4 83.3 78.2 84.7 84.7
Mining and manufacturing industry 336.2 528.7 1,792.7 3,692.0 3,803.3 10,152.9 19,302.1 ratio of mining and manufacturing industry in all
Economic Activities (%) 86.5 74.8 86.1 94.0 78.2 84.8 84.8
Japan 157.5 233.3 783.8 4.4 9.5 1,188.5 2,259.5
U.S. 0.7 2.6 6.4 8.5 4.7 22.9 43.5
Holland - - 567.6 3,267.8 3,797.4 7,632.8 14,511.0
India - - - 130.7 315.0 445.7 847.3
Ratio of Japan in total foreign investment (%) 40.5 33.0 37.6 0.1 0.2 9.9
Ratio of U.S. in total foreign investment (%) 0.2 0.4 0.3 0.2 0.1 0.2
Ratio of Holland in total foreign investment (%) - - 27.2 83.2 78.1 63.8
Ratio of India in total foreign investment (%) - - - 3.3 6.5 3.7
Note: 1) Data by sector and country was not drawn from FDI but from total foreign investment.
2) Cumulative total per capita was calculated using population on January 1, 2006. The unit is 1$.
Source: JETRO (2003; 2004; 2005;2006). Population was calculated by author using Rosstat (2009b).
By Sector
1)By Country ( Amount: $ million)
1)By Country (Ratio: %)
2004 2005
2001 to 2005
By Types of Investment
2001 2002 2003
2. Hypotheses regarding economic influence of FDI in Sakhalin region
As mentioned above, FDI has great potential for creating considerable economic
influence in host countries. In this section, we divide the possible economic influences of
FDI into eight groups and present a hypothesis for each group for the Sakhalin region. First
we individually examine each economic influence based on the previous studies listed in
Table 3.
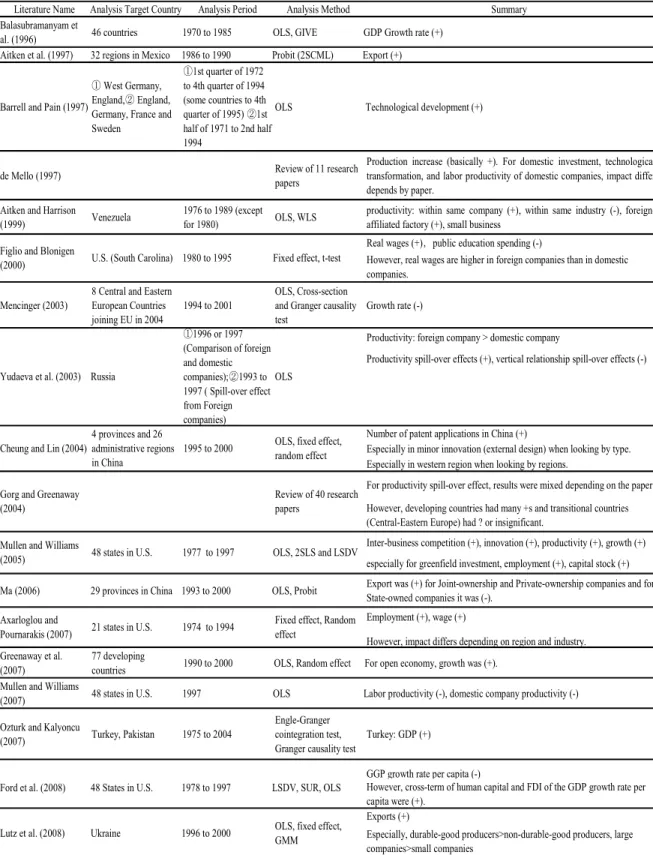
Table 3 List of Previous Studies on Economic Effects on FDI Recipients
1)Literature Name Analysis Target Country Analysis Period Analysis Method Summary
Balasubramanyam et
al. (1996) 46 countries 1970 to 1985 OLS, GIVE GDP Growth rate (+)
Aitken et al. (1997) 32 regions in Mexico 1986 to 1990 Probit (2SCML) Export (+)
Barrell and Pain (1997)
①West Germany, England,②England, Germany, France and Sweden
①1st quarter of 1972 to 4th quarter of 1994 (some countries to 4th quarter of 1995)②1st half of 1971 to 2nd half 1994
OLS Technological development (+)
de Mello (1997) Review of 11 research
papers
Production increase (basically +). For domestic investment, technological transformation, and labor productivity of domestic companies, impact differ depends by paper.
Aitken and Harrison
(1999) Venezuela 1976 to 1989 (except
for 1980) OLS, WLS productivity: within same company (+), within same industry (-), foreign- affiliated factory (+), small business
Real wages (+),public education spending (-)
However, real wages are higher in foreign companies than in domestic companies.
Mencinger (2003)
8 Central and Eastern European Countries joining EU in 2004
1994 to 2001
OLS, Cross-section and Granger causality test
Growth rate (-)
Productivity: foreign company > domestic company
Productivity spill-over effects (+), vertical relationship spill-over effects (-)
Number of patent applications in China (+)
Especially in minor innovation (external design) when looking by type.
Especially in western region when looking by regions.
For productivity spill-over effect, results were mixed depending on the paper.
However, developing countries had many +s and transitional countries (Central-Eastern Europe) had ? or insignificant.
Inter-business competition (+), innovation (+), productivity (+), growth (+) especially for greenfield investment, employment (+), capital stock (+) Ma (2006) 29 provinces in China 1993 to 2000 OLS, Probit Export was (+) for Joint-ownership and Private-ownership companies and for
State-owned companies it was (-).
Employment (+), wage (+)
However, impact differs depending on region and industry.
Greenaway et al.
(2007)
77 developing
countries 1990 to 2000 OLS, Random effect For open economy, growth was (+).
Mullen and Williams
(2007) 48 states in U.S. 1997 OLS Labor productivity (-), domestic company productivity (-)
Ozturk and Kalyoncu
(2007) Turkey, Pakistan 1975 to 2004
Engle-Granger cointegration test, Granger causality test
Turkey: GDP (+)
GGP growth rate per capita (-)
However, cross-term of human capital and FDI of the GDP growth rate per capita were (+).
Exports (+)
Especially, durable-good producers>non-durable-good producers, large companies>small companies
Figlio and Blonigen
(2000) U.S. (South Carolina) 1980 to 1995 Fixed effect, t-test
Yudaeva et al. (2003) Russia
①1996 or 1997 (Comparison of foreign and domestic companies);②1993 to 1997 ( Spill-over effect from Foreign companies)
OLS
Cheung and Lin (2004)
4 provinces and 26 administrative regions in China
1995 to 2000 OLS, fixed effect, random effect
Gorg and Greenaway (2004)
Review of 40 research papers
Mullen and Williams
(2005) 48 states in U.S. 1977 to 1997 OLS, 2SLS and LSDV
Axarloglou and
Pournarakis (2007) 21 states in U.S. 1974 to 1994 Fixed effect, Random effect
Ford et al. (2008) 48 States in U.S. 1978 to 1997 LSDV, SUR, OLS
Note: 1) Only the theme of this paper, the economic effects of FDI in countries and in regions, was summarized here from each study.
Source: created by author.
Lutz et al. (2008) Ukraine 1996 to 2000 OLS, fixed effect, GMM
2.1 Effect on employment
Naturally, there is a direct influence on job-creation when foreign companies invest in a country or in a region and hire local workers. The hiring activities of local companies can also be influenced if these foreign companies use local suppliers. In addition, as will be mentioned below, an increase in the total demand due to economic growth can increase employment. Axarloglou and Pournarakis (2007) confirmed an employment increase caused by FDI inflows in an empirical analysis that targeted 21 U.S. States. However, the impact and significance of the employment increase brought by FDI inflows depend on the region and the industry. For the Sakhalin region, FDI inflow probably increased employment. For example, Sakhalin Energy stated that 22,752 people were hired directly and by contract in the fourth quarter of 2005 for projects related to Sakhalin 2 (Sakhalin Energy 2006), remarkably lowering the region’s unemployment rate. According to official Russian government statistics
4, the unemployment rate fell from 20.4% in 1999 to 4.6% in 2006
5, even though the unemployment rate for the same period in Russia as a whole only decreased from 13.0% to 7.2%
6. This demonstrates the improvement of employment in the Sakhalin region. In addition, Sakhalin residents themselves recognize the employment- boosting effects brought by the Sakhalin Project. In fact, 22 people out of 38 listed employment as the best benefit that they received from it in a survey conducted in 2000 (Akaha and Vassilieva 2003). Similarly, a local newspaper reported that the employment boosting effect had reached other regions as well. In other words, employment expanded not only in areas like the Okha district, famous for producing oil and natural gas, but also areas adjacent to such pipeline construction sites as the Novyi district, where employment opportunities had been scarce
7. Therefore, the Sakhalin Project boosted employment by direct and indirect hiring as contractors in the Sakhalin region as well.
4
Based on Rosstat (2004; 2009b).
5
Similarly, the registered unemployment rate dropped from 4.0% in 1999 to 1.5% in 2006.
6
On the contrary, on the national level in Russia, the registered unemployment increased from 1.7% in 1999 to 2.3% in 2006.
7
Articles published in newspaper Sovetskii Sakhalin in the Sakhalin region on June 22, 2004, July 2, 2004,
and July 4, 2006.
2.2 Effect on wage level
When a foreign company with financial muscle develops its business in a particular country and region, they often pay higher wages than local companies to attract and maintain skilled workers to meet its skill level. Figlio and Blonigen (2000) compared foreign and local manufacturers and reported that the former paid significantly higher real annual salaries than the latter. Local companies have no choice but to take countermeasures to compete by increasing salaries to retain skilled workers. In this way, FDI often directly and indirectly raises salary levels. Axarloglou and Pournarakis (2007) confirmed the positive effects of FDI by regressing the average hourly earning into FDI inflows.
According to official Russian government statistics
8, real wages increased between 2000 and 2006 at an average annual rate of 13.3% in the Sakhalin region. However, real wages at the national level increased as well at a rate even greater than that of the Sakhalin region (15%)
9. However, the average monthly wage of workers in the oil industry (Neftianik), which is the main industry in the Sakhalin region, surpassed 20,000 rubles in 2004
10. Even though wages in the oil mining industry were higher than Russian salaries in general, note how high the wages of oil industry workers are when we look at the nominal average monthly income of the whole country, which was 6,739.5 rubles in 2004
11. All these factors suggest that the wage standard in the Sakhalin region, where oil and natural gas development has been the major industry, rose as foreign companies gained ground and the Sakhalin Project expanded
12.
2.3 Effects on technological level and productivity
FDI’s economic influences include not only such quantitative effects as the growth of employment and wages but also such qualitative aspects as technological transfers and
8
Based on Rosstat (2006a; 2007b; 2008b; 2009b).
9
However, looking at the average increase-decrease rate of the real monetary income between 2000 and 2006, the Sakhalin region showed more increase (15%) than Russia as a whole (12%).
10
In fact, it was actually 20,078 rubles (newspaper article in Sovetskii Sakhalin in the Sakhalin region, July 14, 2004). In 2004, the nominal average monthly wage of a worker in the fuel and energy resource mining sector in Russia was 19,903 rubles. This fact demonstrates that wages in the Sakhalin region were not eminently at a higher level (Rosstat, 2008a).
11
Based on Rosstat (2009b).
12
Sakhalin Energy claims to have contributed to the improvement of the living standard in the Sakhalin region where Sakhalin 2 is involved. In other words, as wages increased, the percentage of people receiving only the amount below minimum living costs decreased from 21.3% (114,000 people) in 2004 to 20.4%
(108,000 people) in 2005 (Sakhalin Energy 2006).
productivity improvements. These technological transfer effects include direct ones from a foreign parent company to a local subsidiary as well as indirect ones that even spread outside a local subsidiary company when its workers switch jobs to a local company or when workers start their own businesses. Moreover, demonstration effects and competitive effects are expected; the former are created by local companies observing and copying foreign companies’ activities, and the latter can increase incentives for improving local company productivity by the fierce competition with foreign companies. These qualitative effects on the productivity of companies in the host countries will eventually result in such macro-level economic effects as export increases and economic growth.
To verify such economic effects, Cheung and Lin (2004) analyzed the FDI influence on patent applications in China. They concluded that despite different patents that slightly varied by type or region, FDI inflow increased patent applications in China as a whole
13. For the Sakhalin region, the Sakhalin Project’s operational corporations invested capital into various training programs for their workers and local suppliers, including general business, foreign-language, and computer skills
14. These efforts made by the Sakhalin Project-related companies are probably noticeable in macro-data analyses. However, since the FDI in the Sakhalin region was mainly directed toward energy development utilizing special technology, its effects on the numbers of patent applications analyzed by Cheung and Lin (2004) might be very limited.
2.4 Effects on domestic investment activities
The employment and wage increases brought by FDI may expand the effective demand of the interested country and region and vitalize the investment activities of domestic companies. Moreover, if foreign companies actively procure intermediary commodities locally, local companies will need to invest in their facilities to produce enough goods to
13
Other studies, which verified the effects of technological transfers using the differences among the Total Factor Productivities (TFP) of companies in China, have been introduced (Ohashi 2003). Also, Yudaeva et al.
(2003) confirmed the positive impact on productivity in Russia. On the other hand, Mullen and Williams (2007) drew the opposite conclusion. Likewise, de Mello (1997) shows that the results of previous studies on the FDI impact on technological transformation and labor productivity vary.
14
In other words, Exxon Neftegas Limited offers their workers and local suppliers specialized training not
only in Russia but also in the U.S. and Canada. For example, 1,867 people took part in their company’s
programs for the development of human resources at Sakhalin Energy (Sakhalin Energy 2007). Also, in
addition to various trainings, Sakhalin Energy trained local companies, awarded scholarships and internships,
and spent 5.9 million dollars just in 2005 (Sakhalin Energy 2006).
meet the demand of foreign companies. Competing with foreign companies will also stimulate the local companies’ incentives for investment
15. Along with these factors, investment by domestic companies will also probably increase as a whole. Using reviews of empirical studies, de Mello (1997) states that especially in technologically-backward countries the possibility is high that FDI inflow will increase domestic investment
16. This description may match the Sakhalin region. In fact, some cases of FDI-triggered domestic investments have been reported in this region. For example, investment from local companies has increased due to orders (subcontracts) from Sakhalin Project-related companies to Russian companies. In fact, regarding Sakhalin 1, the subcontracts given to Russian companies surpassed 5 billion dollars by 2005
17. As for Sakhalin 2, the amount exceeded 6.1 billion dollars between 1996 and 2005 (Sakhalin Energy, 2006). Note that the investments made by the Sakhalin Project-operated and affiliated companies not only covered the goods used for the project but also went into a wide range of areas that improved social capital, such as infrastructure development. Considering these points, it is highly likely that in the case of the Sakhalin region, FDI increased domestic investment through various subcontracts related to the Sakhalin Project, including infrastructure development.
2.5 Effect on trade activities
FDI also affects the promotion of a region’s trade activities. We consider two export scenarios: 1) foreign newcomers in the region export goods produced in the field, and 2) local companies export as a result of improved production brought by improved productivity and increased domestic investment. On the other hand, the opposite effect is true for imports. We can point out two possibilities here: imports may decrease because previously imported goods are now manufactured locally (import substitution); imports may increase because foreign companies that entered the region may procure goods from other countries. Moreover, an indirect effect is expected if the workers develop interest in imported goods as their wages increase. This explains why the effect of FDI on the increase
15
However, when a local company loses due to the competition from foreign capital and withdraws, a negative effect is produced in the investment receiving side.
16
On the other hand, technically advanced countries have recorded negative impacts (de Mello 1997).
17
Sakhalin 1 homepage (http://www.sakhalin1.com/en/benefits/torussia.asp).
of imports is limited, even though many previous studies have repeatedly confirmed how it promotes exports (Aitken et al. 1997; Ma 2006; Lutz et al. 2008).
In the Sakhalin region, exports more than tripled, from 340 million dollars in 1997 to 1.06 billion dollars in 2005, and imports expanded eightfold from 310 million dollars to 2.49 billion dollars
18. Crude oil is the major export commodity, and mechanical products are the main import commodity. For example, although the figures are only for two years, the ratio of crude oil of the total exports was 51.0% in 2004 and 56.0% in 2005, and the ratio of mechanical products of the total imports was 40.4% and 59.7%, respectively (Table 3). Therefore, for the Sakhalin region, FDI likely influenced such remarkable expansion of both exports and imports.
2.6 Effect on economic growth
Coupled with the above economic effects of FDI and the results of the synergistic effects, impressive economic growth might also have been generated at the macro level.
For instance, the increase of employment opportunities and the wage increases brought by the improvement of worker production capacities create more domestic demand. This stimulates the production activities of domestic companies, expands trade, and finally produces economic growth. The effect of FDI on such economic growth has been confirmed by numerous studies (Balasubramanyam et al. 1996; de Mello 1997; Mullen and Williams 2005; Greenaway et al. 2007; Ozturk and Kalyoncu 2007
19). In previous studies the GDP growth rate and GDP per capita were used as proxy variables. For example, Balasubramanyam et al. (1996) GDP adopted growth rate as the dependent variable. As its independent variable, they incorporated the accumulated FDI-to-GDP ratio as the proxy variable of the foreign capital stock size and demonstrated that the FDI increase correlates positively to the economic growth of the host country
20. Mullen and Williams (2005) confirmed the positive impact of FDI on economic growth in the U.S. using such FDI indices as the Gross State Product (GSP) per capita and the ratio of the FDI total book
18
Based on Goskomstat RF (2000) and Rosstat (2009b).
19
They confirmed with a Granger Causality Test that in Turkey, FDI and GDP positively impacted each other and in Pakistan GDP positively impacted FDI.
20
However, in countries where they implemented an import substitution policy, the effect of FDI was
insignificant and negative.
value to GSP. Even though the target of this study was the U.S., the figures from official statistics
21show that GRP increased in the Sakhalin region as well. In other words, GRP increased by 10.2% on average between 1999 and 2006, which are the years where FDI inflow into the Sakhalin region increased sharply
22. This suggests that the chances are high to empirically confirm that FDI toward the Sakhalin region positively affected economic growth
23.
2.7 Effect on government finance
When foreign companies enter a region, we expect an increase in corporate taxes from such companies, but an increase in income taxes from workers is also possible. However, as is well known, developing and transitional countries actively attract FDI by temporarily giving such tax incentives as reduction or exemption from corporate taxes to attract foreign companies to receive the above various economic effects of FDI. Yet such political expediency may obfuscate the amount of taxes that need to be paid by foreign companies to the government of the receiving country. Hence, it is not impossible that the tax revenue may be disappointing (Dhanani and Hasnain 2002). In this instance, perhaps the effect of FDI on budget revenues will be highly limited. Actually, according to Figlio and Blonigen (2000), when the size of foreign companies is controlled, an increase in the workforce of foreign manufacturing companies significantly and negatively influenced per capita income.
Regarding the adoption of a Production Sharing Agreement (PSA) to the Sakhalin Project, since it was a part of foreign capital attracting measures, such project specific revenue as royalties and bonuses will enter the Sakhalin region (UNECE 1998; Chistov 1999).
However, the effect of FDI on the revenue expansion of this region may be limited because substantial government revenue was paid from the late 2000s.
21
Based on Rosstat (2005b; 2009b).
22
On the other hand, in Russia, the rate was 7.3%.
23
Ivan Malakhov, the acting Governor of Sakhalin region at the time, commented that “Sakhalins 1 and 2
could be detonators for economic growth”. He also pointed out that the effects of the Sakhalin Project reach a
wide range of areas such as construction and commerce development (article in newspaper Sovetskii Sakhalin
in the Sakhalin region, March 23, 2004). The Takugin Research Institute (at the time) in Japan estimated,
assuming a resource development period of 30 years, that the new annual average of effective demand will be
360 billion yen (article newspaper in Nihon Keizai Shinbun in Japan, December 1, 2004).
2.8 Effect on upgrading and expanding of social capital
We have been discussing the economic effects of FDI. The last point worth discussing about such effects in the Sakhalin region drawn from the descriptive facts is the role of FDI in the expansion of social capital, including infrastructure development. In the Sakhalin region, with the capital for infrastructure development derived from the Sakhalin Project- related companies, a variety of public facilities have been built, including hospitals, schools, bridges, airports, and ports (Thornton 2007)
24. Moreover, with the development of Sakhalin Project-related businesses, a wide range of social capital, represented by commercial facilities such as housing and hotels, was increased
25. As a matter of fact, Sakhalin Energy states that about 280 million dollars were spent on infrastructure development between 2001 and April 2006; this project dragged the economic development of the Sakhalin region forward
26. These actual performances can probably be quantitatively captured as economic effects at the macro level. The improvement of such social capital as infrastructure development is considered domestic investment. However, note that project- operating corporations are largely involved not only in the operating area of business but also in the infrastructure development of the invested region. Therefore, we will establish a different item for the influence on social capital aside from the influence on domestic investment.
We presented the economic effects of FDI on the local economy in the Sakhalin region using eight hypotheses. In summary, positive effects can obviously be expected in the areas of employment, wage levels, domestic investment, trade (exports and imports), economic growth, and upgrading and expanding social capital, while only limited effects on technological levels, productivity, and government finance can be expected. In the next
24
Regarding infrastructure development, I myself frequently heard about it when I was conducting field research in February 2007. For instance, economic journalist V. Gorbunov of a Sakhalin newspaper, Sovetskii Sakhalin, positively evaluated the Sakhalin Project as a whole while he was using infrastructure development as a concrete example, which includes hospitals and small-scale thermal power plants (based on field research conducted in February 2007).
25
From newspaper articles in Sovetskii Sakhalin dated March 23, 2004 and July 14, 2004. The same thing was pointed out in a newspaper article in the Nihon Keizai Shimbun dated December 1, 2004.
26
Within this project, the following are the areas where a large amount of money was spent: 1) road and
bridge development done in April 2003 (172.7 million dollars): 2) financial support for disposing of
unexploded shells and their research (36.76 million dollars): and 3) repair of Nogliki airport (19.11 million
dollars) (Sakhalin Energy 2006).
section, I will examine whether FDI into the Sakhalin region brought economic effects based on the above eight hypotheses.
3. Analytical Method
This section explains the analytical methods used to verify the above hypotheses.
The analysis term was a 10-year period from 1995 to 2005
27. I examined the economic effects of FDI in the Sakhalin region from the conclusion of the treaties regarding Sakhalin Project (Sakhalin 1 and Sakhalin 2), which were a major FDI source in this region as stated in Section 1, until the stage at which Sakhalin 1 actually progressed from the construction of facilities to the production of oil and gas. The term through 2005 was under construction in both projects
28. The implication here is that the economic effects of FDI on the local economy will be different before and after the completion of construction since these oil and natural gas development projects, such as the Sakhalin Project, require a relatively long period for preparation and construction.
Following the discussion in the previous section, the following target items are available for analysis: employment, wage level, technological level, domestic investment, trade activity (exports and imports), economic growth, budget revenues, and social capital.
However, it is seen the high price levels in the Sakhalin region because the region’s real wages are lower than that of Russia but the nominal wage of the former is higher than that of the latter. Therefore, I analyze both real and nominal wages in view of the high price levels in the Sakhalin region.
The objective for the quantitative analysis is to examine one region: Sakhalin.
Therefore, I examine the statistically significant differences of the population mean on the analytical items using the mean value of the Sakhalin region and compare the target regions from a different analytical method from previous studies to the non-availability of the micro data. When the null hypothesis is rejected because the value of the Sakhalin region
27
However, due to data limitations, some items are from the first year of analysis of 1996 or 1997 (Table 4).
28
The treaties for Sakhalins 1 and 2 were signed in June 1995 and 1994 respectively. Sakhalin 1 started to
produce oil and gas and to supply them to the country from October 2005 and started to export oil from
October 2006. However, Sakhalin 2 started to produce oil only in July 1999 and to produce oil and gas all-
year-around from December 2008 (based on home pages of operational corporations in Sakhalin 1
(http://www.sakhalin1.com/en/benefits/torussia.asp) and Sakhalin 2 (http://www.sakhalinenergy.com/)).
equals or is less than the value of the compared regions, I examine whether FDI into the Sakhalin region positively affects the already described analytical items of the local economy. Due to the unavailability of micro data, I take a different approach from previous studies
29.
The analysis follows two steps. First, I conduct a cluster analysis using two variables, divide them into three groups
30, and extract the federal subjects (target comparison regions) that belong to the same group as the Sakhalin region from these three groups. One of the variables used here is the value of the economic development level of the first year of analysis as one early main economic element
31. The second variable is the value of each analytical item out of the nine items explained in the hypotheses from the first year of analysis
32.
Second, I examine the significant differences of the population mean between the mean values of the target comparison regions extracted in the first step and the value of the Sakhalin region. In other words, I will be examining the significant differences of the population mean on the value of the target comparison groups and the value of the Sakhalin region after controlling the early economic elements, which are the regional economic development level and each analytical item that are related to the affluence of such regions.
This involves two more steps.
First, I examine the scale of the FDI inflow
33. I examine the significant difference of population mean on FDI first to quantitatively confirm why a large amount of foreign capital was invested in the Sakhalin region. I do this not only by looking at the FDI inflow into it from the stated statistical data but also by verifying that its value was significantly larger from a statistical point in comparison to the target comparison groups whose economic development levels were at the same level in the early economic element.
29
However I do not necessarily mean that the causality was resolved by the result of this analysis.
30
To secure a certain number of samples and the characteristics of groups, there are three groups.
31
However, the value of the economic development level from the first year matches the first year values of each analytical item.
32
As a result of cluster analysis, the same regions were extracted for wage levels (real and nominal), domestic investment, economic growth, and social capital.
33
There are three FDI indices: FDI cumulative amount, cumulative FDI per capita, and the ratio of foreign
fixed capital investment to domestic fixed capital investment.
Next, I examine the significant differences of the population mean about the FDI indices. After confirming the size of FDI’s presence in Sakhalin, I examine the significant differences of the population mean of each analytical item and confirm whether the value of the Sakhalin region is significantly larger in a statistical sense than the target comparison groups.
I follow through with the above two steps. If the statistically significant result is that the value of the Sakhalin region is higher than other target comparison groups shown for FDI and is similarly shown for each item for analysis, I conclude that a large amount of FDI inflow into the Sakhalin region positively impacted such items, although the causal relationship of the economic effects of FDI on the local economy was not necessarily examined from the result.
4. Result
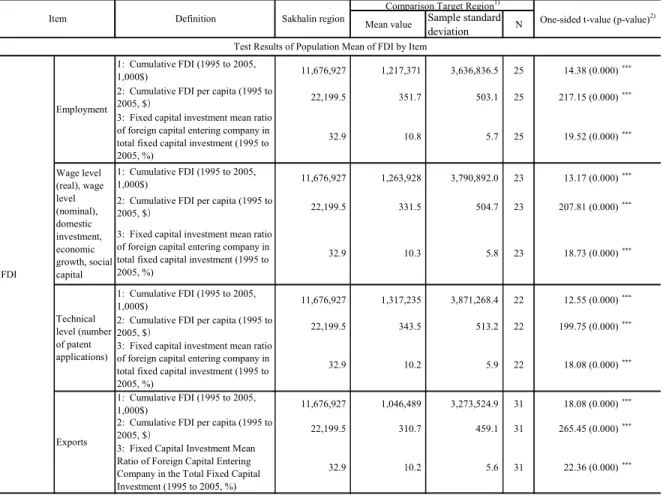
Table 4 shows the definition and analysis result of each analytical item and the details of the target comparison regions. First, I discuss the result of the first step. The statistical significance of the value of the Sakhalin region was confirmed at the 1% level and less on all the FDI indices in all analytical items. In comparison to the target comparison groups, Sakhalin region received a significantly large amount of FDI.
Next, regarding the result of the second step, Sakhalin had statistically significant larger values below the 5% level on nominal wage levels, domestic investment, imports, economic growth, and social capital and below the 10% level on exports. This suggests that on the items where significance was confirmed, positive impacts were possibly brought to the Sakhalin economy due to large FDI inflow. On the other hand, a significant result was not attained on employment, real wage levels, technological levels, and budget revenue.
The following can be pointed out regarding the items in which the economic influence
of FDI was not confirmed. First, as mentioned in the second section, the influence of FDI
on employment varied depending on the industry (Axarloglou and Pournarakis 2007). In
regards to this, the main industry for FDI in Sakhalin was the resource development sector,
which is a capital intensive industry that does not need large manpower. Hence, it would
not necessarily increase employment in the whole region. But as mentioned in Section 2,
the Sakhalin Project created 22,000 instances of direct employment in 2006 in two areas:
the Nogliki district (Sakhalin Project development site) and the Korsakov district (oil export terminal for Sakhalin 2 and the LNG plant construction site)
34. However, even if employment increases, if the investment activities of local companies were restrained by the influence of FDI, there could be a FDI crowding-out effect where these companies reduce hiring. Therefore, the net employment creation effect might not have significantly affected the result because this crowding-out effect outpaced the crowding-in effect.
Next, the reason the effect on the technological level could not be detected can be attributed to the nonconformity of the proxy variables used for characterizing and analyzing the FDI inflow in the Sakhalin region. As mentioned before, the technology used for resource development like the Sakhalin Project is extremely specialized and the areas are limited where new technology can be developed and existing technology can be transferred or diverted. If the FDI impact affects patent applications, it is merely the tip of the so-called iceberg, and a spillover effect of FDI on technological levels might be manifested.
Therefore, I analyzed patent applications as a proxy variable in the track of Cheung and Lin (2004). Probably because the majority of FDI into Sakhalin was related to resource development, this characteristic did not lead to spillover effects in technological levels using the above proxy variable. Further improvement is necessary of this point.
As for budget revenues, the progress of the Sakhalin Project and the change in the distribution of revenue from such projects among central and local governments probably influenced the analysis, explaining why a FDI effect was not observed. In other words, in agreements related to the Sakhalin Project, on top of the regular corporate income tax (corporate profit tax), the project implementing bodies are supposed to pay the royalties for resource development that become the regional government’s own financial resource. They also supplement the bonus- and infrastructure development-related expenses that are paid to the Sakhalin Development Fund. These payments actually did not grow until the production was well under way in the late 2000s
35. In addition, the revenue distribution ratio of the project among the central and local governments was modified in favor of the central
34
Based on materials presented by the Sakhalin Office of the Hokkaido Government.
35
Based on data presented by the Sakhalin Office of the Hokkaido Government.
government, so the direct income to the Sakhalin region government was not as high as was expected at the project’s beginning
36. For this reason, the effect of FDI on budgeted revenue is insufficient to label it a macroeconomic effect in the period of this analysis.
Last, as for the wage level where different analysis results were derived, on one hand, Sakhalin’s nominal wage level was statistically larger and significant; but on the other hand, real wages were not significant. This indicates that Sakhalin’s price level was so high that it offset the nominal wage growth.
Table 4 Regional Economic Effects of FDI in Sakhalin Region Compared to Other Regions
Mean value Sample standard
deviation N
1: Cumulative FDI (1995 to 2005,
1,000$) 11,676,927 1,217,371 3,636,836.5 25 14.38 (0.000)***
2: Cumulative FDI per capita (1995 to
2005, $) 22,199.5 351.7 503.1 25 217.15 (0.000)***
3: Fixed capital investment mean ratio of foreign capital entering company in total fixed capital investment (1995 to 2005, %)
32.9 10.8 5.7 25 19.52 (0.000)***
1: Cumulative FDI (1995 to 2005,
1,000$) 11,676,927 1,263,928 3,790,892.0 23 13.17 (0.000)***
2: Cumulative FDI per capita (1995 to
2005, $) 22,199.5 331.5 504.7 23 207.81 (0.000)***
3: Fixed capital investment mean ratio of foreign capital entering company in total fixed capital investment (1995 to 2005, %)
32.9 10.3 5.8 23 18.73 (0.000)***
1: Cumulative FDI (1995 to 2005,
1,000$) 11,676,927 1,317,235 3,871,268.4 22 12.55 (0.000)***
2: Cumulative FDI per capita (1995 to
2005, $) 22,199.5 343.5 513.2 22 199.75 (0.000)***
3: Fixed capital investment mean ratio of foreign capital entering company in total fixed capital investment (1995 to 2005, %)
32.9 10.2 5.9 22 18.08 (0.000)***
1: Cumulative FDI (1995 to 2005,
1,000$) 11,676,927 1,046,489 3,273,524.9 31 18.08 (0.000)***
2: Cumulative FDI per capita (1995 to
2005, $) 22,199.5 310.7 459.1 31 265.45 (0.000)***
3: Fixed Capital Investment Mean Ratio of Foreign Capital Entering Company in the Total Fixed Capital Investment (1995 to 2005, %)
32.9 10.2 5.6 31 22.36 (0.000)***
Sakhalin region
Item Definition
Employment
Exports FDI
One-sided t-value (p-value)2) Test Results of Population Mean of FDI by Item
Wage level (real), wage level (nominal), domestic investment, economic growth, social capital
Technical level (number of patent applications)
Comparison Target Region1)
36
In fact, the portion of the central government of the royalties from oil development increased from 40% to
95%. Similarly, royalties from natural gas development increased from 40% to 100%. As a result, the portion
of local government decreased dramatically (Newspaper Ekonomika i Zhizn in Russia, No. 21, May 2000,
and the Russian Federal Law “O vnesenii izmenenii v Biudzhetnyi Kodeks Rossiiskoi Federatsii v chasti
regulirovaniia mezhbiudzhetnykh otnosheni” No. 120-FZ in 2004).
Table 4 Regional Economic Effects of FDI in Sakhalin Region Compared to Other Regions (Continued)
1: Cumulative FDI (1995 to 2005,
1,000$) 11,676,927 1,317,235 3,871,268.4 22 12.55 (0.000)***
2: Cumulative FDI per capita (1995 to
2005, $) 22,199.5 343.5 513.2 22 199.75 (0.000)***
3: Fixed capital investment mean ratio of foreign capital entering company in total fixed capital investment (1995 to 2005, %)
32.9 10.2 5.9 22 18.08 (0.000)***
1: Cumulative FDI (1995 to 2005,
1,000$) 11,676,927 216,745 529,123.1 55 160.63 (0.000)***
2: Cumulative FDI per capita (1995 to
2005, $) 22,199.5 182.2 330.9 55 493.49 (0.000)***
3: Fixed capital investment mean ratio of foreign capital entering company in total fixed capital investment (1995 to 2005, %)
32.9 6.8 6.3 55 30.57 (0.000)***
Employment -1.8 -0.3 1.0 25 -7.36 (0.999)
Wage level
(real) 9.4 9.5 1.8 23 -0.15 (0.345)
Wage level
(nominal) 33.9 32.7 2.5 23 2.16 (0.016)**
Technologic
al level 0.004 0.046 0.024 22 -8.33 (0.999)
Domestic
investment 73.4 33.9 6.1 23 30.94 (0.000)***
Exports 8,710.8 7,503.2 5,096.0 31 1.32 (0.094)*
Import 9,587.6 2,643.6 3,565.7 22 9.13 (0.000)***
Economic
Growth 13.1 6.7 2.6 23 11.70 (0.000)***
Government
Finance 18.8 22.7 9.8 55 -2.98 (0.999)
Social
Capital 20.3 6.8 1.4 23 47.70 (0.000)***
Source: Created by author using various statistics from Russian government statistics office (Rosstat).
Import
Employment increase/decrease mean ratio (1995 to 2005, %)
FDI
Cumulativive export amount per capita (1997 to 2005,
$)
Cumulativive import amount per capita (1997 to 2005, $)
Real GDP increase /decrease mean ratio per capita (1996 2005, %)
Government finance
Cumulative number of patent applications per number of companies (1997 to 2005, cases)
Increase/decrease mean ratio of domestic fixed capital investment (1996 to 2005, %)
Mean monthly real wage increase/decrease mean ratio (1996 to 2005, %)
Mean monthly nominal wage increase/decrease mean ratio (1996 to 2005, %)
Test Results of Population Mean by Item
Mean ratio of revenue to GRP (1995 to 2005, %) Ratio of construction sector to GRP (1995 to 2005, ruble)
Note: 1) Following are target regions for comparison of each item. Region names are based on names of federal subjects (region) on January 1, 2009.
Employment: 25 regions: Lipetsk region, Yaroslavl region, Moscow, Republic of Karelia, Republic of Komi, Arkhangelsk region, Vologda region, Murmansk region, Saint-Petersburg, Republic of Bashkortostan, Republic of Tatarstan, Perm territory, Samara region, Sverdlovsk region, Republic of Khakassia, Krasnoyarsk territory, Irkutsk region, Kemerovo region, Omsk region, Tomsk region, Republic of Sakha (Yakutia), Primorsky territory, Khabarovsk territory, Kamchatka territory, and Magadan region.
Wage level (real), wage level (nominal), domestic investment, economic growth and social capital: 23 regions: Yaroslavl region, Moscow, Republic of Komi, Arkhangelsk region, Vologda region, Murmansk region, St. Petersburg, Republic of Bashkortostan, Republic of Tatarstan, Perm territory, Samara region, Sverdlovsk region, Chelyabinsk region, Krasnoyarsk territory, Irkutsk region, Kemerovo region, Omsk region, Tomsk region, Republic of Sakha (Yakutia), Khabarovsk territory, Amur region, Kamchatka territory, Magadan region.
2) *** means significant at 1% level, ** 5% level, and * at 10% level.
Technical level: 22 regions: Moscow, Republic of Komi, Arkhangelsk region, Vologda region, Murmansk region, St. Petersburg, Republic of Bashkortostan, Republic of Tatarstan, Perm territory. Samara region, Sverdlovsk region, Chelyabinsk region, Krasnoyarsk territory, Irkutsk region, Kemerovo region, Omsk region, Tomsk region, Republic of Sakha (Yakutia), Khabarovsk territory, Amur region, Kamchatka territory, Magadan region.
Exports: 31 regions: Lipetsk region, Yaroslavl region, Moscow, Republic of Karelia, Republic of Komi, Arkhangelsk region, Vologda region, Murmansk region, Saint-Petersburg, Republic of Bashkortostan, Republic of Tatarstan, Republic of Udmurtia, Perm territory, Nizhny Novgorod region, Orenburg region, Samara region, Sverdlovsk region, Chelyabinsk region, Republic of Khakassia, Krasnoyarsk territory, Krasnoyarsk territory, Irkutsk region, Kemerovo region, Novosibirsk region, Omsk region, Tomsk region, Republic of Sakha (Yakutia), Primorsky territory, Khabarovsk territory, Amur region, Kamchatka territory, Magadan region.
Imports: 22 regions: Moscow, Republic of Komi, Arkhangelsk region, Vologda region, Murmansk region, Saint-Petersburg, Republic of Bashkortostan, Rebublic of Tatarstan, Perm territory, Samara region, Sverdlovsk region, Chelyabinsk region, Krasnoyarsk territory, Irkutsk region, Kemerovo region, Omsk region, Tomsk region, Republic of Sakha (Yakutia), Khabarovsk territory, Amur region, Kamchatka territory, Magadan region.
Government finance: 55 regions: Belgorod region, Bryansk region, Vladimir region, Ivanovo region, Kaluga region, Kostroma region, Kursk region, Lipetsk region, Orel region, Ryazan region, Smolensk region, Tambov region, Tver region, Tula region, Yaroslavl region, Republic of Karelia, Arkhangelsk region, Vologda region, Kaliningrad region, Leningrad region, Murmansk region, Novgorod region, Pskov region, Republic of Adygea, Republic of Dagestan, Republic of Ingushetia, Republic of Kabardino-Balkaria, Republic of Kalmykia, Republic of Karachaevo-Cherkessia, Republic of Northen Osetia-Alania, Astrakhan region, Republic of Marii El, Republic of Mordovia, Republic of Udmurita, Republic of Chuvashia, Kirov region, Orenburg region, Penza region, Ulyanovsk region, Kurgan region, Republic of Altay, Republic of Buryatia, Republic of Tyva, Republic of Khakassia, Omsk region, Tomsk region, Zabaikalsk territory, Republic of Sakha (Yakutia), Primorsky territory, Khabarovsk territory, Amur region, Kamchatka territory, Magadan region, Jewish autonomous area.