Title
Indirect Detection of Ethylene Glycol Oligomers Using a
Contactless Conductivity Detector in Capillary Liquid
Chromatography( 本文(Fulltext) )
Author(s)
TAKEUCHI, Toyohide; SEDYOHUTOMO, Anang; LIM, Lee
Wah
Citation
[Analytical sciences : the international journal of the Japan
Society for Analytical Chemistry] vol.[25] no.[7] p.[851]-[854]
Issue Date
2009-07-10
Rights
The Japan Society for Analytical Chemistry (社団法人日本分析
化学会)
Version
出版社版 (publisher version) postprint
URL
http://hdl.handle.net/20.500.12099/34550
† To whom correspondence should be addressed. E-mail: take-t@gifu-u.ac.jp
Indirect Detection of Ethylene Glycol Oligomers Using a Contactless
Conductivity Detector in Capillary Liquid Chromatography
Toyohide T
AKEUCHI,
†Anang S
EDYOHUTOMO, and Lee Wah L
IMDepartment of Chemistry, Faculty of Engineering, Gifu University, 1-1 Yanagido, Gifu 501–1193, Japan
Ethylene glycol oligomers were visualized by indirect conductimetric detection based on dilution of the mobile phase due to the analytes. A high electrical conductivity background was maintained by the addition of 5 mM sodium nitrate in the mobile phase, and the analytes were visualized by decreases in the background when they eluted. A capacitively coupled contactless conductivity detector was convenient to monitor effluents from the microcolumn with minimum extra-column band broadening. The signals as negative peaks were linear to the concentration of the analytes, and a concentration detection limit of 0.025% was achieved for tetraethylene glycol at S/N=3, corresponding to the mass detection limit of 38 ng for 0.15 μl injection. The logarithm of the retention factor of ethylene glycol oligomers was linear to the degree of polymerization (DP) as well as to the acetonitrile composition in the mobile phase. These situations allowed us to estimate the DP of eluted ethylene glycol oligomers by using a few oligomers with known DP. The dynamic reserve, defined as the ratio of the background to its noise level achieved under the present conditions, was 2.3 × 10⁵ which was much larger than that achieved by UV absorption detection. The present method was applied to profile ethylene glycol oligomers contained in commercially available PEG reagents.
(Received May 4, 2009; Accepted June 8, 2009; Published July 10, 2009)
Introduction
Indirect photometric detection has been successfully utilized in ion chromatography since its introduction,1 in which UV-absorbing eluent ions are replaced by non-UV absorbing analyte ions, leading to negative peaks when they elute. Non-electrolytes can also be visualized by indirect detection when analytes perturb the partitioning equilibrium of the visualization agent.2–4 Indirect photometric detection is useful as an optional detection method when analytes cannot be subjected to UV or fluorometric detection in capillary LC because simple and universal detectors, such as refractive index detectors, are not available.3
The dynamic reserve (DR) is defined as the ratio of the background signal to its noise level, and it plays an important role in indirect detection.5 The achievement of a larger DR leads to better sensitivity. When DR is as large as 105, analytes can be visualized, even if they only dilute the mobile phase. Refractive index detectors work as universal detection methods, since it can achieve DR of 106 or larger.
It is reported that electrical conductimetric detection can achieve a larger DR value, compared with UV-absorption or fluorometric detection.6,7 In our previous work,6 a common conductivity detector with a home-made microflow cell achieved a DR of 9.3 × 10⁴ in capillary LC, and nonelectrolytes could be indirectly detected based on dilution of the mobile phase due to the analytes. The mass sensitivity achieved in the previous work6 was 10 – 32 ng for alcohols. Tanaka and Fritz7 achieved detection limits of 10 – 35 μg for sugars and alcohols by indirect
conductimetric detection in ion-exclusion chromatography with conventional-size columns, in which a DR of (3 – 4)× 103 was achieved. A better mass sensitivity of the former detection system is attributed to the use of microcolumns as well as to a larger DR value achieved. However, our previous detection system for capillary LC was not robust, and the detector signal was sensitive to the environment surrounding the flow cell.6 Recent studies on indirect conductimetric detection using a conventional-size ion chromatography system achieved much better sensitivity, where 0.5 mg/l of the detection limit was reported for methanol.8
Capacitively coupled contactless conductivity detection in the axial electrode configuration was introduced in capillary electrophoresis,9,10 and its applications have been extended to IC, LC, flow-injection analysis, and microchip capillary electrophoresis.11 Instruments are now commercially available, and they are quite powerful in capillary-based separation methods because they provide robust detection and sensitive responses to ionic species.
It is expected that indirect detection with capacitively coupled contactless detection provides a universal detection method for analytes that cannot be subjected to UV or fluorometric detection in capillary LC. It should be noted that capillary handling is flexible for contactless conductivity detection, and on-capillary detection eliminates extra-column band broadening.
The present paper examines a commercially available capacitively coupled contactless conductivity detector for indirect conductimetric detection of non-electrolytes in capillary LC. The detection is based on dilution of the mobile phase due to the analytes. Ethylene glycol oligomers were selected as analytes.
Experimental
Reagents and materialsThe reagents employed were of guaranteed reagent grade, and were obtained from Wako Pure Chemical Industries (Osaka, Japan), Nacalai Tesuque (Kyoto, Japan) or Tokyo Chemical Industry (Tokyo, Japan), unless otherwise noted. HPLC-grade distilled water and acetonitrile were obtained from Wako Pure Chemical Industries, and they were employed for preparing sample solutions and mobile phases. All of the reagents were used as received.
L-column2 ODS microcolumns (5 μm particle diameter) were obtained from Chemicals Evaluation and Research Institute (CERI; Tokyo, Japan), and the packing materials removed from the columns were used for preparing microcolumns.
Apparatus
The chromatographic measurements were carried out by using a μLC system that was constructed by an L.TEX-8301 Micro Feeder (L.TEX Corporation, Tokyo, Japan) equipped with an MS-GAN 050 gas-tight syringe (0.5 ml; Ito, Fuji, Japan) as a pump, a Model M435 microinjection valve with an injection volume of 0.15 μl (Upchurch Scientific, Oak Harbor, WA, USA) as an injector, a 0.53-mm i.d. × 150 mm microcolumn, and a Model TraceDec contactless conductivity detector (Innovative Sensor Technologies, Strasshof, Austria). The electrical conductivity of the mobile phases was measured by a B-173 conductivity meter (Horiba, Kyoto, Japan). The flow-rate of the pump was kept at 10 μl/min. A fused-silica capillary with 75 μm i.d. (GL Sciences, Tokyo, Japan) was inserted into a cell block attached to the conductivity detector. The cell block was then sandwiched between two aluminum blocks (45 × 40 × 14 mm) in order to reduce the effect of any ambient temperature change. The data were acquired by a Chromatopac C-R4A data processor (Shimadzu, Kyoto, Japan). The inlet pressure was monitored by an L.TEX-8150 Pressure Sensor (L.TEX). The microcolumn was prepared from a fused-silica capillary tube (0.53 mm i.d. × 150 mm) using a slurry packing method, previously reported.12
Results and Discussion
Detection of diethylene glycol and tetraethylene glycol
The electrical conductivity background can be maintained by adding ionic chemical species in the mobile phase. Sodium nitrate was selected in this work because the ethylene glycol oligomers can be separated in the reversed-phase mode, where inorganic anions, such as sodium nitrate do not strongly affect the retention of the analytes. In order to achieve a higher DR, the background signal should be kept higher, but less than 1 V, which is the maximum input voltage that can be accepted by the data processor employed in this work. The output signal of the contactless detector was adjusted by the gain of the input signal and the output voltage of the frequency synthesizer. A fused-silica capillary with 75 μm i.d. was selected as the flow cell of the detector in this work, considering the signal intensity and extra-column band broadening in the flow cell, although a larger signal was achieved for the flow cell with larger diameter.
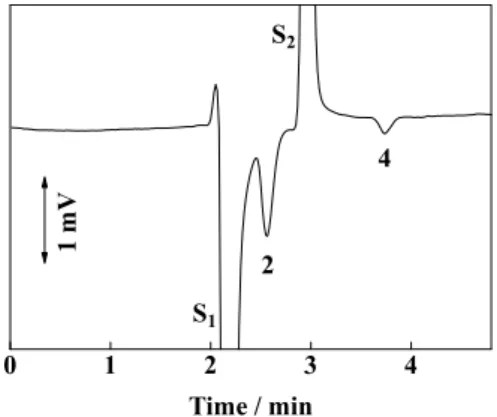
Figure 1 demonstrates the indirect conductimetric detection of diethylene glycol and tetraethylene glycol, as indicated accordingly to their DP, 2 and 4, respectively. A 0.15-μl volume of a sample solution containing 0.5% (w/v) of each ethylene
glycol oligomer was injected, as shown in Fig. 1. It can be seen that both analytes are visualized as negative peaks because they dilute the mobile phase when they elute. The background signal under the conditions in Fig. 1 was 757 mV, and its actual electrical conductivity was 0.54 mS/cm.
Two system peaks can also be observed in the figure. The first system peak, denoted by S1, is due to a water concentration difference between the sample and the mobile phase, whereas the second system peak, denoted by S2, is due to an acetonitrile concentration difference between the sample and the mobile phase. In addition, triethylene glycol was overlapped with the second system peak and it could not be visualized under the conditions given in Fig. 1. It is not certain why a larger signal is achieved for diethylene glycol.
Room temperature was critical to maintain less noise and less drift of the baseline. This is because the electrical conductivity of the background was high and easy to change due to the variation of the surrounding temperature. The cell block was therefore sandwiched between two aluminum blocks (45 × 40 × 14 mm) in order to increase its heat capacity to reduce the effect of an ambient temperature change. In this research the experiments were carried out at room temperature, which was carefully controlled.
Repeatability and linearity of the signal
The repeatability of the retention time and the peak height of tetraethylene glycol were evaluated under the operating conditions in Fig. 1. The noise level was 3.3 μV (corresponding to 2.4 nS/cm) under the conditions given in Fig. 1, and the DR value was calculated to be 2.3 × 10⁵. The above value was about ten-times larger than that achieved by UV detection, e.g. (2 – 3)× 104.13 In previous work using a common conductivity detector with a laboratory-made micro flow cell, the DR achieved was 9.3 × 104.6 The DR achieved by the present detection system was larger by a factor of 2.5, compared to that achieved by the previous system. Furthermore, it should be noted that the previous detection system was sensitive to the environment surrounding the flow cell. In other words, the present detection system is much more robust than that in the previous work.6
The peak height of tetraethylene glycol was linear to concentrations of up to 2% (w/v), and the correlation factor (R2)
Fig. 1 Indirect conductimetric detection of diethylene glycol and tetraethylene glycol. Column, L-column2 ODS, 150 × 0.53 mm i.d.; mobile phase, 10% acetonitrile in 5 mM sodium nitrate (background 757 mV, 0.54 mS/cm); flow rate, 10 μL/min; detector, TraceDec, 75 μm flow cell; analyte, 0.5% (w/v) 2EG and 0.5% 4EG; injection volume, 0.15 μl; the numbers indicate DP of ethylene glycol oligomers; S1 and S2 indicate the system peaks 1 and 2, respectviely.
was 0.9998. The concentration detection limit at S/N = 3 was 0.025% for tetraethylene glycol under the conditions given in Fig. 1. This detection sensitivity corresponds to a mass detection limit of 38 ng for 0.15 μl injection. It can be expected that the peak heights for ethylene glycol oligomers with a larger DP are also linear to the concentration as long as the analytes are visualized based on the same principle.
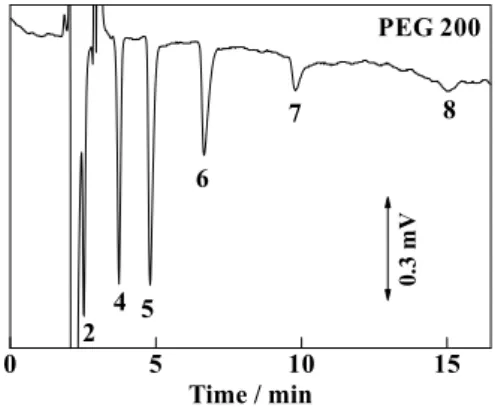
Detection of oligomers in poly(ethylene glycol) reagents Figure 2 demonstrates the detection of ethylene glycol oligomers contained in PEG 200, the nominal average molecular mass of which is 200. The numbers in the figure indicate DP of ethylene glycol oligomers. It can be seen that ethylene glycol oligomers with DP values of 2 to 8 can be visualized, and the signal intensities for tetraethylene glycol (molecular mass 194) and pentaethylene glycol (molecular mass 238) are larger than that of other oligomers. This result is consistent with its nominal average molecular mass, viz., 200.
Since ethylene glycol oligomers with DP values larger than 5 were not available, the identifications of these peaks were presumed from the elution pattern. The DP was estimated from the linear relationships between the logarithm of the retention factor of the ethylene glycol oligomers (log k) and DP as well as between log k and the acetonitrile concentration in the mobile phase, as discussed afterward.
By increasing the acetonitrile composition in the mobile phase, ethylene glycol oligomers with larger DP can be eluted. Figure 3 demonstrates the detection of ethylene glycol oligomers contained in PEG 400, the nominal average molecular mass of which is 400, by using a 16% acetonitrile aqueous solution with 5 mM sodium nitrate as the mobile phase. The numbers in the figure indicate the DP of ethylene glycol oligomers. It can be seen that ethylene glycol oligomers with DP values of 6 (molecular mass 282) to 14 (molecular mass 634) can be visualized and that the signal intensities for heptamer (molecular mass 326), octamer (molecular mass 370) and nonamer (molecular mass 414) are larger than that of other oligomers.
Ethylene glycol oligomers contained in PEG 1000, the nominal average molecular mass of which is 1000, could also be visualized by using a 22% acetonitrile aqueous solution with 5 mM sodium nitrate as the mobile phase, as demonstrated in Fig. 4. The numbers in the figure also indicate the DP of ethylene glycol oligomers. It can be seen from the figure that ethylene glycol oligomers with DP values of 13 (molecular mass 590) to 32 (molecular mass 1422) are visualized, and that
the signal intensities for 20-mer (molecular mass 898) to 23-mer (molecular mass 1030) are larger than that of other oligomers. It should be noted that the present detection system provides a good tool for characterizing ethylene glycol oligomers. This is because the present detection method can achieve a larger DR value, e.g. 2.3 × 10⁵.
Ethylene glycol oligomers can also be visualized by indirect photometric detection using eluents containing an adequate UV-absorbing species.14 In that work the signal intensities of the visualized ethylene glycol oligomers were dependent on the retention factor of both analytes and the UV-absorbing additive. Another disadvantage of the previous indirect photometric detection lay in the fact that the system peak is based on additive interfered with the analytes. Contrarily, the present detection is expected to give nearly the same sensitivity for homologues because the visualization is based on dilution of the mobile phase due to the analytes. Since the non-retained additive can be selected in the present detection system, fewer system peaks appeared due to the electrolytic additive, which could interfere with the analytes.
Retention behavior of ethylene glycol oligomers
We have examined the relationship between log k and the DP for ethylene glycol oligomers using eluents with different
Fig. 2 Indirect conductimetric detection of ethylene glycol oligomers in PEG 200. Operating conditions as in Fig. 1, except for the analyte; analyte, 5% (w/v) PEG 200; the numbers indicate DP of ethylene glycol oligomers.
Fig. 3 Indirect conductimetric detection of ethylene glycol oligomers in PEG 400. Mobile phase, 16% acetonitrile in 5 mM sodium nitrate (background 763 mV, 0.52 mS/cm); analyte, 10% (w/v) PEG 400; the numbers indicate DP of ethylene glycol oligomers; other operating conditions as in Fig. 1.
Fig. 4 Indirect conductimetric detection of ethylene glycol oligomers in PEG 1000. Mobile phase, 22% acetonitrile in 5 mM sodium nitrate (background 750 mV, 0.50 mS/cm); analyte, 10% (w/v) PEG 1000; the numbers indicate DP of ethylene glycol oligomers; other operating conditions as in Fig. 1.
acetonitrile concentrations, as demonstrated in Fig. 5. The water dip was adopted as the non-retained position to calculate the retention factor. It can be seen from the figure that linear relationships between two parameters are achieved for each acetonitrile concentration. It was also found that the retention of ethylene glycol oligomers decreases with increasing acetonitrile concentration in the mobile phase, and the slope of the linear curves decreases with increasing acetonitrile concentration in the mobile phase. In addition, the deviation of the data for DP = 2 from the linear curve may be due to its too-small retention factor.
The effects of the acetonitrile concentration of the mobile phase on the retention of ethylene glycol oligomers are shown in Fig. 6. It has been found that log k is almost linear to the acetonitrile concentration for ethylene glycol oligomers with DP values of 6 – 14. It is not certain why the plots for 10% acetonitrile are slightly deviated from the linear curve. It should be noted again that the estimation of ethylene glycol oligomers eluted from the column was based on linear relationships between log k and DP as well as between log k and the mobile-phase composition.
Poly(ethylene glycol) or its copolymers have been analyzed by various analytical methods involving LC/MS,15 size-exclusion chromatography hyphenated with pyrolysis-GC,16 two-dimensional LC,17 reversed-phase LC,18 LC with aerosol chemiluminescence-based detection,19 etc. Most of these methods are qualitative and sensitive. Contrarily, the present method is neither qualitative, nor sensitive, but simple and universal. It can be an alternative to refractive index detection in capillary LC.
Conclusion
The present indirect conductimetirc detection is neither
qualitative nor sensitive, but simple and universal. The present detection system can be an alternative to refractive index detection in capillary LC, and will be applicable to the detection of nonionic species that have neither a chromophore nor a fluorophore.
References
1. H. Small and T. E. Miller, Jr., Anal. Chem., 1982, 54, 462. 2. K. Hayakawa and A. Yamamoto, Bunseki Kagaku, 1995,
44, 417.
3. T. Takeuchi, Bunseki Kagaku, 2000, 49, 649.
4. T. Takeuchi, S. Watanabe, K. Murase, and D. Ishii, Chromatographia, 1988, 25, 107.
5. S. I. Mho and E. S. Yeung, Anal. Chem., 1985, 57, 2253. 6. T. Takeuchi and T. Miwa, Chromatographia, 1993, 37,
281.
7. K. Tanaka and J. S. Fritz, J. Chromatogr., 1987, 409, 271. 8. S. Ichikawa and H. Miyata, Bunseki Kagaku, 2007, 56,
751.
9. A. J. Zemann, E. Schnell, D. Volgger, and G. K. Bonn, Anal. Chem., 1988, 70, 563.
10. J. A. F. da Silva and C. L. do Lago, Anal. Chem., 1998, 70, 4339.
11. P. Kubánˇ and P. C. Hause, Anal. Chim. Acta, 2008, 607, 15.
12. T. Takeuchi and D. Ishii, J. Chromatogr., 1981, 213, 25. 13. T. Takeuchi and D. Ishii, J. Chromatogr., 1987, 393, 419. 14. T. Takeuchi and D. Ishii, J. Chromatogr., 1987, 403, 324. 15. L. Huang, P. C. Gough, and M. R. DeFelippis, Anal. Chem.,
2009, 81, 567.
16. E. R. Kaal, M. Kurano, M. Geissler, and H.-G. Janssen, J. Chromatogr., A, 2008, 1186, 222.
17. P. Jandera, J. Fischer, H. Lahovska, K. Novotna, P. Cesla, and L. Kolarova, J. Chromatogr., A, 2006, 1119, 3. 18. B. Trathnigg, A. Gorbunov, and A. Skvortsov, J.
Chromatogr., A, 2000, 890, 195.
19. Y. Lv, S. Zhang, G. Liu, M. Huang, and X. Zhang, Anal. Chem., 2005, 77, 1518.
Fig. 5 log k as a function of the degree of polymerization of ethylene glycol oligomers for mobile phases with different acetonitrile concentrations. Operating conditions as in Fig. 1, except for the mobile phase and the analytes; mobile phase, acetonitrile aqueous solution with 5 mM sodium nitrate; acetonitrile concentration, as indicated; analytes, PEG 200, 400 and 1000.
Fig. 6 log k as a function of the acetonitrile concentration in the mobile phase. Operating conditions as in Fig. 1; the numbers indicate the DP values of ethylene glycol oligomers.