)
著者 小杉 健二, 佐藤 威, 阿部 修, 望月 重人, 根本 征樹, 佐藤 篤司
雑誌名 防災科学技術研究所 研究資料
号 265
ページ 1‑59
発行年 2005‑03
URL http://doi.org/10.24732/nied.00001879
*独立行政法人 防災科学技術研究所 雪氷防災研究部門
− 1 −
Meteorological observations were carried out at the Shinjo Branch, Nagaoka Institute of Snow and Ice Studies, NIED in the eight winter seasons from 1996/97 to 2003/04. The observation site (140°18′43″E , 38°47′25″N, 127m a. s. l.) is located in a basin 50km from the Sea of Japan. This report contains daily data of the following meteorological elements: wind speed, wind direction, air temperature, humidity, soil temperature, global solar radiation and long wave radiation, and precipitation. Monthly statistical values are also summarized.
Key words: Meteorological condition, Wind speed, Wind direction, Air temperature, Global solar radiation, Precipitation, Shinjo
新庄における気象観測
(1996/97年〜2003/04年8冬期)
小杉健二*・佐藤 威*・阿部 修*・望月重人*・根本征樹*・佐藤篤司*
Meteorological Data Observed at Shinjo
(1996/97 Winter to 2003/04 Winter)
Kenji KOSUGI, Takeshi SATO, Osamu ABE, Shigeto MOCHIZUKI, Masaki NEMOTO, and Atsushi SATO
Snow and Ice Research Group,
National Research Institute for Earth Science and Disaster Prevention, Japan
Abstract
長岡雪氷防災研究所新庄支所において,1996年12月 から2004年4月までに行われた冬期気象観測結果を報告 する.掲載する気象要素は,風速,風向,気温,湿度,
地温,全天日射量,放射量および降水量である.
当支所における気象観測は,1974年11月以来降積雪 観測および積雪断面観測とともに行っているもので,本 資料とあわせると,2003/04年冬期までの気象,降積雪 及び積雪断面の観測データがすべて刊行されたことにな る.なお,1996/97〜2003/04年の降積雪と積雪断面の 観測データは阿部ほか(2005)により報告される.これら の一覧を表1に示す.
当支所は本観測期間中の2001年に新庄雪氷防災研究支 所から長岡雪氷防災研究所新庄支所へ改称された.本資 料中の表には支所の名称を記しているものがあるが,観 測当時の名称を用いている.
観測期間は,1996年12月から2004年4月までの8冬
期である.
観測場所は,山形県新庄市十日町高壇1400番地にある 防災科学技術研究所長岡雪氷防災研究所新庄支所構内で ある.当支所の地理的位置は,東経140°18′43″,北 緯38°47′25″(世界測地系)であり,標高は127mで ある(図1).図2に当支所構内における気象観測露場の 位置を示す.気象観測のうち,地温測定のみは第1気象 観測露場で,その他の測定は全て第2気象観測露場で行 われた.気象観測露場の広さは,第1が12m×20m,第 2が15m×20mである.第1,2気象観測露場の計測器 の配置をそれぞれ図3,4に示す.
観測方法は,基本的には佐藤ほか(1997)と同様である.
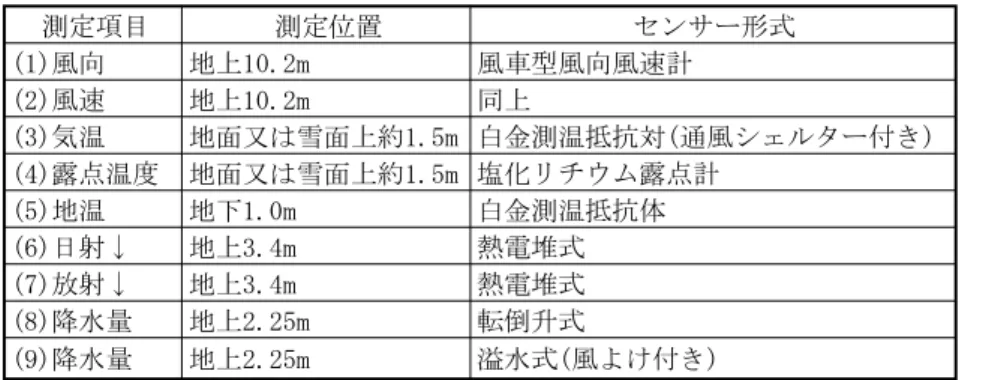
測定項目,位置及びセンサー形式は表2の通りである.
ここで,気温及び露点温度のセンサーのみは,昇降装置 に取り付けられており,感部が地面または雪面上約1.5m に保つように調節した.その他のセンサーの高さは固定 である.データの記録方法は阿部ほか(1997)に記されて 1.はじめに
2.観測期間および場所
3.観測方法
− 2 −
表1 収録冬期と印刷物一覧.表中の右肩の数字は参考文献の番号を示す.
Table 1 List of publications, periods and data observed at the Shinjo Branch.
図1 観測点の位置
Fig. 1 Location of observation site.
図2 第1及び第2気象観測露場 Fig. 2 Two meteorological fields.
図3 第1気象観測露場(12m×20m)の計測器配置図 Fig. 3 Horizontal distribution of sensors in the No.1
meteorological field (12m×20m).
図4 第2気象観測露場(15m×20m)の計測器配置図 Fig. 4 Horizontal distribution of sensors in the No.2
meteorological field (15m×20m).
− 3 − 表2 測定項目,測定位置及びセンサー形式
Table 2 Parameters, positions and sensor types of the meteorological observations.
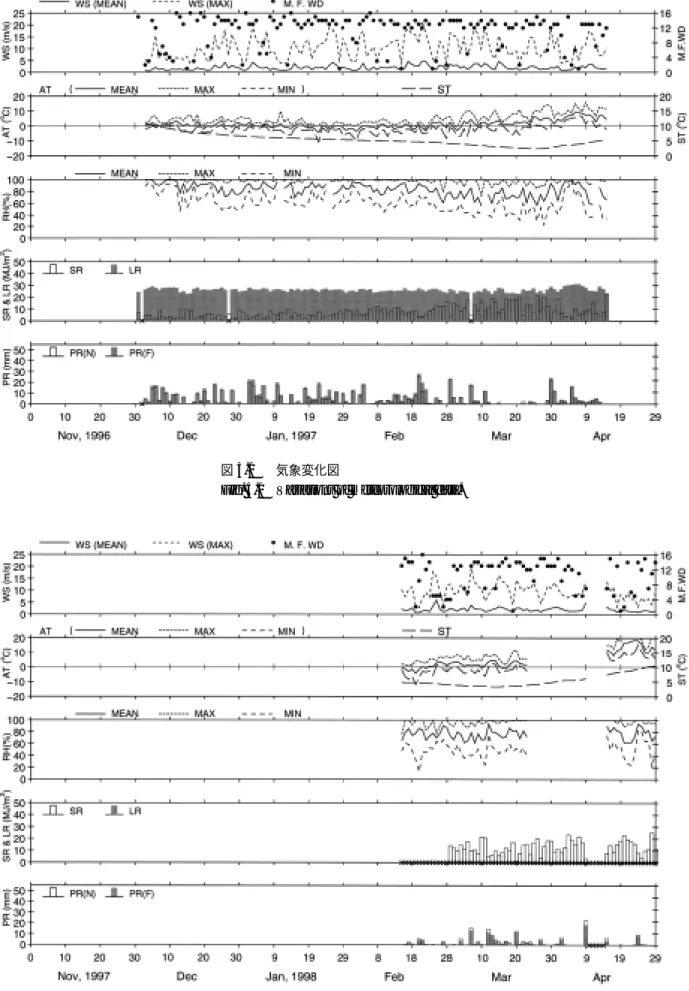
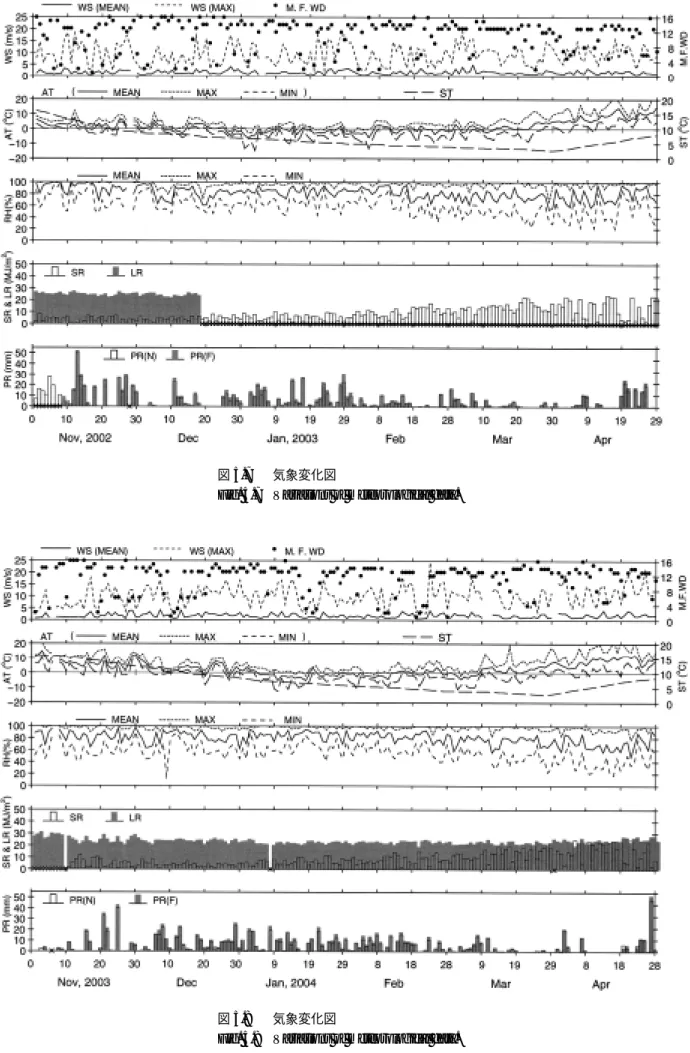
表3 図5で使用する記号と気象要素 Table 3 List of symbols used in Fig. 5.
いる.ただし,気象データ処理装置は1997/98年冬期に 更新した(このためこの冬期は欠測が多い).データの読 取間隔と記録間隔はそれぞれ1分と1時間で,記録は連 続紙とハードディスクに並行してなされる.データの日 界は日本標準時の00時である.
測定項目とその統計値の要点を付録1に記す.
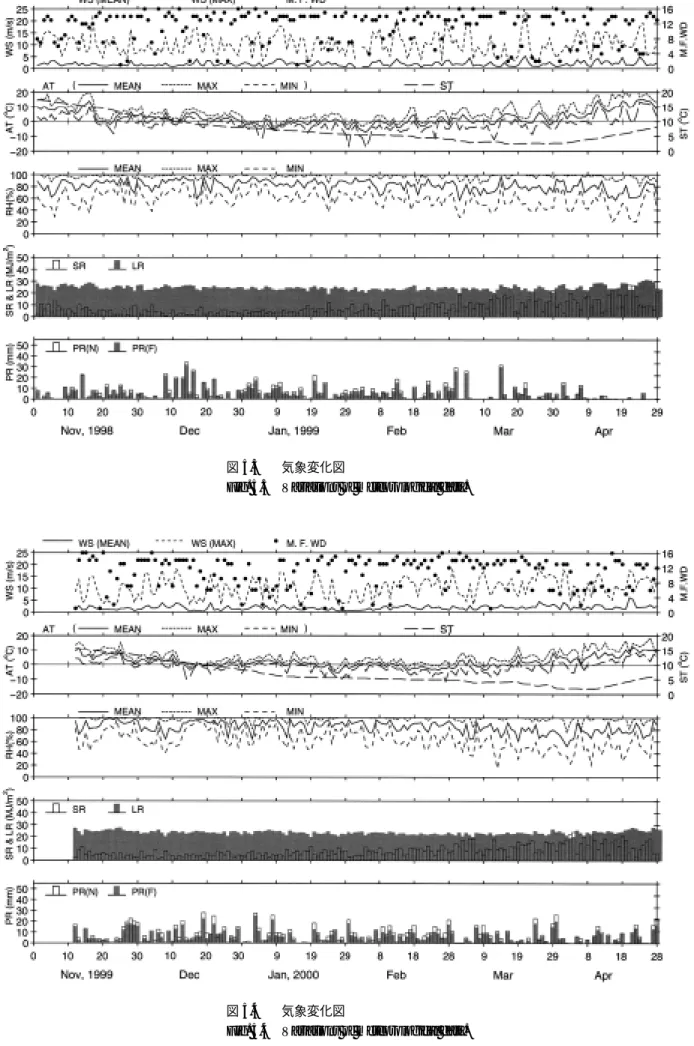
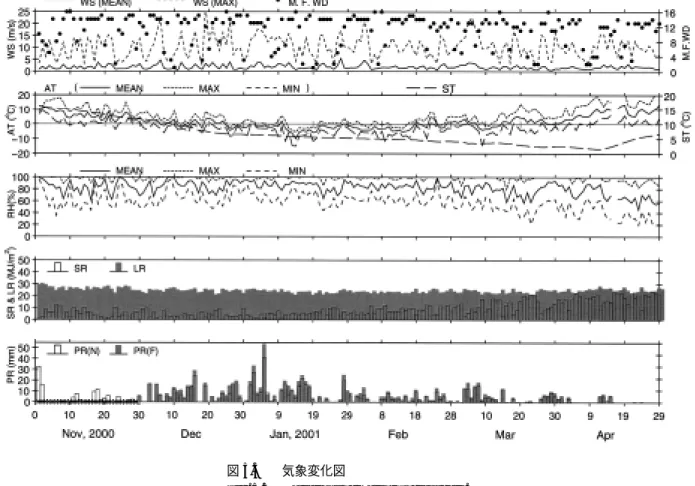
毎日のデータを月毎にまとめたものを付表1.1〜1.44 に示す.一冬毎の気象変化を,データを図化し,図5.1〜 5.8に示す.表3は,図5.1〜5.8で使用する,気象要素 の記号の説明である.表4.1〜4.8は,データの月毎の統 計値を表す.
1996/97〜2003/04年8冬期の気象観測の結果をここ に収録した.今後インターネット上でも公開する予定で ある.
気象観測装置の保守点検は,主に冬期臨時職員の鈴木 克彦,鈴木豊寿両氏によるものです.また,休日の作業 は委託先である双葉建設コンサルタントの小野正光氏ら によるものです.本資料の作成は遅沢弘子さん,高橋弥 生さん及び荒川育恵さんに手伝って頂きました.気象観 測を継続するにあたっては,当支所の歴代支所長ならび に研究職員のご理解とご協力を頂きました.
以上を記して感謝致します.
1)阿部 修・中村秀臣・東浦將夫・沼野夏生・中村 勉(1985):新庄支所における10冬期間の気象・降 積雪観測 その1気象資料編.防災科学技術研究資料,
No.105,121pp.
2)阿部 修・中村秀臣・東浦將夫・沼野夏生・中村 勉(1985):新庄支所における10冬期間の気象・降
積雪観測 その2降積雪編.防災科学技術研究資料,
No.106,76pp.
3)阿部 修・中村秀臣・沼野夏生・東浦將夫・佐藤篤 司・中村 勉(1988):新庄の平地における積雪断面 観測結果(1980/81年〜1987/88年8冬期).防災科 学技術研究資料,No.131,138pp.
4)阿部 修・佐藤 威・小杉健二・佐藤篤司(1997): 新庄における1995/96年冬期の気象積雪観測.防災 科学技術研究所研究資料,No.179,39pp.
5)阿部 修・佐藤 威・小杉健二・望月重人・根本征 樹・佐藤篤司(2005):新庄における降積雪観測およ び積雪断面観測(1996/97〜2003/04年8冬期).防 災科学技術研究所研究資料,No.266,167pp.
6)阿部 修・佐藤 威・佐藤篤司・小杉健二(1996): 新庄の平地における積雪断面観測結果(1988/89年〜
1994/95年7冬期).防災科学技術研究所研究資料,
No.171,140pp.
7)阿部 修・佐藤 威・佐藤篤司・中村秀臣・東浦將 夫・沼野夏生・小杉健二・中村 勉(1996):新庄雪 氷防災研究支所における降積雪観測(1984/85年〜
1994/95年11冬期).防災科学技術研究所研究資料,
No.175,74pp.
8)東浦將夫・阿部 修(1975):新庄の平地積雪断面観 測(昭和48年〜49年冬期).国立防災科学技術セン ター研究速報,No.13,37-54.
9)東浦将夫・阿部 修・中村 勉・中村秀臣(1978): 新庄の平地における積雪断面観測(昭和49年〜50 年冬期).防災科学技術研究資料,No.33,26pp. 10)東浦将夫・阿部 修・沼野夏生(1982):新庄の平地
における積雪断面観測(1975年〜1980年5冬期間). 防災科学技術研究資料,No.70,103pp.
11)佐藤 威・阿部 修(1997):新庄雪氷防災研究支所 における気象観測(1984/85年〜1994/95年11冬期). 防災科学技術研究資料,No.180,167pp.
(原稿受理:2005年3月29日)
4.観測結果
5.終わりに
謝辞
参考文献
1996年12月から2004年4月までの8冬期間,防災科学技術研究所長岡雪氷防災研究所新庄支所(山形県新庄市 十日町高壇1400番地)で行った気象観測の結果を報告した.収録項目は,毎日の風速,風向,気温,湿度,地温,
全天日射量,放射量および降水量である.また,これらの気象要素の月毎の統計値もまとめた.
キーワード:気象,風速,風向,気温,全天日射量,降水量,新庄 要 旨
− 4 −
− 6 − 付録1 測定項目とその統計値の要点(付表1.1〜1.44
参照)
(1) 日別値
欠測の場合は”X”とした.
① 風速・風向
平均風速:1分毎に得られる10分平均風速の日 平均値
最大瞬間風速とそれに対する風向:1分毎に得 られる最大風速のうち日最大の値と,その 起時における10分平均風向
最多風向とその頻度:1分毎に得られる10分平 均風向の日積算頻度の最大となる風向とそ の頻度
なお,着雪氷のため1日中風向・風速計が停 止している場合は欠測扱いとしたが,一部の時 間帯のみ停止している場合は欠測扱いとしなか った.
観測期間中の1997年3月に第2気象観測露 場の冬期季節風主風向の風上側に雪氷防災実験 棟が建設された.その前後において第2気象観 測露場の高度10.2 mに設置されている風速計へ の影響調査を行ったところ,雪氷防災実験棟の 上記風速計への影響はほとんど無視できること が確認された.
② 気温
平均気温:1分毎に得られる5分移動平均値の 日平均値
最高・最低気温:1分毎に得られる5分移動平 均値の日最高・日最低値
③ 相対湿度:②と同様の定義
④ 日射量↓,放射量↓:下向き日射量と下向き放射 量でいずれも当該日の積算値
冠雪を防ぐためブロアーを取り付けているが,
それでも降雪の強い時は手作業で除去したこと もあった.このような日も測定値をそのまま掲 載した.
なお,放射量については,測定方法に起因す る誤差の補正を行ってある(付録2参照).
⑤ 降水量(転倒升式,溢水式):それぞれの雨量計 で測定した当該日の積算値
(2) 月統計値(平均,最大,最小,最多)
付表1.1〜1.44の最下欄のデータ数は統計値を求める 時のデータ数で,欠測があればその月の日数より少なく なる.
① 風速・風向
風速:日平均風速の月平均・月最大・月最小値 最大瞬間風速とその風向:月平均・月最大 値は,それぞれ日最大瞬間風速の月平均・
月最大値.また,これに対応する風向は日 最大瞬間風速の起日における風向.
最多風向:日毎の最多風向のうち,もっとも頻
度が大きいもの
② 気温:日平均・日最高・日最低気温毎の月平均・
月最高・月最低値
③ 相対湿度:日平均・日最高・日最低相対湿度毎の 月平均・月最高・月最低値
④ 平均地温:日平均地温の月平均・月最高・月最低 値
⑤ 日射量↓,放射量↓:日積算値の月積算・月平 均・月最大・月最小値
⑥ 降水量(転倒升式,溢水式):⑤と同様の定義 付録2 放射量の測定誤差とその補正方法について
気象月報に掲載した放射量↓は英弘精器(株)製の赤外 放射計(MS201型またはMS202型)で測定したものであ る.この放射計の受感部に入射する放射量をLin,受感部 が射出する放射量をLoutとすると,受感部が正味受け取 る放射量Lnetは
Lnet= Lin- Lout (A1)
であるから(付図1),
Lin= Lnet+ Lout (A2)
となる.Lnetは基準点との間の伝導熱とバランスし,受感 部と基準点との間の温度差を熱電堆で測定して得られる 起電力Vacから求めることができる(付図2).また,Lout
は受感部の温度Tに相当する黒体放射量σT4(σはステ ファン・ボルツマン定数)であり,Tは付図2のサーミ スタによって測定することができる.従って(A2)式は
Lin= Vac/S + σT4 (A3) となる.ただし,Sは感度定数である.
一方,現在の測定方法は簡易的なもので,σT4に相当 する電圧Vbcを付図2の補償回路で作り,AB間の電圧 Vabを測定して
L'in= Vab/S (A4)
より放射量を求めている.ここで(A4)式は
L'in= Vac/S + Vbc/S (A5) となり,(A5)式と(A3)式より
L'in= Lin - σT4+ Vbc/S (A6)
付図1 受感部における放射の出入り
Fig. A1 Incoming and outgoing radiation at the sensor of the pyrradiometer.
− 7 − が得られる.(A6)式において
σT4= Vbc/S (A7) ならばL'in= Linとなり,(A4)式による簡易的な測定方法 でも放射量は正しく測定される.
通常の保守点検時には,T≒20℃において(A7)式が成 り立つように補償回路のrの調整を行っている.たとえ ばT=20℃のときのサーミスタの抵抗値RTは12.26 kΩで あるから,(A7)式よりVbc,20=1.43 mV(S=3.42 mV/(kW/
m2)として)とならなければならない.補償回路では Vbc= 3×────────r (A8)
R + 10000 + 50 ただし
1 1 1
─= ──+ ──── (A9)
R RT 35700
であるから,T = 20℃のときはr = 9.15Ωと調整される.
Tが20℃より離れるにつれてVbc/SはσT4からずれる ようになる.このことによる放射量の測定誤差δLを以 下で検討する.
δL = L'in - Lin= Vbc/S - σT4 (A10) と定義すると,任意の温度Tの場合,サーミスタの抵抗 値RTは既知であるので(A9)式よりRが求まり,さらに (A8)式においてr = 9.15ΩとしてVbcが求まり,(A10)式 より放射量の測定誤差が得られる.付図3はこのように して求めた放射量の測定誤差δLと受感部温度Tの関係 で,図の上に示した式は回帰式である.
この関係を利用して(A4)式で求めた放射量を補正して 気象月報(付表1.1〜1.44)に掲載した.ただし,1996/
1997年冬期に対しては,Tとして日平均気温を用いて日 積算放射量を補正した.また,1998/1999年冬期以降に 対しては,Tとして時平均気温を用いて時積算放射量を 補正した後に日積算放射量を求めた.
付図2 放射計の回路構成
Fig. A2 Electric circuit of the pyrradiometer.
付図3 放射量の測定誤差δLと受感部温度Tの関係 Fig. A3 Relation between the error in long wave radiation
measurement, δL, and the temperature of the sensor, T.
− 8 − 図5.1 気象変化図
Fig. 5.1 Variations of meteorological data.
図5.2 気象変化図
Fig. 5.2 Variations of meteorological data.
− 9 − 図5.3 気象変化図
Fig. 5.3 Variations of meteorological data.
図5.4 気象変化図
Fig. 5.4 Variations of meteorological data.
− 10 − 図5.5 気象変化図
Fig. 5.5 Variations of meteorological data.
図5.6 気象変化図
Fig. 5.6 Variations of meteorological data.
− 11 − 図5.7 気象変化図
Fig. 5.7 Variations of meteorological data.
図5.8 気象変化図
Fig. 5.8 Variations of meteorological data.
− 12 −
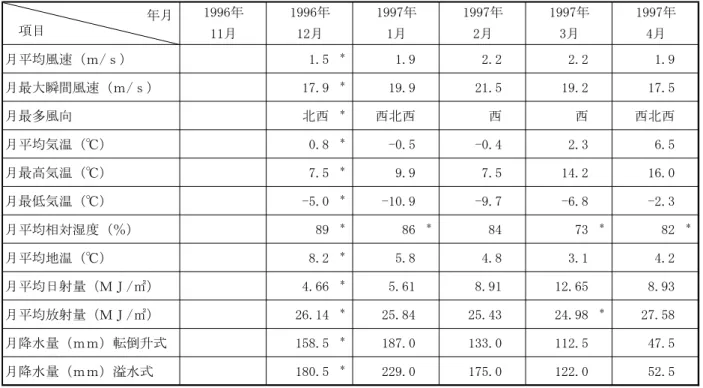
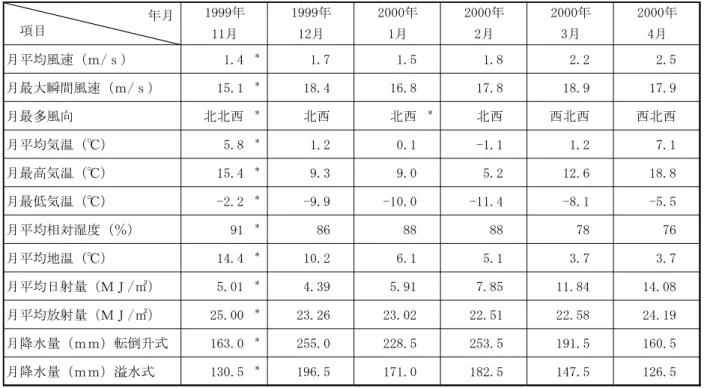
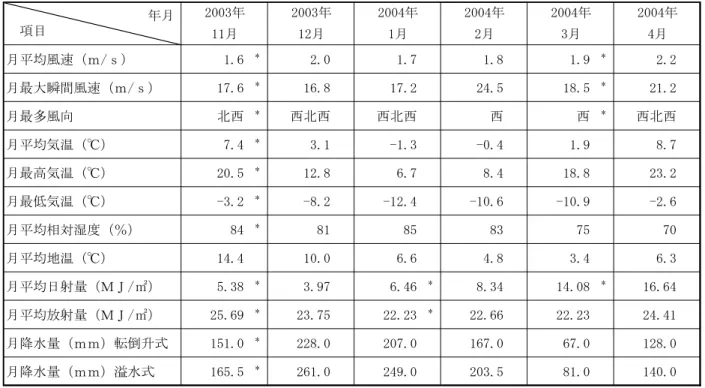
表4.1 月毎の気象統計値.(*印は欠測があり,欠測を除いて求めた統計値を示す.詳細は付表1を参照)
Table 4.1 Monthly meteorological data. The asterisks show that a part of the daily data of the month is missing and that the statistical value is calculated with acquired data. See Table A1.
表4.2 月毎の気象統計値.(*印は欠測があり,欠測を除いて求めた統計値を示す.詳細は付表1を参照)
Table 4.2 Monthly meteorological data. The asterisks show that a part of the daily data of the month is missing and that the statistical value is calculated with acquired data. See Table A1.
− 13 −
表4.3 月毎の気象統計値.(*印は欠測があり,欠測を除いて求めた統計値を示す.詳細は付表1を参照)
Table 4.3 Monthly meteorological data. The asterisks show that a part of the daily data of the month is missing and that the statistical value is calculated with acquired data. See Table A1.
表4.4 月毎の気象統計値.(*印は欠測があり,欠測を除いて求めた統計値を示す.詳細は付表1を参照)
Table 4.4 Monthly meteorological data. The asterisks show that a part of the daily data of the month is missing and that the statistical value is calculated with acquired data. See Table A1.
− 14 −
表4.5 月毎の気象統計値.(*印は欠測があり,欠測を除いて求めた統計値を示す.詳細は付表1を参照)
Table 4.5 Monthly meteorological data. The asterisks show that a part of the daily data of the month is missing and that the statistical value is calculated with acquired data. See Table A1.
表4.6 月毎の気象統計値.(*印は欠測があり,欠測を除いて求めた統計値を示す.詳細は付表1を参照)
Table 4.6 Monthly meteorological data. The asterisks show that a part of the daily data of the month is missing and that the statistical value is calculated with acquired data. See Table A1.
− 15 −
表4.7 月毎の気象統計値.(*印は欠測があり,欠測を除いて求めた統計値を示す.詳細は付表1を参照)
Table 4.7 Monthly meteorological data. The asterisks show that a part of the daily data of the month is missing and that the statistical value is calculated with acquired data. See Table A1.
表4.8 月毎の気象統計値.(*印は欠測があり,欠測を除いて求めた統計値を示す.詳細は付表1を参照)
Table 4.8 Monthly meteorological data. The asterisks show that a part of the daily data of the month is missing and that the statistical value is calculated with acquired data. See Table A1.
− 16 − 付表1.1気象月報 Table A1.1Monthly report of meteorological data.
− 17 − 付表1.2気象月報 Table A1.2Monthly report of meteorological data.
− 18 − 付表1.3気象月報 Table A1.3Monthly report of meteorological data.
− 19 − 付表1.4気象月報 Table A1.4Monthly report of meteorological data.
− 20 − 付表1.5気象月報 Table A1.5Monthly report of meteorological data.
− 21 − 付表1.6気象月報 Table A1.6Monthly report of meteorological data.
− 22 − 付表1.7気象月報 Table A1.7Monthly report of meteorological data.
− 23 − 付表1.8気象月報 Table A1.8Monthly report of meteorological data.
− 24 − 付表1.9気象月報 Table A1.9Monthly report of meteorological data.
− 25 − 付表1.10気象月報 Table A1.10Monthly report of meteorological data.
− 26 − 付表1.11気象月報 Table A1.11Monthly report of meteorological data.
− 27 − 付表1.12気象月報 Table A1.12Monthly report of meteorological data.
− 28 − 付表1.13気象月報 Table A1.13Monthly report of meteorological data.
− 29 − 付表1.14気象月報 Table A1.14Monthly report of meteorological data.
− 30 − 付表1.15気象月報 Table A1.15Monthly report of meteorological data.
− 31 − 付表1.16気象月報 Table A1.16Monthly report of meteorological data.
− 32 − 付表1.17気象月報 Table A1.17Monthly report of meteorological data.
− 33 − 付表1.18気象月報 Table A1.18Monthly report of meteorological data.
− 34 − 付表1.19気象月報 Table A1.19Monthly report of meteorological data.
− 35 − 付表1.20気象月報 Table A1.20Monthly report of meteorological data.
− 36 − 付表1.21気象月報 Table A1.21Monthly report of meteorological data.
− 37 − 付表1.22気象月報 Table A1.22Monthly report of meteorological data.
− 38 − 付表1.23気象月報 Table A1.23Monthly report of meteorological data.
− 39 − 付表1.24気象月報 Table A1.24Monthly report of meteorological data.
− 40 − 付表1.25気象月報 Table A1.25Monthly report of meteorological data.
− 41 − 付表1.26気象月報 Table A1.26Monthly report of meteorological data.
− 42 − 付表1.27気象月報 Table A1.27Monthly report of meteorological data.
− 43 − 付表1.28気象月報 Table A1.28Monthly report of meteorological data.
− 44 − 付表1.29気象月報 Table A1.29Monthly report of meteorological data.
− 45 − 付表1.30気象月報 Table A1.30Monthly report of meteorological data.
− 46 − 付表1.31気象月報 Table A1.31Monthly report of meteorological data.
− 47 − 付表1.32気象月報 Table A1.32Monthly report of meteorological data.
− 48 − 付表1.33気象月報 Table A1.33Monthly report of meteorological data.
− 49 − 付表1.34気象月報 Table A1.34Monthly report of meteorological data.
− 50 − 付表1.35気象月報 Table A1.35Monthly report of meteorological data.
− 51 − 付表1.36気象月報 Table A1.36Monthly report of meteorological data.
− 52 − 付表1.37気象月報 Table A1.37Monthly report of meteorological data.
− 53 − 付表1.38気象月報 Table A1.38Monthly report of meteorological data.
− 54 − 付表1.39気象月報 Table A1.39Monthly report of meteorological data.
− 55 − 付表1.40気象月報 Table A1.40Monthly report of meteorological data.
− 56 − 付表1.41気象月報 Table A1.41Monthly report of meteorological data.
− 57 − 付表1.42気象月報 Table A1.42Monthly report of meteorological data.
− 58 − 付表1.43気象月報 Table A1.43Monthly report of meteorological data.
− 59 − 付表1.44気象月報 Table A1.44Monthly report of meteorological data.