744
IEICE TRANS. FUNDAMENTALS, VOL.E104–A, NO.4 APRIL 2021
PAPER
Evaluation of Temporal Characteristics of Olfactory Displays with Different Structures
Masaaki ISEKI†a),Nonmember andTakamichi NAKAMOTO†b),Member
SUMMARY An olfactory display is a device to present smells. Tempo- ral characteristics of three types of olfactory displays such as one based upon high-speed switching of solenoid valves, desktop-type one based on SAW atomizer and wearable-type one based on SAW atomizer were evaluated us- ing three odorants with different volatilities. The sensory test revealed that the olfactory displays based on SAW atomizer had the presentation speeds faster than that of solenoid valves switching. Especially, the wearable one had an excellent temporal characteristic. These results largely depend on the difference in the odor delivery method. The data obtained in this study provides basic knowledge when we make olfactory contents.
key words: olfactory display, VR contents, temporal characteristics, sen- sory evaluation, PID monitor
1. Introduction
At present, study on human interfaces is undergoing great development, and human interfaces for vision and audition are at a mature stage. Meanwhile, research and development on the human olfactory interface is still ongoing. However, related study is being performed around the world and will be able to make significant progress in the future. The hu- man olfactory interface controls the interaction of olfactory information between humans and machines.
An olfactory display is a device that generates desired odor and presents it to a human according to a command from a device such as a computer[1]. In addition, we can control the recipe of odors when people use a multi-component ol- factory display. There have been so far olfactometers[2]that generate odor and allow a human to smell them. However, olfactometers are limited to the fields such as medicine and physiology. Since they are too bulky and too expensive in the realm of virtual reality (VR), there is a demand for a device that is small, simple, and can easily present various odors. Then, the olfactory display is expected to be used by ordinary people.
We have developed multi-component olfactory displays based upon various architectures, and created some VR con- tents: “Movie with Scents”[3], “Cooking Up an Interactive Olfactory Game Display”[4]and “Virtual Ice Cream Shop”
[5]. Demonstrating these VR contents, we have always en- countered the problem of remaining residual odor even if
Manuscript received March 11, 2020.
Manuscript revised July 26, 2020.
Manuscript publicized September 29, 2020.
†The authors are with IIR, Tokyo Institute of Technology, Yokohama-shi, 226-8503 Japan.
a) E-mail: [email protected] b) E-mail: [email protected]
DOI: 10.1587/transfun.2020EAP1028
olfactory stimulus affects the impression of content very much. Although we have several architectures of olfactory displays, no quantitative study to evaluate the speed of odor presentation has been so far performed yet.
We tried to evaluate an odor delivery method through the experiments on the three olfactory displays in this study.
A tube is used for odor delivery of the olfactory display based on solenoid valves (abbreviation; the SV), whereas the air flow is used in the desktop olfactory display based on sur- face acoustic wave (SAW) atomizer (abbreviation; the DS) and the wearable olfactory display based on SAW atomizer (abbreviation; the WS).
However, the distance to the user’s nose in the DS is much larger than that in the WS, and thus, odor delivery time is different. Although the odor generation method of the SV is different from those of the DS and the WS, the odor can be instantaneously switched using that method. Thus, the speed of odor presentation is mainly governed by the odor delivery method (system).
Thus, the purpose of this study is to investigate the temporal characteristics of olfactory displays with different odor delivery methods using the same sensory evaluation.
2. Related Works
Study on olfactory displays has been published for some time, but in recent years small and wearable multi- component olfactory displays have become main stream. For example, Lotus, developed by a research group in Taiwan, is a controllable mist-based olfactory display with airflow guidance modules to simulate the environment with olfac- tion [6]. Then, the olfactory display called AROMASTIC on the market can quickly switch 30 different scents[7]. In addition to the studies above, there have been several papers on tiny olfactory displays. However, most of the papers refer only the odor generation methods without evaluation of the odor delivery methods and its delivery time.
Then, focusing on reducing the olfactory adaptation effect, Okada et al. presented a performance evaluation of the olfactory display using pulse ejection method that can present a small amount of odor sample in consideration of human respiration period [8]. They revealed that people perceived two types of fragrance presentations during one breathing[9]. Moreover, Bannai et al. showed the olfactory display using piezoelectric elements. They tried to solve the problem of smell persistence by precisely adjusting the amount and the moment of fragrance injection[10].
Copyright © 2021 The Institute of Electronics, Information and Communication Engineers
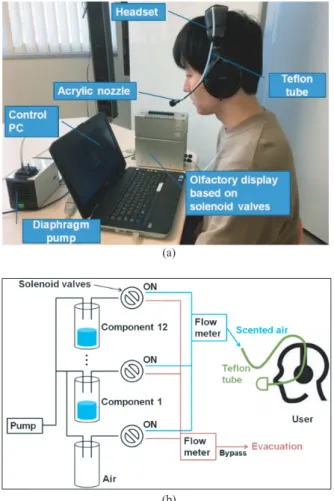
Fig. 1 Olfactory display based on solenoid valves. (a) Photo, (b) struc- ture.
3. Olfactory Displays
We explain the three types of olfactory displays to be evalu- ated in this study.
3.1 Olfactory Display Based on Solenoid Valves (the SV) This olfactory display is a desktop type and utilizes high- speed switching solenoid valves method, as shown in Fig. 1(a). The entire structure of this olfactory display is basically illustrated in Fig. 1(b)[11]. The smell at an acrylic nozzle is delivered through Teflon tube from the olfactory display to the user’s nose. Tube length more than 60 cm is required so that the user sitting on a chair can use PC to control the olfactory display. It is possible to blend up to 12 kinds of odor sample at any recipe and present odors.
Since plumbing is used in this olfactory display, residual odor inside the tube is dominant for low-volatile odorants.
The olfactory display can be controlled easily on a PC using GUI software called the EZ Blender as shown in Fig. 2.
It is used to specify relative concentration and delivery time of each component by moving the each slider. The olfactory display in Fig. 1(a) can be purchased from Ono Denki Co.
Fig. 2 GUI to specify relative concentration and delivery time of each component (EZ Blender).
Fig. 3 Diagram of atomization with SAW device.
Ltd. upon request.
3.2 Desktop Olfactory Display Based on SAW Atomizer (the DS)
This olfactory display is a desktop type and applies ultrasonic atomization principle of a SAW device. The droplet of the odor sample dropped on the SAW device is atomized by the SAW streaming phenomenon. As shown in Fig. 3, SAW streaming makes it possible to utilize low- volatile odorants and to present sufficient scents to the user only with a small amount of liquid fragrance. A tube where residual odor often remains is not used for presenting scents. Moreover, instantaneous atomization of liquid droplet enables the rapid odor presentation and its removal.
As for the structure, it is appropriate to place the SAW device as shown in Fig. 4(a). It is located about 20 cm away from the user’s nose. Since the eight micro dispensers work independently, it is possible to blend up to eight ingredients at any recipe as shown in Fig. 4(b)[12]. The micro dispensers shoot tiny liquid droplets onto SAW device, followed by its atomization. Then a small fan generates airflow, which delivers the smell toward the user’s nose.
746
IEICE TRANS. FUNDAMENTALS, VOL.E104–A, NO.4 APRIL 2021
Fig. 4 Desktop olfactory display based on SAW atomizer. (a) Photo, (b) principle.
3.3 Wearable Olfactory Display Based on SAW Atomizer (the WS)
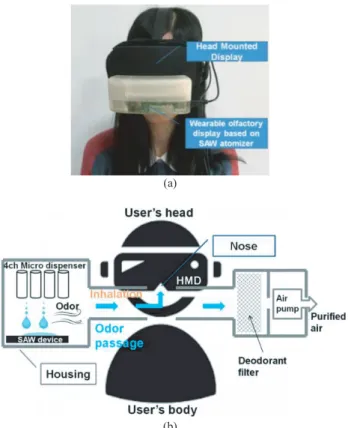
This olfactory display is a wearable type as shown in Fig. 5(a). Although it is similar to the above-described desk- top olfactory display, it has a function of self- collection of emitted odor to suppress the spread of smell in the ambient air. It is placed just below HMD (Head Mounted Display).
Its principle is shown in Fig. 5(b). The SAW device atomizes liquid droplets shot by micro dispenser in the same way as desktop one. The mist passes across the nose, since it is driven by the air pump. Since most of odor, not sniffed by the user, goes across the user’s nose, activated carbon filter unit is used to purify the air before releasing it in the ambient air. In this context the odor delivery method of the WS is quite different from that of the DS. It is possible to blend up to four kinds of odor samples at any recipe[13],[14].
4. Experimental Method
4.1 Method
We performed sensory evaluation experiments (Exp.1 and Exp.3) and sensor measurement experiment (Exp.2). To investigate the temporal characteristics of the three olfac- tory displays with different odor delivery methods, we have measured the time when the participants started perceiving
Fig. 5 Wearable olfactory display based on SAW atomizer. (a) Photo, (b) principle.
Table 1 Odor samples (aroma compounds) used in the study[16].
the odor and the time when the odor became weaker were recorded, and the delay from the odor presentation timing at the computer was evaluated.
4.2 Odor Samples
When producing the olfactory VR contents, it is indispens- able to control the time duration of the fragrance used. In the field of perfumery, there is a concept of fragrance notes such as top note, middle note and last one[15]. Highly volatile
“top note” lasts for 5–10 minutes, moderately volatile “mid- dle note” lasts for 0.5–2 hours, and “last note” having low volatility, lasts longer than two hours. Based on the con- cept of volatility in perfumery, we decide to use three odor samples in the experiments.
However, in selecting the three odor samples, we objec- tively measured the concentration of the odor samples pre- sented from the different types of olfactory displays using PID (Photo Ionization Detector) monitor. Then, we selected 1-propanol, isoamyl acetate, andα-pinene in ascending or- der of boiling point, as shown in Table 1.
4.3 Participants
30 participants (22 men and 8 women in total) took part in the sensory evaluations (20 people for Exp.1 and 30 people for Exp.3). All students and faculty members (aged in their 20 s to 50 s) of our university conducted self-assessment by self- report that they were healthy in their olfaction. In Exp.1 and Exp.3, some participants were overlapped. The protocol of the experiments was approved by the University’s Research Ethics Review Committee in accordance with the Helsinki Declaration (approval number: 2018020).
5. Experiments
5.1 Experiment 1 (Exp.1)
In order to adjust the odor intensities of the three odor sam- ples using the three olfactory displays, a sensory evaluation test was conducted. The room temperature was kept constant at 23◦C, the windows were shielded by blackout curtains, and an appropriate lighting environment was prepared with flu- orescent lights during the experiment. In addition, the large air conditioner and air purifier were always operated.
The experiment 1 consisted of three procedures.
hProc. 1i We selected the DS as the reference olfac- tory display to set criteria for the odor concentration to be presented.
First, the reason for choosing the DS first so that its generated concentration as the reference display is that its variation of the concentration is large at the participant’s nose due to the turbulence since the odor delivery distance is long. We thought that it was important to fix the driving frequency of the DS so that its generated concentration could be at appropriate level.
Next, regarding the frequency setting to adjust the con- centration, we selected 10 Hz as a driving frequency of the DS forα-pinene with high boiling point first of all, because its odor intensity was appropriate. We took such a method in the pre-sensory test, and fixed it at 15 Hz for 1-propanol, at 5 Hz for isoamyl acetate and at 10 Hz forα-pinene, respec- tively.
The order of each driving frequency was consistent with the order of their odor thresholds, which were 0.094 ppm (1-propanol), 0.0034 ppm (isoamyl acetate) and 0.018 ppm (α-pinene), respectively.
hProc. 2iFirstly 10 participants memorized each odor concentration presented from the DS based on the driving frequency determined in Proc.1 for 15 seconds. Next, the same 10 participants operated the EZ Blender on the PC to match their stored concentration, and adjusted the concentra- tion of the three odor samples presented from the SV. Finally, each participant reported to us the results determined in the EZ Blender, and we calculated their average value.
hProc. 3i Firstly different 10 participants memorized each odor concentration presented from the DS based on the driving frequency determined in Proc.1 for 15 seconds.
Table 2 Results of the sensory evaluation.
Next, the same 10 participants manipulated the software for changing the driving frequency on the PC to match their stored concentration with 5 Hz increments, and adjusted the concentration of the three odor samples presented from the WS. Finally, each participant reported to us the results determined on the software, and we calculated their average values. Table 2 shows the experimental results of Exp.1.
As shown in Table 2, in the SV, the odor intensities of 1- propanol and isoamyl acetate were almost the same, whereas α-pinene showed lower value because its odor is stronger than other two. In the WS, the three aroma compounds showed the same value.
5.2 Experiment 2 (Exp.2)
We used a PID monitor (ppb RAE 3000) to examine the odor concentration of the three odor samples presented from the three olfactory displays. The fresh air calibration and the span calibration (using isobutylene gas) were performed before the measurement. The measurement points of the PID monitor were as follows.
In the SV: it was located about 3 cm from the acrylic nozzle, in the DS: about 20 cm from the center of the SAW device and in the WS, it was located around 1 cm away from the outlet of the smell. The WS was separated from the HMD during the experiment. Those locations were almost the same as people’s noses when they use olfactory displays.
Table 3 shows the measurement results.
Table 3 indicates the averaged concentration of five measurements. Every time concentration was measured for one minute by PID monitor and its averaged value was ob- tained. Although the concentration of 1-propanol was larger than other two, its perceived intensity was almost same.
5.3 Experiment 3 (Exp.3)
We conducted the sensory evaluation in the same way as Exp.1. The number of the participants in the experiment was 10 for each test of the SV, the DS and the WS (30 people
748
IEICE TRANS. FUNDAMENTALS, VOL.E104–A, NO.4 APRIL 2021
Table 3 Measurement results of the three odor samples (ppm) with the three olfactory displays.
in total), several participants of Exp.3 also joined Exp.1.
From each of the three olfactory displays, the three types of aroma compounds were presented for 15 seconds, and a sensory evaluation was performed. The odor perception behavior of the participants was collected as in the form of CSV data using the GUI software. We measured the time when the participants start perceiving the odor (the FO) and the time when the odor was felt weaker (the FW).
The experimental procedure is summarized below.
• Sensory evaluation is performed one by one with one olfactory display.
• The participants are not informed of the type of odor sample and their presentation time.
• The participant sits on a chair in front of the olfactory display, adjusts the position of the acrylic nozzle by putting the stainless steel neck holder around the neck, and hold the mouse with their dominant hand, and wear earmuffs set.
• The participant watches the GUI in the software on the PC during the experiment.
• Start the evaluation with the first hand gesture of the demonstrator.
• The participant clicks the FO icon at the time when he/she senses odor.
• The participant clicks the FW icon at the time when he/she senses that odor has weakened.
• Complete the evaluation by the second hand gesture of the demonstrator, and exit the room.
The timing at which the participants clicked was au- tomatically output in chronological order as CSV data and saved on a PC. Based on these data, we used the software to determine the FO time when 10 participants felt the odor and the FW time when they felt the odor was weakened were shown in the figures. Figure 6(a) and (b) show a comparison among the three olfactory displays of 1-propanol, Fig. 7(a) and (b) show one of isoamyl acetate, and Fig. 8(a) and (b) show one ofα-pinene. For each olfactory display, the scatter plot shows the time when each participant responded.
Figures 6–8(a) show the FOs of three olfactory displays
Fig. 6 Temporal perception for 1-propanol. (a) FO, (b) FW.
Fig. 7 Temporal perception for isoamyl acetate. (a) FO, (b) FW.
and Figs. 6–8(b) show their FWs. Dashed line for the FW is the time when we stop each odor.
We can observe the following things in Figures 6, 7 and 8. First, we examined the differences among the three olfactory displays in terms of the FO. In all of the odor samples, the WS showed the fastest odor perception, and next came the DS, then the SV. The variance was large in the SV particularly in isoamyl acetate andα-pinene.
Second, it was clear that the FW time of the SV was longer than those of the DS and the WS. Therefore, for the FW time in three odor samples, a two-sample t-test was performed on the distribution data group of the DS and the one of the WS. As a result, for 1-propanol, isoamyl acetate, andα-pinene, p values were 1.0×10⁻³, 4.4×10⁻⁶, 3.5× 10⁻⁴, respectively. The null hypothesis was rejected at 5%
significant level for the all of the odor samples. Thus, there was no overlap between the DS and the WS distributions even if they were close to each other.
Fig. 8 Temporal perception forα-pinene. (a) FO, (b) FW.
6. Discussion
The time lag of clicking mouse of the participants happened in the experiment. However, it can be ignored since it is less than a few hundred milliseconds.
After all, the WS suggests that this type of wearable olfactory display can improve the problem of smell persis- tence, since the position of odor generation is so close to the user’s nose.
There was a large variance in the temporal perception of the odors of the participants for the SV, while the variance was relatively small for the two kinds of SAW type olfactory displays. The background of the problem for the SV is that the latency from the time the odor propagates through the Teflon tube to reach the nose of the user depends greatly on the type of odorants. Since the Teflon tube is used in the SV, odor pulse in the tube becomes broader as well as increasing latency.
Finally, we focus on the difference in the odor delivery methods and discuss about it.
Regarding the SV, the delivered vapor concentration is stable since the vapor goes to the user’s nose through tube without scattering. But the time required to deliver the smell depends on the volatility of the odorant.
As for the DS, it is easily affected by ambient distur- bance since the odorant reaches the user’s nose 20 cm away from the surface of the SAW device by the air flow generated with the small fan. The variation of delivered vapor concen- tration is large due to the air turbulence. On the other hand, it can quickly spread into the atmosphere and residual odor disappears faster.
As for the WS, the atomized aroma substance reaches the user’s nose directly, so that the response time becomes faster when the smell starts to feel and when it weakens.
However a careful attention must be paid to avoid too high concentration.
At last, as far as the FW time is concerned with the problem of smell persistence, the WS seems to have the
advantage from the viewpoint of temporal characteristic.
7. Conclusion
In this study, we evaluated the performance of the three types of multi-component olfactory displays with different odor delivery methods to reveal the temporal characteristics.
We performed sensory evaluation experiments as for odor perception using the three types of aroma compounds with different volatilities.
The olfactory display based on SAW atomizer seems to have advantages in both the speed at which the odor starts to be perceived and the speed of reducing of residual odor compared to the olfactory display based on solenoid valves.
In particular the wearable olfactory display based on SAW atomizer had the fastest characteristic among the three ones.
Thus, the odor should be directly delivered to a human nose as close to the odor generation part as possible without using a tube.
In the production of VR contents; movie and music with scents, temporal accuracy of odor presentation is required.
The data obtained in this study provides basic knowledge when we make contents using olfactory displays.
Acknowledgments
This study was partially supported by JSPS KAKENHI grant: JP18H03773.
References
[1] T. Nakamoto, ed., Essentials of Machine Olfaction and Taste, Wiley, 2016.
[2] B.N. Johnson and N. Sobel, “Methods for building an olfactometer with known concentration outcomes,” J. Neurosci. Meth., vol.160, no.2, pp.160–231, 2007.
[3] T. Nakamoto and K. Yoshikawa, “Movie with scents generated by olfactory display using solenoid valves,” IEICE Trans. Fundamentals, vol.E89-A, no.11, pp.3227–3332, Nov. 2006.
[4] T. Nakamoto, S. Otaguro, M. Kinoshita, M. Nagahama, K. Ohnishi, and T. Ishida, “Cooking up an interactive olfactory game display,”
IEEE Comput. Graph. Appl., vol.28, no.1, pp.75–78, 2008.
[5] M. Iseki and T. Nakamoto, “Interactive art of sound & scent using an olfactory display,” INTERACTION 2013, 3EXB-03, Information Processing Society of Japan, 2013.
[6] Y.-S. Chen, P.-H. Han, K.-C. Lee, C.-E. Hsieh, J.-C. Hsiao, C.-J.
Hsu, K.-W. Chen, C.-H. Chou, and Y.-P. Hung, “Lotus: Enhancing the immersive experience in virtual environment with mist-based olfactory display,” SIGGRAPH ASIA, Tokyo Japan, 2018. https://
dl.acm.org/doi/pdf/10.1145/3275495.3275503
[7] S. Fujita et al., “An olfactory display for VR, equipped with rapidly and individually controlled valves for switching and blending of 30 scents,” Information Processing Society of Japan, EC2019, Sept.
2019.
[8] J. Sato, A. Kadowaki, K. Ohtsu, Y. Bannai, and K. Okada, “Scent pre- sentation technique by pulse ejection to avoid olfactory adaptation,”
Information Processing Society of Japan, vol.49, no.8, pp.2922–
2929, 2008.
[9] J. Sato, K. Ohtsu, Y. Bannai, and K. Okada, “Measurement of olfac- tory responses to two kinds of scent in a single breath cycle,” IEICE Technical Report, pp.1–6, 2008.
[10] A. Aruga, S. Nakamura, and Y. Bannai, “Fine droplet discharge type
750
IEICE TRANS. FUNDAMENTALS, VOL.E104–A, NO.4 APRIL 2021
olfactory display,” 24th Annual Conference of the Virtual Reality Society of Japan, O-02, 2019.
[11] T. Nakamoto and H.P.D. Minh, “Improvement of olfactory display us- ing solenoid valves,” IEEE Virtual Reality Conference 2007, pp.179–
186, 2007.
[12] T. Nakamoto, S. Ito, S. Kato and G.P. Qi, “Multicomponent olfactory display using solenoid valves and SAW atomizer and its blending- capability evaluation,” IEEE Sensors J., vol.18, no.13, pp.5213–
5218, 2018.
[13] S. Kato and T. Nakamoto, “Wearable olfactory display with less residual odor,” IEEE International Symposium on Olfaction and Electronic Nose, 2019.
[14] T. Nakamoto, T. Hirasawa, and Y. Hanyu, “Virtual environment with smell using wearable olfactory display and computational fluid dynamics simulation,” IEEE Virtual Reality 2020, 2020.
[15] http://japanfragrance.org/pdf/fragrance-abc.pdf, accessed Feb. 5.
2020.
[16] https://pubchem.ncbi.nlm.nih.gov/, accessed Feb. 14. 2020.
Masaaki Iseki received his M. academic degree in Department of Computational Intel- ligence and Systems Science from Tokyo Insti- tute of Technology, Tokyo, Japan in 2015. He currently works in the doctoral course in Tokyo Institute of Technology.
Takamichi Nakamoto received his B.E.
and M.E. degrees in 1982 and 1984, respectively, and his Ph.D. degree in electrical and electronic engineering from Tokyo Institute of Technology, Tokyo, Japan. He worked for Hitachi in the area of VLSI design automation from 1984 to 1987.
In 1987, he joined Tokyo Institute of Technology as a Research Associate. In 1993, he became an Associate Professor with the Department of Electrical and Electronics Engineering, Tokyo Institute of Technology. From 1996 to 1997, he was a Visiting Scientist at Pacific Northwest Laboratories, Richland, WA, USA. He is currently a Professor with Institute of Innovative Research, Tokyo Institute of Technology.