Reprod Med Biol. 2019;18:7–16. wileyonlinelibrary.com/journal/rmb
|
7 Received: 5 November 2018|
Accepted: 6 November 2018DOI: 10.1002/rmb2.12258
S P E C I A L R E P O R T
Assisted reproductive technology in Japan: A summary report
for 2016 by the Ethics Committee of the Japan Society of
Obstetrics and Gynecology
Osamu Ishihara
1| Seung Chik Jwa
1| Akira Kuwahara
2| Tomonori Ishikawa
3|
Koji Kugu
4| Rintaro Sawa
5,6| Kouji Banno
7| Minoru Irahara
2| Hidekazu Saito
8This is an open access article under the terms of the Creative Commons Attribution‐NonCommercial License, which permits use, distribution and reproduction in any medium, provided the original work is properly cited and is not used for commercial purposes.
© 2018 The Authors. Reproductive Medicine and Biology published by John Wiley & Sons Australia, Ltd on behalf of Japan Society for Reproductive Medicine. 1Department of Obstetrics and Gynecology, Saitama Medical University, Saitama, Japan 2Department of Obstetrics and Gynecology, Graduate School of Biomedical Sciences, Tokushima University, Tokushima, Japan 3Department of Comprehensive Reproductive Medicine, Graduate School, Tokyo Medical and Dental University, Tokyo, Japan 4Department of Obstetrics and Gynecology, Tokyo Metropolitan Bokutoh Hospital, Tokyo, Japan 5Department of Obstetrics and Gynecology, Nippon Medical School, Tokyo, Japan 6Japan Medical Association Research Institute, Tokyo, Japan 7Department of Obstetrics and Gynecology, School of Medicine, Keio University, Tokyo, Japan 8Division of Reproductive Medicine, Center of Maternal‐Fetal, Neonatal and Reproductive Medicine, National Center for Child Health and Development, Tokyo, Japan Correspondence Seung Chik Jwa, Department of Obstetrics and Gynecology, Saitama Medical University, Saitama, Japan. Email: jwa_s@saitama‐med.ac.jp Funding information Health and Labour Sciences Research Grants (H30‐Sukoyaka‐Ippan‐002).
Abstract
Purpose: The Japan Society of Obstetrics and Gynecology started an online cycle‐ based assisted reproductive technology (ART) registry system in 2007. This report presents the characteristics and treatment outcomes of ART registered for the cycles practiced during 2016. Methods: Cycle‐specific information for all ART cycles implemented in participating ART facilities were collected. A descriptive analysis was conducted for the registry database of 2016. Results: In total, 447 790 treatment cycles and 54 110 neonates (one in 18.1 neo‐ nates born in Japan) were reported in 2016. The mean patients’ age was 38.1 years (SD = 4.5). Among the egg retrieval cycles, 104 575 of 251 399 (41.6%) were freeze‐ all cycles without fresh embryo transfers (ET), while fresh ET was performed in 64 497 cycles (58.4%). A total of 187 132 frozen‐thawed ET cycles were reported, resulting in 62 432 pregnancies and 44 484 neonates born. Single ET was selected for 81.0% of fresh transfers and 82.7% of frozen cycles, resulting in singleton preg‐ nancy/live birth rates of 97.0%/96.4% and 96.7%/96.4%, respectively. Conclusion: The total ART cycles and subsequent live births continued to increase in 2016. Single ET was performed more than 80%, and ET has shifted from using fresh embryos to frozen ones. K E Y W O R D S ART registry, freeze‐all, in vitro fertilization, Japan Society of Obstetrics and Gynecology, single embryo transfer1 | INTRODUCTION
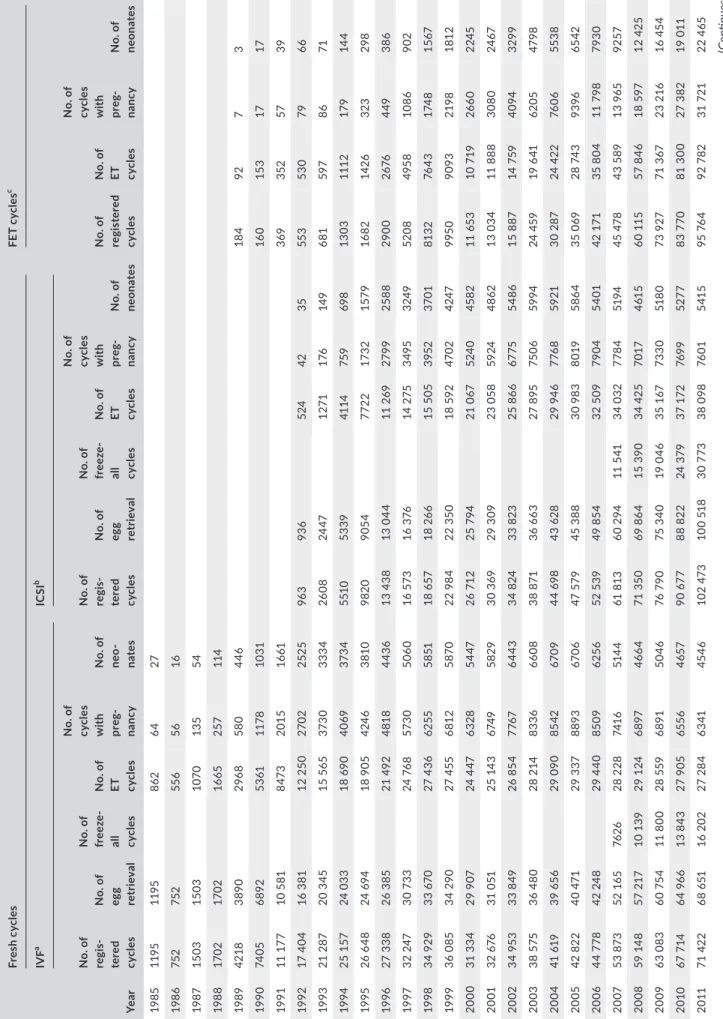
In Japan, the first in vitro fertilization (IVF) baby was born in 1983, and thereafter, the annual number of assisted reproductive tech‐ nology (ART) cycles has dramatically increased year by year. Japan has become one of the largest users of ART worldwide in terms of the annual number of treatment cycles done.1 Records of the characteristics and clinical outcomes of ART are crucial to monitor trends and situations of ART treatment imple‐ mented in a country. The Japan Society of Obstetrics and GynecologyT A B LE 1 Tr en ds in n um be rs o f r eg is te re d cy cl es , e gg re tr ie va l, pr eg na nc y, a nd n eo na te s ac co rd in g to IV F, IC SI , a nd fr oz en ‐t ha w ed e m br yo tr an sf er c yc le s, J ap an , 1 98 5‐ 201 6 Yea r Fr es h c yc le s FE T c yc le s c IV F a IC SI b N o. o f re gis te re d cyc le s N o. o f ET cyc le s N o. o f cy cl es w ith pr eg -na nc y N o. o f ne on at es N o. o f re gi s-ter ed cyc le s N o. o f eg g re tr ie val N o. o f fr eez e‐ al l cyc le s N o. o f ET cyc le s N o. o f cy cl es w ith pr eg -na nc y N o. o f ne o-na te s N o. o f re gi s-ter ed cyc le s N o. o f eg g re tr ie val N o. o f fr eez e‐ al l cyc le s N o. o f ET cyc le s N o. o f cy cl es w ith pr eg -na nc y N o. o f ne on at es 19 85 11 95 11 95 862 64 27 19 86 752 752 55 6 56 16 19 87 15 03 15 03 10 70 13 5 54 19 88 17 02 17 02 16 65 257 114 19 89 42 18 389 0 296 8 58 0 446 18 4 92 7 3 19 90 74 05 689 2 53 61 11 78 10 31 16 0 15 3 17 17 19 91 11 1 77 10 5 81 847 3 201 5 16 61 369 352 57 39 19 92 17 4 04 16 3 81 12 2 50 27 02 25 25 96 3 93 6 524 42 35 55 3 53 0 79 66 19 93 21 2 87 20 3 45 15 5 65 37 30 333 4 26 08 24 47 12 71 176 14 9 681 59 7 86 71 19 94 25 1 57 24 0 33 18 69 0 40 69 37 34 551 0 53 39 41 14 759 69 8 13 03 111 2 17 9 14 4 19 95 26 6 48 24 6 94 18 9 05 424 6 38 10 98 20 905 4 772 2 17 32 157 9 16 82 14 26 323 298 19 96 27 3 38 26 3 85 21 49 2 4818 44 36 13 4 38 13 0 44 11 2 69 27 99 258 8 29 00 26 76 449 386 19 97 32 2 47 30 73 3 24 76 8 573 0 50 60 16 573 16 3 76 14 2 75 34 95 324 9 52 08 495 8 10 86 902 19 98 34 9 29 33 67 0 27 4 36 62 55 58 51 18 657 18 2 66 15 5 05 39 52 37 01 813 2 76 43 174 8 15 67 1999 36 0 85 34 2 90 27 4 55 681 2 587 0 22 9 84 22 3 50 18 59 2 47 02 42 47 995 0 90 93 21 98 181 2 2000 31 3 34 29 9 07 24 4 47 6328 54 47 26 71 2 25 7 94 21 0 67 524 0 45 82 11 6 53 10 7 19 26 60 224 5 20 01 32 6 76 31 0 51 25 14 3 674 9 582 9 30 3 69 29 3 09 23 0 58 59 24 48 62 13 0 34 11 888 3080 24 67 20 02 34 95 3 33 8 49 26 8 54 776 7 64 43 34 8 24 33 8 23 25 8 66 67 75 54 86 15 8 87 14 759 40 94 32 99 20 03 38 5 75 36 4 80 28 2 14 83 36 66 08 38 8 71 36 6 63 27 8 95 75 06 59 94 24 4 59 19 6 41 62 05 47 98 20 04 41 61 9 39 65 6 29 0 90 85 42 67 09 44 69 8 43 62 8 29 94 6 776 8 59 21 30 2 87 24 4 22 76 06 55 38 20 05 42 8 22 40 47 1 29 3 37 88 93 67 06 47 5 79 45 3 88 30 9 83 80 19 58 64 35 0 69 28 74 3 93 96 65 42 20 06 44 7 78 42 24 8 29 4 40 85 09 62 56 52 5 39 49 8 54 32 5 09 79 04 54 01 42 17 1 35 8 04 11 7 98 79 30 20 07 53 87 3 52 1 65 76 26 28 2 28 74 16 51 44 61 8 13 60 2 94 11 5 41 34 0 32 778 4 51 94 45 4 78 43 5 89 13 96 5 92 57 20 08 59 14 8 57 2 17 10 1 39 29 1 24 68 97 466 4 71 3 50 69 8 64 15 3 90 34 42 5 70 17 461 5 60 11 5 57 8 46 18 59 7 12 42 5 20 09 63 0 83 60 7 54 11 8 00 28 5 59 68 91 50 46 76 7 90 75 3 40 19 0 46 35 1 67 73 30 51 80 73 9 27 71 3 67 23 2 16 16 4 54 20 10 67 7 14 64 96 6 13 8 43 27 9 05 655 6 4657 90 67 7 88 8 22 24 3 79 37 1 72 76 99 52 77 83 7 70 81 3 00 27 3 82 19 0 11 20 11 71 4 22 68 6 51 16 202 27 2 84 63 41 45 46 10 2 47 3 10 0 51 8 30 7 73 38 0 98 76 01 541 5 95 76 4 92 78 2 31 72 1 22 4 65 (C on tinues )
(JSOG) started an ART registry system in 1986. In 2007, the JSOG launched an online registration system and collected cycle‐specific information for all ART treatment cycles implemented in ART fa‐ cilities. The aim of this study was to report the characteristics and treatment outcomes of ART cycles registered during 2016 following the previous report.2
2 | MATERIALS AND METHODS
Since 2007, the JSOG has requested all participating ART clinics and hospitals to register cycle‐specific information for all treat‐ ment cycles. The information includes patient characteristics, information on ART treatment, and pregnancy and obstetric out‐ comes. Details on the information collected in the registry have been reported previously.3 For ART cycles conducted between
January 1 and December 31, 2016, JSOG requested registra‐ tion of the information via an online registry system by the end of November 2017. This study was approved by the Institutional Review Board at the Saitama Medical University and ethics com‐ mittee at the JSOG.
Using the database registered for 2016, a descriptive analysis was performed to investigate the characteristics and treatment outcomes of registered fresh and frozen‐thawed embryo transfer (FET) cycles. The number of registered cycles, egg retrievals, fresh embryo transfer (ET) cycles, freeze‐all embryos/oocytes cycles, pregnancies, and neonates were compared with that in previous years. The characteristics of the registered cycles and treatment outcomes were described for fresh and FET cycles. Treatment outcomes included the pregnancy, miscarriage and live birth rates, multiple pregnancies, pregnancy outcomes for ectopic pregnancy, intrauterine pregnancy coexisting with an ectopic pregnancy, ar‐ tificial abortion, stillbirth, and fetal reduction. Furthermore, the treatment outcomes of pregnancy, live birth, miscarriage, and multiple pregnancy rates were analyzed according to patient age. Treatment outcomes for cycles using frozen‐thawed oocytes were also reported.
3 | RESULTS
There were 604 registered ART facilities in 2016, of which 603 participated in the ART registration system. The number of facili‐ ties that actually implemented ART treatment in 2016 was 587; 16 registered facilities did not implement ART cycles. The trends in the number of registered cycles, egg retrievals, pregnancies, and neonates for IVF, intracytoplasmic sperm injection (ICSI), and FET cycles from 1985 to 2016 are shown in Table 1. In 2016, 447 790 cycles were registered and 54 110 neonates were recorded, ac‐ counting for one in 18.1 neonates born in Japan (total number of neonates was 976 979 in 2016). The total number of registered cy‐ cles demonstrated an increasing trend from 1985 to 2016 for both fresh ET and FET cycles. In 2016, the numbers of cycles registered Yea r Fr es h c yc le s FE T c yc le s c IV F a IC SI b N o. o f re gis te re d cyc le s N o. o f ET cyc le s N o. o f cy cl es w ith pr eg -na nc y N o. o f ne on at es N o. o f re gi s-ter ed cyc le s N o. o f eg g re tr ie val N o. o f fr eez e‐ al l cyc le s N o. o f ET cyc le s N o. o f cy cl es w ith pr eg -na nc y N o. o f ne o-na te s N o. o f re gi s-ter ed cyc le s N o. o f eg g re tr ie val N o. o f fr eez e‐ al l cyc le s N o. o f ET cyc le s N o. o f cy cl es w ith pr eg -na nc y N o. o f ne on at es 201 2 82 10 8 79 4 34 20 627 29 69 3 67 03 474 0 12 5 22 9 12 2 96 2 41 9 43 40 8 29 79 47 549 8 11 9 08 9 11 6 176 39 10 6 27 71 5 20 13 89 95 0 87 10 4 25 0 85 30 16 4 68 17 47 76 13 4 871 13 4 871 49 31 6 41 1 50 80 27 56 30 141 3 35 13 8 24 9 45 3 92 32 14 8 20 14 92 2 69 89 3 97 27 62 4 30 41 4 69 70 50 25 14 4 24 7 14 1 888 55 8 51 41 4 37 81 22 57 02 157 2 29 15 3 97 7 51 4 58 36 59 5 201 5 93 61 4 91 07 9 30 49 8 28 8 58 647 8 462 9 155 7 97 15 3 63 9 63 6 60 41 3 96 816 9 576 1 174 74 0 17 1 49 5 56 888 40 61 1 20 16 94 5 66 92 18 5 34 18 8 26 18 2 59 03 42 66 161 2 62 15 9 214 70 3 87 38 31 5 73 24 51 66 19 1 96 2 18 8 33 8 62 74 9 44 6 78 ET , e m br yo tr an sf er ; F ET , f ro ze n‐ th aw ed e m br yo tr an sf er ; I C SI , i nt ra cy to pl as m ic s pe rm in je ct io n; IV F, in v itr o fe rt ili za tio n. aIn cl ud in g ga m et e in tr af al lo pi an tr an sf er . bIn cl ud in g Sp lit ‐I C SI c yc le s. cIn cl ud in g cy cl es u si ng fr oze n‐ th aw ed o oc yt e. TABLE 1 (C on tinued)
for fresh IVF, fresh ICSI, and FET cycles were 94 566, 161 262, and 191 962, respectively. The total number of freeze‐all embryos/ oocytes cycles showed an increasing trend both for IVF and ICSI cycles, and 34 188/92 185 IVF (37.1%) and 70 387/159 214 ICSI (44.2%) cycles used freeze‐all embryos/oocytes in 2016, resulting in fewer fresh ET cycles in 2016 than in 2015. In terms of FET cycles, 188 388 FETs were performed resulting in 62 749 pregnan‐ cies and 44 678 neonates in 2016. Distributions of patients’ age in registered cycles, different subgroup of cycles with ET, pregnancy and live birth are shown in Figure 1. The patients’ mean age for the registered cycles was 38.1 years (SD = 4.5), while the mean age for pregnancy and live birth cycles was 36.2 years (SD = 4.1) and 35.6 years (SD = 4.0), respectively. The characteristics and treatment outcomes of the registered fresh cycles are shown in Table 2. There were 89 857 registered IVF cycles, 24 754 split‐ICSI cycles, 133 709 ICSI cycles using ejac‐ ulated sperm, 2799 ICSI cycles using testicular sperm extraction (TESE), 27 gamete intrafallopian transfer cycles, 462 cycles with oocyte freezing based on medical indications, and 4220 other cy‐ cles. Of the 251 399 cycles with oocyte retrieval, 104 575 (41.6%) were freeze‐all cycles. The pregnancy rate per ET was 22.7% for IVF and 18.2% for ICSI using ejaculated sperm. Single ET was per‐ formed at a rate of 81.0% with a pregnancy rate of 20.8%. The miscarriage rate per pregnancy was 25.9% for IVF, 28.5% for ICSI using ejaculated sperm, and 27.6% for ICSI with TESE, resulting in respective live birth rates per ET of 15.9%, 12.3%, and 10.3%. Singleton pregnancy rate and live birth rate were 97.0% and 96.4%, respectively.
The characteristics and treatment outcomes of the FET cy‐ cles are shown in Table 3. There were 190 541 registered cycles, of which FET was performed in 187 132 cycles leading to 62 434 pregnancies (pregnancy rate per FET = 33.4%). The miscarriage rate per pregnancy was 26.5%, resulting in a 23.0% live birth rate per ET. Single ET was performed at a rate of 82.7%, and the singleton pregnancy and live birth rate was 96.7% and 96.4%, respectively.
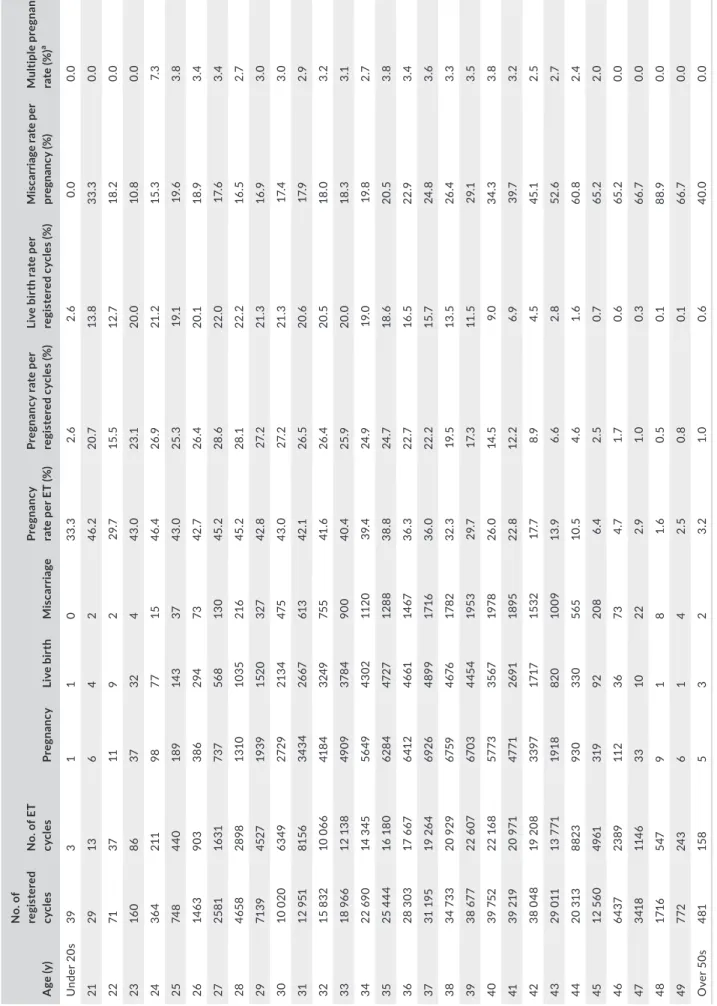
The treatment outcomes of registered cycles including preg‐ nancy, miscarriage, live birth, and multiple pregnancy rates accord‐ ing to patients’ age are shown in Table 4. Similarly, the distribution of the pregnancy, live birth, and miscarriage rates according to pa‐ tients’ age is shown in Figure 2. The pregnancy rate per ET exceeded 40% up to 33 years of age, gradually fell below 30% after 39 years of age and below 10% after 44 years of age. The miscarriage rate per pregnancy was 17% for those under 32 years of age and gradually increased with an increase in patient age. The miscarriage rate was below 20% under 35 years of age but gradually increased to 34.3% and 52.6% for those of 40 and 43 years of age, respectively. The live birth rate per registered cycle was around 20% up to 33 years of age and decreased to 9.0% and 2.8% at 40 and 43 years of age, respec‐ tively. Multiple pregnancy rates varied between 2% and 3% across most of the age groups.
The treatment outcomes for FET using frozen‐thawed oocytes based on medical indications are shown in Table 5. The total number of FET using frozen oocytes was 106 cycles, of which 23 cycles resulted in a pregnancy (pregnancy rate per FET = 21.1%). The miscarriage rate per pregnancy was 17.4%, resulting in a 15.1% live birth rate per ET. F I G U R E 1 Age distributions of registered cycles, different subgroup of cycles with ET, pregnancy, and live birth. Adapted from the Japan Society of Obstetrics and Gynecology assisted reproductive technology Databook 2016 (http://plaza.umin.ac.jp/~jsog‐ art/2016data_20180930.pdf). ET, embryo transfer
4 | DISCUSSION
Using the current Japanese ART registry system, this study dem‐ onstrated that the total number of registered ART cycles was
447 790, and resultant live births were 54 110, accounting for one in 18.1 neonates born in Japan in 2016. These figures are the larg‐ est since the registry started. Single ET was performed at rates of more than 80% for both fresh and frozen cycles, resulting in a
TA B L E 2 Characteristics and treatment outcomes of registered fresh cycles in assisted reproductive technology, Japan, 2016
Variables IVF‐ET Split
ICSI
GIFT
Frozen
oocyte Othersa Total
Ejaculated sperm TESE No. of registered cycles 89 857 24 754 133 709 2799 27 462 4220 255 828 No. of egg retrieval 87 656 24 545 131 873 2796 27 454 4048 251 399 No. of fresh ET cycles 25 649 6499 30 917 899 27 ‐ 506 64 497 No. of freeze‐all cycles 32 379 15 090 54 036 1261 0 395 1414 104 575 No. of cycles with pregnancy 5817 1555 5635 134 1 ‐ 85 13 227 Pregnancy rate per ET (%) 22.7 23.9 18.2 14.9 3.7 ‐ 16.8 20.5 Pregnancy rate per egg retrieval (%) 6.6 6.3 4.3 4.8 3.7 ‐ 2.1 5.3 Pregnancy rate per egg retrieval excluding freeze‐all cycles(%) 10.5 16.4 7.2 8.7 3.7 ‐ 3.2 9.0 SET cycles 21 199 5606 24 517 548 3 ‐ 365 52 238 Pregnancy following SET cycles 4825 1372 4484 94 0 ‐ 65 10 840 Rate of SET cycles 82.7% 86.3% 79.3% 61.0% 11.1% ‐ 72.1% 81.0% Pregnancy rate following SET cycles 22.8% 24.5% 18.3% 17.2% 0.0% ‐ 17.8% 20.8% Miscarriages 1508 357 1605 37 0 ‐ 24 3531 Miscarriage rate per pregnancy 25.9% 23.0% 28.5% 27.6% 0.0% ‐ 28.2% 26.7% Singleton pregnanciesb 5518 1496 5318 121 1 ‐ 82 12 536 Multiple pregnanciesb 181 31 170 3 0 ‐ 1 386 Twin pregnanciesb 180 31 168 3 0 ‐ 1 383 Triplet pregnanciesb 1 0 2 0 0 ‐ 0 3 Quadruplet pregnanciesb 0 0 0 0 0 ‐ 0 0 Multiple pregnancy rate (%)b 3.2 2.0 3.1 2.4 0.0 ‐ 1.2 3.0 Live births 4078 1123 3806 93 1 ‐ 58 9159 Live birth rate per ET (%) 15.9 17.3 12.3 10.3 3.7 ‐ 11.5 14.2 Total number of neonates 4206 1155 3916 95 1 ‐ 59 9432 Singleton live births 3930 1090 3666 89 1 ‐ 57 8833 Twin live births 135 31 122 3 0 ‐ 1 292 Triplet live births 2 1 2 0 0 ‐ 0 5 Quadruplet live births 0 0 0 0 0 ‐ 0 0 Pregnancy outcomes Ectopic pregnancies 68 26 77 1 0 ‐ 2 174 Intrauterine pregnancies coexisting with ectopic pregnancy 1 0 1 0 0 ‐ 0 2 Artificial abortions 23 6 28 0 0 ‐ 1 58 Stillbirths 22 5 19 0 0 ‐ 0 46 Fetal reductions 0 0 1 0 0 ‐ 0 1 Unknown cycles for pregnancy outcomes 105 35 95 3 0 ‐ 0 238 ET, embryo transfer; GIFT, gamete intrafallopian transfer; ICSI, intracytoplasmic sperm injection; IVF‐ET, in vitro fertilization‐embryo transfer; SET, single embryo transfer; TESE, testicular sperm extraction. aOthers include ZIFT. bSingleton, twin, triplet, and quadruplet pregnancies were defined according to the number of gestational sacs in utero.
singleton live birth rate of 96% in total. The number of freeze‐all cycles increased, resulting in a reduction in the number of fresh ET cycles. These results represent the latest clinical practice of ART in Japan.
One potential reason for the rising number of ART cycles is the advancing age of patients receiving ART. In the registered cycles, the mean age of registered cycles was 38.1 years (SD = 4.5), which was much higher than the mean age for cycles with live births (35.6 years, SD = 4.0). This age gap between patients receiving ART and patients who gave live birth after ART warrants further inves‐ tigation. Patients’ age is the most important factor determining the probability of a live birth after ART. Since the pregnancy and live
birth rates decreased as patients’ age increased (Table 4), the num‐ ber of ET cycles resulting in a live birth would theoretically exceed that in patients of a younger age. Thus, substantial education of pa‐ tients regarding the association between age and probabilities for pregnancy in ART is essential. Single ET was performed at a rate of more than 80% both for fresh and frozen cycles, which is the highest rate in the world.1 Single ET is one effective way to prevent adverse perinatal outcomes re‐ lated to multiple births while maintaining a cumulative live birth rate.4 In 2008, JSOG recommended restricting the number of ETs
to one in order to prevent multiple pregnancies, although double ET was allowed for women over 35 years of age or for women who
TA B L E 3 Characteristics and treatment outcomes of frozen cycles in assisted reproductive technology, Japan, 2016
Variables FET Othersa Total
No. of registered cycles 190 541 1222 191 763 No. of FET 187 132 1100 188 232 No. of cycles with pregnancy 62 432 294 62 726 Pregnancy rate per FET (%) 33.4 26.7 33.3 SET cycles 154 801 849 155 650 Pregnancy following SET cycles 53 130 230 53 360 Rate of SET cycles (%) 82.7 77.2 82.7 Pregnancy rate following SET cycles (%) 34.3 27.1 34.3 Miscarriages 16 552 84 16 636 Miscarriage rate per pregnancy (%) 26.5 28.6 26.5 Singleton pregnanciesb 59 472 257 59 729 Multiple pregnanciesb 2020 12 2032 Twin pregnanciesb 1979 11 1990 Triplet pregnanciesb 38 1 39 Quadruplet pregnanciesb 3 0 3 Multiple pregnancy rate (%)b 3.3 4.5 3.3 Live births 43 153 176 43 329 Live birth rate per FET (%) 23.1 16.0 23.0 Total number of neonates 44 484 178 44 662 Singleton live births 41 615 170 41 785 Twin live births 1412 4 1416 Triplet live births 15 0 15 Quadruplet live births 0 0 0 Pregnancy outcomes Ectopic pregnancies 357 2 359 Intrauterine pregnancies coexisting with ectopic pregnancy 1 0 1 Artificial abortions 277 1 278 Stillbirths 175 2 177 Fetal reduction 23 1 24 Unknown cycles for pregnancy outcomes 1702 11 1713 FET, frozen‐thawed embryo transfer; SET, single embryo transfer. aIncluding cycles using frozen‐thawed oocyte. bSingleton, twin, triplet and quadruplet pregnancies were defined according to the number of gestational sacs in utero.
T A B LE 4 Tr ea tm en t o ut co m es o f r eg is te re d cy cl es a cc or di ng to p at ie nt s' ag e, J ap an , 2 01 6 A ge ( y) N o. o f re gis te re d cyc le s N o. o f E T cyc le s Pre gn an cy Li ve b ir th M is ca rr ia ge Pre gn an cy ra te p er E T ( % ) Pr eg na nc y r at e p er re gi st er ed c yc le s ( % ) Li ve b ir th r at e p er re gi st er ed c yc le s ( % ) M is ca rr ia ge r at e p er pr eg na nc y ( % ) Mu lti ple pr eg na nc y ra te ( % ) a U nd er 2 0s 39 3 1 1 0 33 .3 2.6 2.6 0.0 0.0 21 29 13 6 4 2 46. 2 20 .7 13 .8 33 .3 0.0 22 71 37 11 9 2 29 .7 15 .5 12 .7 18 .2 0.0 23 16 0 86 37 32 4 43 .0 23 .1 20.0 10 .8 0.0 24 36 4 211 98 77 15 46 .4 26 .9 21 .2 15 .3 7. 3 25 74 8 440 18 9 14 3 37 43 .0 25 .3 19 .1 19 .6 3. 8 26 14 63 90 3 386 294 73 42 .7 26 .4 20 .1 18 .9 3.4 27 25 81 16 31 73 7 56 8 13 0 45 .2 28 .6 22 .0 17. 6 3.4 28 465 8 28 98 13 10 10 35 216 45 .2 28 .1 22 .2 16 .5 2.7 29 71 39 45 27 19 39 152 0 327 42 .8 27. 2 21 .3 16 .9 3.0 30 10 020 63 49 27 29 213 4 47 5 43 .0 27. 2 21 .3 17. 4 3.0 31 12 9 51 81 56 34 34 26 67 61 3 42 .1 26 .5 20 .6 17. 9 2.9 32 15 8 32 10 0 66 41 84 324 9 75 5 41 .6 26 .4 20 .5 18 .0 3. 2 33 18 96 6 12 13 8 49 09 37 84 90 0 40 .4 25 .9 20.0 18 .3 3.1 34 22 69 0 14 3 45 56 49 43 02 11 20 39 .4 24 .9 19 .0 19 .8 2.7 35 25 444 16 1 80 62 84 47 27 12 88 38.8 24 .7 18 .6 20 .5 3. 8 36 28 3 03 17 6 67 641 2 46 61 14 67 36 .3 22 .7 16 .5 22 .9 3.4 37 31 1 95 19 2 64 69 26 489 9 17 16 36 .0 22 .2 15 .7 24 .8 3.6 38 34 73 3 20 9 29 6759 46 76 17 82 32 .3 19 .5 13 .5 26 .4 3. 3 39 38 67 7 22 6 07 67 03 44 54 19 53 29 .7 17. 3 11 .5 29 .1 3. 5 40 39 752 22 16 8 57 73 35 67 19 78 26 .0 14 .5 9. 0 34. 3 3. 8 41 39 2 19 20 9 71 47 71 269 1 18 95 22 .8 12 .2 6.9 39 .7 3. 2 42 38 0 48 19 2 08 33 97 17 17 15 32 17. 7 8.9 4. 5 45 .1 2. 5 43 29 0 11 13 7 71 19 18 82 0 10 09 13 .9 6.6 2. 8 52 .6 2.7 44 20 3 13 88 23 93 0 33 0 565 10 .5 4. 6 1. 6 60 .8 2.4 45 12 5 60 49 61 31 9 92 20 8 6.4 2. 5 0.7 65 .2 2.0 46 64 37 23 89 11 2 36 73 4.7 1.7 0. 6 65 .2 0.0 47 341 8 114 6 33 10 22 2.9 1. 0 0. 3 66 .7 0.0 48 17 16 547 9 1 8 1. 6 0. 5 0.1 88 .9 0.0 49 772 24 3 6 1 4 2. 5 0. 8 0.1 66 .7 0.0 O ve r 5 0s 481 15 8 5 3 2 3. 2 1. 0 0. 6 40.0 0.0 ET , e m br yo tr an sf er . aM ul tip le p re gn an ci es w er e de fin ed a cc or di ng to th e nu m be r o f g es ta tio na l s ac s in u te ro .
experienced recurrent implantation failure. As a result, the rate of single ET dramatically increased from 49.9% in 2007 to 73.0% in 20105 and continues to rise (82.7% in FET cycles in 2016). The single ET policy has been credited with improving other indicators of peri‐ natal outcomes in Japan.6 There was a significant transition to the freeze‐all policy (Table 1). Freeze‐all provides an effective treatment option for patients at high risk for ovarian hyper‐stimulation syndrome (OHSS), preventing the symptoms and severity becoming worse.7 A randomized controlled
trial (RCT) in China demonstrated that the freeze‐all strategy had a significantly decreased risk for adverse outcomes such as OHSS and miscarriage, and a significantly higher rate of live birth among polycystic ovary syndrome (PCOS) patients.8 Whether the freeze‐all strategy would improve ART outcomes among non‐PCOS patients remains unresolved. Observational investigations demonstrated that FET cycles resulted in better pregnancy and perinatal outcomes than fresh cycles,6,9,10 however, two RCTs published in 2018 revealed that the effect of the freeze‐all strategy on pregnancy outcomes (ongo‐ ing pregnancy and live birth rate) was not different between patients who had the freeze‐all strategy and who received fresh ET after oo‐ cyte retrievals.11,12 The strengths of the Japanese ART registry system include its mandatory reporting system and high compliance rate. Patients cannot receive a government subsidy for a cycle if their ART facility does not register the cycle‐specific information. Almost all the par‐ ticipating ART clinics and hospitals (603 out of 604 facilities) regis‐ tered cycle‐specific information, which is high among participating countries of the International Committee for Monitoring Assisted Reproductive Technologies.1 Since the Japanese ART registry
system has such a significant compliance, the next step for improv‐ ing the registration system is maintaining the quality of the data‐ base. In order to use the registry database for research purposes and for important feedback to participating ART facilities and patients, we need to maintain the integrity of registration, and to assess the validity of the registry, as done by other countries.13,14 For exam‐ ple, by maintaining data quality, the United States registry system developed a patients’ and clinicians’ platform for the prediction of pregnancy and live birth rate (https://www.sart.org/), helpful for patients’ education and promoting appropriate informed consent at ART facilities. Thus, the need for ongoing improvements in the reg‐ istration system for participating ART facilities and patients appears inevitable. In conclusion, our analysis of the ART registry for 2016 demon‐ strated that the total number of ART cycles increased and resulted in 54 110 neonates (one in 18.1 neonates in Japan). The patients’ age receiving ART was significantly higher than the mean age of patients who had live birth. Single ET was performed at a rate of more than 80%, resulting in a 96% singleton live birth rate. Ongoing investi‐ gation is required to determine the effect of the increasing use of freeze‐all cycles. These data represent the latest clinical practices of ART in Japan, and further improvements in the registration system in Japan will be important. ACKNOWLEDGEMENTS We thank all of the registered facilities for their cooperation in pro‐ viding their responses. We would also like to encourage these fa‐ cilities to continue promoting the use of the online registry system F I G U R E 2 Pregnancy, live birth, and miscarriage rates according to patients’ age. Adapted from the Japan Society of Obstetrics and Gynecology assisted reproductive technology Databook 2016 (http://plaza.umin.ac.jp/~jsog‐art/2016data_20180930.pdf). ET, embryo transfer
and assisting us with our research. This study was supported by Health and Labour Sciences Research Grants (H30‐Sukoyaka‐ Ippan‐002). We thank Charles Allan, PhD, from Edanz Group (www.edanzediting.com/ac) for editing a draft of this manuscript.
ETHICAL APPROVAL
This study was approved by the Institutional Review Board at Saitama Medical University and the ethics committee at the JSOG.
DISCLOSURES
Conflict of interest: There is no conflict of interest regarding the
publication of this study. Human rights statement and informed
con-sent: All the procedures accorded with the ethical standards of the
relevant committees on human experimentation (institutional and national) and with the Helsinki Declaration of 1964 and its later amendments. Informed consent was obtained from all the patients in the study. Animal rights: This article does not contain any study that was performed by any of the authors that included animal participants.
ORCID
Seung Chik Jwa https://orcid.org/0000‐0002‐8815‐5714
Tomonori Ishikawa https://orcid.org/0000‐0002‐1012‐1557
REFERENCES 1. Dyer S, Chambers GM, de Mouzon J, et al. International committee for monitoring assisted reproductive technologies world report: as‐ sisted reproductive technology 2008, 2009 and 2010. Hum Reprod. 2016;31(7):1588‐1609. 2. Saito H, Jwa SC, Kuwahara A, et al. Assisted reproductive technol‐ ogy in Japan: a summary report for 2015 by The Ethics Committee of The Japan Society of Obstetrics and Gynecology. Reprod Med
Biol. 2018;17(1):20‐28.
3. Irahara M, Kuwahara A, Iwasa T, et al. Assisted reproductive tech‐ nology in Japan: a summary report of 1992‐2014 by the Ethics Committee, Japan Society of Obstetrics and Gynecology. Reprod
Med Biol. 2017;16:126‐132.
4. Maheshwari A, Griffiths S, Bhattacharya S. Global variations in the uptake of single embryo transfer. Hum Reprod Update. 2011;17(1):107‐120.
5. Takeshima K, Saito H, Nakaza A, et al. Efficacy, safety, and trends in assisted reproductive technology in Japan‐analysis of four‐year data from the national registry system. J Assist Reprod Genet. 2014;31(4):477‐484.
6. Takeshima K, Jwa SC, Saito H, et al. Impact of single embryo trans‐ fer policy on perinatal outcomes in fresh and frozen cycles—anal‐ ysis of the Japanese Assisted Reproduction Technology registry between 2007 and 2012. Fertil Steril. 2016;105(2):337‐346.e3. 7. Mourad S, Brown J, Farquhar C. Interventions for the prevention of
OHSS in ART cycles: an overview of Cochrane reviews. Cochrane
Database Syst Rev. 2017;1:CD012103.
8. Chen ZJ, Shi Y, Sun Y, et al. Fresh versus frozen embryos for infertility in the polycystic ovary syndrome. N Engl J Med. 2016;375(6):523‐533.
9. Pinborg A, Wennerholm UB, Romundstad LB, et al. Why do sin‐ gletons conceived after assisted reproduction technology have adverse perinatal outcome? Systematic review and meta‐analysis.
Hum Reprod Update. 2013;19(2):87‐104.
10. Pinborg A, Loft A, Aaris Henningsen AK, Rasmussen S, Andersen AN. Infant outcome of 957 singletons born after frozen embryo replacement: the Danish National Cohort Study 1995‐2006. Fertil
Steril. 2010;94(4):1320‐1327.
11. Vuong LN, Dang VQ, Ho TM, et al. IVF Transfer of fresh or fro‐ zen embryos in women without polycystic ovaries. N Engl J Med. 2018;378(2):137‐147.
12. Shi Y, Sun Y, Hao C, et al. Transfer of fresh versus frozen embryos in ovulatory women. N Engl J Med. 2018;378(2):126‐136.
TA B L E 5 Treatment outcomes of embryo transfers using frozen‐thawed oocytes based on medical indications in assisted reproductive technology, Japan, 2016 Variables Embryo transfer using frozen‐thawed oocyte No. of registered cycles 199 No. of ET 106 No. of cycles with pregnancy 23 Pregnancy rate per ET 21.7% SET cycles 68 Pregnancy following SET cycles 15 Rate of SET cycles 64.2% Pregnancy rate following SET cycles 22.1% Miscarriages 4 Miscarriage rate per pregnancy 17.4% Singleton pregnanciesa 23 Multiple pregnanciesa 0 Twin pregnanciesa 0 Triplet pregnanciesa 0 Quadruplet pregnanciesa 0 Multiple pregnancy ratea 0 Live births 16 Live birth rate per ET 15.1% Total number of neonates 16 Singleton live births 16 Twin live births 0 Triplet live births 0 Quadruplet live births 0 Pregnancy outcomes Ectopic pregnancies 0 Intrauterine pregnancies coexisting with ectopic pregnancy 0 Artificial abortions 0 Still births 0 Fetal reduction 0 Unknown cycles for pregnancy outcomes 3 ET, embryo transfer; SET, single embryo transfer.
aSingleton, twin, triplet and quadruplet pregnancies were defined ac‐
13. Toner JP, Coddington CC, Doody K, et al. Society for assisted re‐ productive technology and assisted reproductive technology in the United States: a 2016 update. Fertil Steril. 2016;106(3):541‐546. 14. Stern JE, Gopal D, Liberman RF, Anderka M, Kotelchuck M, Luke B. Validation of birth outcomes from the society for assisted repro‐ ductive technology clinic outcome reporting system (SART CORS): population‐based analysis from the Massachusetts outcome study of assisted reproductive technology (MOSART). Fertil Steril. 2016;106(3):717‐722.e2.
How to cite this article: Ishihara O, Jwa SC, Kuwahara A, et
al. Assisted reproductive technology in Japan: A summary report for 2016 by the Ethics Committee of the Japan Society of Obstetrics and Gynecology. Reprod Med Biol. 2019;18:7–16. https://doi.org/10.1002/rmb2.12258