Hydrology in Lena River Basin - Preliminary
Results of GAME-Siberia Project - (Extended
Abstract)
著者
Kodama Yuji
雑誌名
The science reports of the Tohoku University.
Fifth series, Tohoku geophysical journal
巻
36
号
4
ページ
359-368
発行年
2003-05
TOhoku Geophys. Journ. (Sci. Rep. TOhoku Univ., Ser. 5), Vol. 36, No. 4, pp. 359-368, 2003
Hydrology in Lena River Basin
Preliminary Rresults of GAME-Siberia Project
(Extended A bstract)
YUJI KODAMA
Institute of Low Temperature Science, Hokkaido University, Sapporo 060-0819 Japan
(Received January 10, 2003)
1. Introduction
GAME-Siberia is one of regional study group in the GAME (GEWEX Asian
Monsoon Experiment), which is one of Global Energy and Water Experiment projects
under the World Climate Research Program. The project started in 1996 funded by
Ministry of Education, Sports and Culture, and the phase I ended in the fiscal year of
2001. More than 50 scientists and students are involved in this project. Here the
primary results of the GAME-Siberia project are shown. The detail information on
individual studies is summarized in the activity reports (see References).
2. Objectives
The Siberia regional study group have set the following four scientific objectives and two operational objectives : 1) Clarify the physical processes of the
land-surface/atmo-sphere interacting system ; 2) Clarify the characteristics and variability of regional
energy/water cycle ; 3) Obtain the climate trend land-surface change during the past 50
years and evaluate possible feedback processes ; 4) Improve and develop models
describ-ing the energy/water exchange and atmosphere-land surface systems ; 5) Collection and
archive of regional ground based/satellite data ; 6) Establishment of observational
network for long-term variation study, and development of hardware.
3. Structure
3.1. Observation site
Three observational sites are chosen for typical land conditions in Siberia : Tiksi as
a tundra site, Yakutsk for flat taiga, and Tynda for mountainous site (Fig. 1).
3.2. Project groups
In order to implement the project, researchers are grouped to the following :
Tundra Group ; Plain Taiga Group ; Alas Group ; Mountainous Taiga Group ; Regional Observation Group ; Airborne Observation Group ; Modeling Group ; Satellite Group.
Fig. 1. Eastern Siberia and regional observation site
361 Phi
\\\
P \<4,-R-971(4
4MFA.TB) lb1:41keK
cK,KF.KT) C ACO 0,r7
0 CS,SE) 0 1000 Fig. 3. 2000 3000 Map of the tundra site4000
3.3. Promoting committees and institutes
The main promoting organization is the Japan National committee for
GAME-Siberia and Russian National Committee for GAME, which deals with the promotion,
control and funding of the project. Several memorandum of understanding and
agree-ments are made between the committees and institutes for implementing the project.
The institutes in Japan are : Institute for Hydrospheric-Atmosphere Sciences, Nagoya
University, Nagoya ; Institute of Geosciences, Tsukuba University, Tsukuba ; Faculty
of Agriculture, Iwate University, Morioka ; Institute of Low temperature Science,
Hokkaido University, Sapporo ; Faculty of Agriculture, Tokyo University of
Agricul-ture and Technology, Fuchu ; Faculty of Science, Tohoku University, Sendai ; Faculty
of Agriculture, Okayama University, Okayama ; Center for Ecological Studies, Kyoto
University, Ohtsu ; Faculty of Agriculture, Mie University, Tsu ; Frontier Research
System for Global Change, Yokohama. The Russian institutes are : Institute of
Geogra-phy, RAS, Moscow ; State Hydrological Institute, St. Petersburg ; All Russian Research
Institute of Hydrometeorological Information-World Data Center, Obninsk ; Central
Aerological Observatory, Moscow ; Permafrost Institute, RAS, Yakutsuk ; Institute of
Yakutsk ; Faculty of Science, Moscow State University, Moscow ; Institute of Atmo-spheric Physics, RAS, Moscow ; Institute of Geography, Siberian Branch, Irkutsk.
4. Preliminary Results
4.1. Tundra
Tundra site is characterized by permafrost, tundra vegetation and snow drift (Fig.
2)
The objectives of Tundra group are : 1) Seasonal and inter-annual variation of
water balance of tundra watershed ; 2) Seasonal variation of 1-dimensinal energy and
water fluxes ; 3) Spatial distribution of surface and soil conditions. The experimental
watershed was established and a meteorological mast was erected to observe
one-dimensional water and energy fluxes (Fig. 3).
Study on the seasonal variation of heat balance over tundra (Fig. 4) showed that 30%
of net radiation goes for warming atmosphere, 50% for evapo-transpiration and 20% to
ground. Those fluxes are dependent on the wind directions : Large sensible heat flux,
cold air temperature for NE on-shore wind and small sensible heat flux, high air
temperature and large vapor deficit for SW wind.
Table 1 water balance for the tundra watershed. By Kodama et al.
Year Period P M F. Q dS 1997 1998 1999 6/18-9/4 6/18-9/4 6/13-9/8 average Std.Dev. 220*' 76*' 99*' 131 77 187" 120' 65" 124 61 67" 44" 55" 55 11 381*' 148*' 110*' 213 146 --41*4 5.4 _ —13 24
'Observed , 'Degree day Method, "Bulk Method *4Recession Analysis
, 'Residual, "Penman Method
Table 1 lists the summer water balance componets of the experimental watershed
(Fig. 3) of 5.5 km2 for 3 years from 1997 to 1999. The inter-annual deviation in
precipita-tion (P) snow accumulaprecipita-tion/melt (M) and discharge (Q) are large, whereas that of the
evapo-transpiration is small.
4.2. Plain taiga
The objectives of the plain taiga research group are : 1) to determine the character-istics of seasonal variation in one dimensional heat and water fluxes over larch and pine
forests ; 2) phenology and physiology of trees and their relationship to fluxes ; 3)
modeling of the water and heat fluxes ; 4) to determine the characteristics of water cycle using stable isotopes.
Plant activity strongly affects the energy balance above larch forest (Fig. 5).
Larger sensible heat flux is observed before foliation, and smaller during foliation.
363 -Sensible N -w Latent Temp.2m NW _311 NE E
NW(
we , sfoT Net OW m2) N ik0-- 20_134,-._ NWirly. E
_..„W; , E t SW . , SE SW ...__.- SE ,--- S sFig. 4. Wind directional dependency of turbulent fluxes, net radiation, vapor deficit
and air temperature. By Kodama et al.
300 200 100 0 -100 1998 J 191.14
;IPill
1.i
,loYiTC`.= ,y a : [Cr! lo,thrAlmo, Scnyffile heal Ibex Lolf,t henFfigx „ (k ,,id hr, _nor,'DIChalki,' Pie! 4. 71Ie
, 4.4.COAX!,
Fig. 5.
Apti/ Ma). /woe fray it fig. Sep, (jet.
1111.1111111
Son.- (lpcninn nlviarti
Energy fluxes of larch forest By Ohta et al.
not control the transpiration rate. The dryer soil and larger transpiration in August,
1998 than 1997. Stable isotope study reveals water from permafrost thawing is used for
transpiration in dry year.
Heat balance study over pine forest revealed : 1) seasonal variation of latent heat
flux was similar to sensible heat flux, 2) after rainfall, latent heat flux becomes large, 3)
small evapo-transpiration in rainless periods, 4) understory evapo-transpiration is 40%
of that of above canopy, 5) the mean evapo-transpiration was 1.7 mm day' for pine
forest, whereas for larch forest was 1.5 mm day'.
4.3. Alas
Heat and water balance study (Fig. 6) over larch forest near alas site revealed : 1) Before foliation, sensible heat flux is larger than latent heat flux, thus larger Bowen ratio,
12 10 8
ig 6
, 4 2 0 Ii l^ ti , -H - Rn-G-J-H 4.0 3.5 3.0 2,5 2.0 1.5 PI 1.0 0.5 0.0 4/1 5/1 6/1 7/1 date 8/1 9/1 ^ ^ • •••• * * ** *••. ." ^ ^• ^:• *• ••••t**1^ ^ •**
^ •^ #•V^•*•
. • ^^
*.v • )4#% i r41 4 thtfr
• /A :•
• • ... • . 10/1 4/1 350 300 250 200 150 100 50 0 5/1 6/1 7/1 date 8/1 9/1 10/1 tr 118.2 274.4 Fig. 6. INPUT OUTPUT ^ snow is rain ^ evaporationHeat and water balance over larch forest near alas site. By Tanaka et al.
2) During foliation, latent heat flux
variation, thus smaller Bowen ratio.
in the water balance.
becomes larger and sensible heat flux has small 89% of rain and snow is the evapo-transpiration
4.4. Airborne observation
Aircraft observations were carried out with cooperation with the Central
Aer-ological Observatory, Moscow for 9 days from before the foliation to during the foliation
in 2000. CO, profiles (Fig. 7) showed the smaller CO2 profiles after foliation. The wind
36E
•
COMM Pi2te V II,YlSH1N-1ii ii.Ned for Ihe idivratt nivierention in 101' and the crew, latin and 1;c/end:I..4R in front. Refer Figure I an the lingo 44.
Fig. 7.
-Cokw Mit vi. The working space in the rmairch silreraft 11-113SITIN-18. Aircraft and researchers for airborne observation By
11.0„v,-1.1 I. UK]. IffpNil. i1.411:4, VII,. CI If., kiI
1474\WVV1CleVV44164,errIrWO.
e '..h.r.',Ixklvr.i IIILLithon, IE.:,
.5
P1,411441,4%M
If4404,,arri.,4
, -': , .. ' ' '. , '. . ' ' '
68 A1,10, ier le n'AIII!, ,ciir '
5„..,,.:....,,,,,r''''',..,-,41411,1„..,,,,,r4',V,I,AniN,
r 4 M 1-1 —I--E. I I ' I ,AITtC11111,ilii.ti,,,' C. 28 244'A"1`,,,c.44,,,,,,j,k,a4,,,,,,,,_444,Pr#445,, '', .. 221 f I —.--1— ' I Sal,c, lzmix.161,u,',. 1 40 - 11i,l'01 j'At'446,4.0:',"'.1A.4 20-frP, Wuxi --.1 1,:ii—rr-r— T 4-1.11.iN]iin—. 1 Vid :1.7 ,11^1 1 1 tYpIN 1 1'1'1 I I 1' f I' 1 f'. 1 i I 1 Hiyama et al. 21 41 50 50 l71~i11IL'J. Nn 71 bif 27hg.2 1n ovonpic olihe sulnoc., temporature. clisirihifficii Also shit, n in Ih ligurc urc IL 1;01 V/011tiL[11111d Fpood lluctualinns..Ciiilal ^,110 speed Ihrinations IF lluuttdrls, and alr lemporore
obtained [(OM 1{1t6313 dci tSCA.
Fig. 8. Results of aircraft measurements. From the top, horizontal wind speed fluctuations, vertical wind speed fluctuations, absolute humidity, air temperature,
surface temperature and surface conditions are shown. By Hiyama at al.
20 21 22 23 24 25 28 27 28 20 30 31 32 Figure I The distribution of the week when the NMI exceeds over 0.2 and NMI reaches annual maximum (b) Pixels in which the NDVI dues Hot exceed row 02 were exeIntled
the analysis, and denoted by gray color. The block color stands for t he pixel that has earlier week than the earliest week of the color sralet and the white volt.' the pixel that has later week
than the latest week of the c.tdor scale,
Fig. 9. The distribution of the week when the NDVI exceeds 0.2 (a), and the NDVI reaches the annual maximum (b). By Suzuki et al.
tions due to the special thermal characteristics of Lena River flood plain.
4.5. Satellite imagery studies
The normalized difference vegetation index was studied using AVHRR images.
Fig. 9 shows the distribution of the week of the year when the NDVI exceeds 0.2 (a) and
the NDVI reaches the ual maximum over Eurasian continent (b). The both figures
indicates that the vegetation is activated earlier in the western part of the Eurasia than
the eastern part.
In order to detect the snowmelt distribution, the brightness temperature difference
between 19GHz and 37GHz of AVHRR (DT) was calculated and then {(DT) 'evening
(DT)morning was plotted in Fig. 10. The melting area is shown by red color.
4.6. Modeling studies
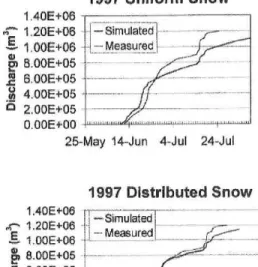
Since no tall vegetation existed in tundra area, snowdrift is frequently observed, and
a distributed hydrological model simulated runoff differently with and without snowdrift
(Fig. 11). Fig. 12 display the comparison of observed and calculated diurnal variation of
heat fluxes for the larch forest and the pine forest. The calculated sensible heat flux is
overestimated for the larch forest, whereas it is reasonable for pine forest. The
simulat-ed latent heat flux is slightly smaller than the observsimulat-ed result in the afternoon for the
367
Fig. 10.
1,1
An example
of snowmelt
detection
by Ohno
et al.
1997 Uniform Snow
1.40E+06
s• 1.20E+06
1—Simulated
-5,
1,00E+06
IL—
Measured
Er)
8.00E+05
2 6,00E+06
.—•—
.44
4.00E+05
12 2 .00E+05
25-May 14-Jun 4-Jul 24-Jul
1997 Distributed now 1A0E+06 4.... 1,20E+05 —Simulated
t 1,00E+06
L--Measured
g, 8,00E+05
. 0,00E+05 4,00E+06 2,00E+05 0.00E+00 • • 0,00E+00 isjel,111:26-May 14-Jun 4-Jul 24-Jul
Fig. 11. A simulated results of accumulated runoff with uniform snow distribution (upper) and distributed snow (lower). By Hizman et al
5. Concluding Remarks
1) Land surface conditions substantially influence the heat and water
Especially plant activities affects largely the seasonal variation of them.
2) Frozen ground as well as active layer affects the hydrology of the
cycles.
(a) LARCI1000509
I.010 MX
710 E 11 11 TIME (YST) TIME (YST) FIG. 1. Comparison of observed and calculated diurnal variation of heat fluxes at the larch site. (a) 9 May 2000 and (b) 19 June 2000.
wo (A) rp.sxm
de0
,po ... 0 d I7 la 74 0 6 18
TIME (YST)TIME (Vsn
FIG. 2. Same as fig.l but for the pine site. (a) 9 May 2000 and (b) 5 June 2000.
Fig. 12. Comparison of observed and calculated diurnal variation of heat fluxes the larch site (upper) and the pine site (lower) for two different days. Yarnazaki. at By Elevations of 3) Snow
surface and frozen table are also important. and river ice influence the runoff response.
References
Japan sub-Committee for GAME-Siberia, 1998: Activity report of GAME-Siberia 1998, GAME publication No. 14, 224 pp.
Japan National Committee for GAME GAME-Siberia sub Committee, 2000: Activity report of GAME-Siberia 1999, GAME publication No. 21, 171 pp.
Japan National Committee for GAME GAME-Siberia sub Committee, 2001 : Activity report of GAME-Siberia 2000, GAME publication No. 26, 216 pp.
Japan National Committee for GAME Siberia sub-Committee, 2001: Proceeding of Siberia Workshop, March 14-15, 2001, Tokyo, JAPAN, GAME publication No. 30, 167 pp.