Impact of nutritional status in the era of FOLFOX/FIRI-based chemotherapy
日本大学医学部外科学系消化器外科分野
岡田 俊次 申請年 2018 年
指導教員 高山 忠利
R E S E A R C H Open Access
Impact of nutritional status in the era of FOLFOX/FIRI-based chemotherapy
Shunji Okada, Shintaro Yamazaki*, Teruo Kaiga, Tomoya Funada, Mitsugu Kochi and Tadatoshi Takayama
Abstract
Background:The nutritional status plays a pivotal role during anticancer therapy. This study analyzed whether nutritional status influences the outcomes in the era of FOLFOX/FIRI therapy.
Methods:The patients were divided into two groups according to whether the nutritional status was well (serum albumin level≥3.8 g/dL or a≥1.0 g/dL increase as compared with the value before chemotherapy) or not before and 2 and 6 months after the start of chemotherapy. Chemotherapy-related adverse events (AE), treatment effect, and compliance were evaluated according to the nutritional status. The progression-free survival (PFS) and overall survival (OS) were assessed based on the nutritional status at 6 months.
Results:Between 2010 and 2013, data on 108 consecutive patients were analyzed. At 2 months after chemotherapy, the hematotoxicic AE and the value of tumor markers did not differ significantly. The non-hematotoxic AE were less frequent in patients in the well-nourished group (grade 2, 15.9 vs. 38.5%,p< 0.01). Based on the nutritional status at 6 months after chemotherapy, the hematotoxicic AE (grade 3, 9 vs. 19.5%,p= 0.03) and non-hematotoxic AE (grade 2, 31.3 vs. 51.2%,p= 0.04; grade 3, 6.0 vs. 24.4%,p< 0.01) were less frequent, and the median CEA value (5.3 vs. 27.
75 mg/L,p< 0.01) was significantly lower in the well-nourished group. The median PFS (364 vs. 233 days,p< 0.01) and 5-year OS (26.5 vs. 11.1%,p= 0.01) are significantly better in the well-nourished group.
Conclusions:The well-nourished at initial 6 months may predict a better treatment response and fewer adverse events in FOLFOX/FIRI chemotherapy.
Keywords:Colorectal cancer, Nutrition, Chemotherapy
Background
Innovations in combination chemotherapy regimens (FOL- FOX/FORFIRI plus targeted agents) for colorectal metasta- sis have facilitated the control of tumor progression in patients with unresectable disease [1–3]. Consequently, the survival of patients with unresectable colorectal cancer has been extended [4, 5].
Tumor progression due to a poor response to chemo- therapy or worsening of general condition caused by treatment-related toxicity is the main reasons for discon- tinuing chemotherapy [6]. Although most clinical studies have focused on the effects of chemotherapy, the nutri- tional status of patients during chemotherapy is also an important factor [1–3]. Cancer-related malnutrition is
multifactorial and depends primarily on disease course and general condition of the patient.
Recently, nutritional support has been shown to enhance the response to anticancer treatment, and early nutritional support contributes to patients’survival [7–9].
However, little information is available regarding the rela- tion between the nutritional status and the outcomes of chemotherapy. The aim of this study was to analyze whether nutritional status influences the occurrence of ad- verse events, continuance of chemotherapy, and survival in the era of FOLFOX/FORFIRI therapy.
Methods Participants
The study group comprised patients who received chemotherapy (FOLFOX/FOLFIRI with or without an anti-vascular endothelial growth factor antibody or an anti-epidermal growth factor receptor agent) for initially
* Correspondence:[email protected]
Department of Digestive Surgery, Nihon University School of Medicine, 30-1 Oyaguchikami-machi, Itabashi-ku, Tokyo 173-8610, Japan
© The Author(s). 2017Open AccessThis article is distributed under the terms of the Creative Commons Attribution 4.0 International License (http://creativecommons.org/licenses/by/4.0/), which permits unrestricted use, distribution, and reproduction in any medium, provided you give appropriate credit to the original author(s) and the source, provide a link to the Creative Commons license, and indicate if changes were made. The Creative Commons Public Domain Dedication waiver (http://creativecommons.org/publicdomain/zero/1.0/) applies to the data made available in this article, unless otherwise stated.
unresectable or recurrent colorectal cancer. All patients were able to have perioral food intake. When ileus was observed, transient colostomy was made to have perioral food intake as much as possible. Patients were excluded if they had received adjuvant chemotherapy, double primary cancers, and severe comorbidity requiring a reduction in the dose of chemotherapy. The data was retrospectively collected after the chemotherapy.
Surgical indication for colorectal metastasis
The indication for liver resection was the presence of en- tire tumors of colorectal origin, which if removed would be curative in the absence of any medical contraindica- tions. Neither the number of tumors nor the tumor diam- eter limited the indication for liver resection [10]. The upper limit of the liver volume to be resected was assessed by the indocyanine green retention rate at 15 min. If the estimated remnant liver volume was considered insuffi- cient, portal vein embolization was performed before the liver resection [11]. The presence of extrahepatic metasta- ses did not contraindicate liver resection if the lesion was estimated to be curable by metachronous resection.
Assessments
The patients were divided into two groups according to whether the nutritional status was well or bad- nourished, assessed before chemotherapy and 2 months (after initial 4 cycles) and 6 months after the chemother- apy. Well-nourished was defined as a serum albumin level of ≥3.8 g/dL or an increase in the serum albumin level of≥1.0 g/dL as compared with the baseline value before chemotherapy (3.8 g/dL: lower limit of normal value at our institution). The control group was defined as a serum albumin level of < 3.8 g/dL or a decrease in the serum albumin level of < 1.0 g/dL when the baseline serum albumin level was≥3.8 g/dL.
Chemotherapy-related adverse events (hematotoxic AE, non-hematotoxic AE, discontinue or dose reduction of scheduled chemotherapy) were evaluated 2- and 6 months after the chemotherapy. Based on the nutri- tional status at 6 months after the start of chemotherapy, the response of chemotherapy, progression-free survival (PFS), and overall survival (OS) were evaluated.
Hematotoxicity was assessed according to the Com- mon Terminology Criteria for Adverse Events (CTC- AE), version 5.0. [12] Complications were assessed and graded by a single observer (S.O.) who was not involved in the administration of chemotherapy. This study was confirmed by the institutional review board of our hospital.
Statistical analysis
Data are expressed as median values and ranges or as absolute values and percentages.pvalues of < 0.05 were
considered to indicate statistical significance. Student’st test, theχ2 test, the Mann-WhitneyUtest, and the Fish- er’s exact test were used for univariate analysis as re- quired. Survival rates were calculated using a Cox proportional-hazards model, survival curves were ob- tained using the Kaplan-Meier method, and comparisons were made using the log-rank test. All statistical analyses were performed with the use of a statistical software package (JMP version 9.0, SAS Institute Inc., Cary, NC, USA).
Results Participants
Between May 2010 and January 2013, FOLFOX/FOL- FIRI-based chemotherapy was given to 157 consecutive patients with colorectal cancer. A total of 49 patients were excluded: 31 patients had no target lesions (adju- vant chemotherapy), 9 had double primary cancers, 9 had serious concurrent illnesses requiring reduced doses of anticancer agents, and 1 received cetuximab. Data on the remaining 108 consecutive patients were analyzed.
Patient characteristics before chemotherapy
There was a total of 108 patients and the median age was 65 years (range 34–83) (Table 1).
There were 75 patients with colon cancer and 33 pa- tients with rectal cancer. The 17 patients had a primary unresectable cancer with metastasis. The rate of KRAS gene mutation is 38.0% (41/108 patients). There were 30 patients (27.8%) of FOLFOX and 78 patients (32.2%) of FOLFIRI at first line chemotherapy. The 41 patients (38.0%) received anti-vascular endothelial growth factor (VEGFR) antibody, and the 38 patients (35.1%) received an anti-epidermal growth factor receptor antibody. The serum carcinoembryonic antigen (CEA) value (median 18.0 ng/mL [interquartile range (IQR): 4.7–65.3]) and the carbohydrate antigen (CA) 19-9 level (35.7 U/mL [6.-329.4]).
Hematotoxicity and nutritional status at 2 months The nutritional status was estimated and divided into the two groups according to the nutritional status after the 4 cycles (2 month) of FOLFOX/FIRI therapy. There were 69 patients in the well-nourished group and 39 pa- tients in the control group (Table 2). The proportion of age, gender, WHO performance status, BMI, site of pri- mary tumor, and residual of the tumor did not differ sig- nificantly between the well-nourished and control. There was no significant difference of the first line chemother- apy regimen and additional targeting agent between the two groups.
As for the chemotherapy-induced AE, the hematotoxic AE tended to less frequent in well-nourished (grade 2 18.8 vs. 30.8%, p= 0.11). The non-hematotoxic AE was
Okadaet al. World Journal of Surgical Oncology (2017) 15:162 Page 2 of 7
significantly less frequent in well-nourished (grade 2 15.9 vs. 38.5%, < 0.01). There was no significant differ- ence in the median tumor marker value in 2 months after initial chemotherapy (CEA 16.8 vs. 6.9 mg/L, p= 0.39; CA19-9 19.6 vs. 15.6,p= 0.19).
Patients’outcomes and nutritional status at 6 months Six months after the start of chemotherapy, there were 67 patients in the well-nourished and 41 in the control group
(Table 3). There were significant difference in the proportion of bad WHO performance status (> 2) [6 (9.0%) patients vs.
16 (39.0%) patients,p < 0.01] and who were able to have perioral intake [67 (100%) patients vs. 36 (87.9%) patients, p= 0.02]. The median number of cycles of performing FOL- FOX/FIRI therapy during 6 months was significantly longer in the well-nourished group than that in the bad-nourished group [21 cycles, (6–24) vs. 11 (4–24),p< 0.01]. As for the AE of the chemotherapy, the hematotoxic AE was Table 1Patient characteristics
n= 108
Age Median (range) 65 (34–83)
Gender (male/female) 58/50
Performance status (0, 1, 2, 3) (91, 16, 1, 0)
Body mass indexa 23.3 (13.7–36.9)
Primary tumor site
Colon/rectum 75/33
Right-sided/left-sided 51/57
Residual of primary tumor 17 (15.7%)
History of liver resection for metastasis 27 (25.0%)
Number of liver metastasisa 5 (0–28)
Target lesion of chemotherapy
Primary tumor 19 (17.6%)
Lymph node 28 (25.9%)
Peritoneum 18 (16.7%)
Lung 29 (26.9%)
Liver 43 (39.8%)
KRAS status Wild 67 (62.0%)
First line chemotherapy FOLFOX/FOLFIRI 30/78
Add-on targeting agent VEGFR 41 (38.0%)
EGFR 38 (35.1%)
None 29 (26.9%)
Preoperative statusa
White blood cell (mm3)(mm3) 6000 (3400–9950)
Neutrophil (mm3)(mm3) 3887 (1659–3750)
Lymphocyte (mm3)(mm3) 1352 (512–2195)
Albumin (g/dl) 3.8 (2.4–4.7)
Total bilirubin (mg/dl) 0.46 (0.19–3.82)
Aspartate aminotransferase (IU/L) 23 (12–203)
Lactate dehydrogenase (IU/L) 196 (21–1949)
Blood urea nitrogen (mg/dL) 13.7 (4.7–27.7)
Creatinine 0.68 (0.42–1.59)
C-reactive protein (mg/dL) 0.45 (0.1–8.94)
Carcinoembryonic antigen (mg/L) 18.0 (4.7–65.3)
CA19-9 (mg/L) 35.7 (6.5–129.4)
Data express median with internal quadorant range
aMedian with range
significantly less frequent in well-nourished (grade 3, 9.0 vs.
19.5%,p= 0.03). The non-hematotoxic AE was also signifi- cantly less frequent in patients with well-nourished (grade 2, 31.3 vs. 51.2%,p= 0.04, grade 3, 6.0 vs. 24.4%,p< 0.01).
The rate of discontinue of chemotherapy (6.0 vs. 34.1%, p< 0.01) and dose reduction (6.0 vs. 24.4%,p< 0.01) was significantly smaller in patients in the well-nourished group.
The rate of conversion surgery is significantly frequent in the well-nourished (9.0 vs. 2.4%, p = 0.18). The median serum CEA level was significantly lower in the well- nourished than in the control group (5.3 U/mL [2.85–
15.05] vs. 27.75 U/mL [7.98–78.9], p < 0.01), while the CA19-9 value did not differ significantly (p= 0.25).
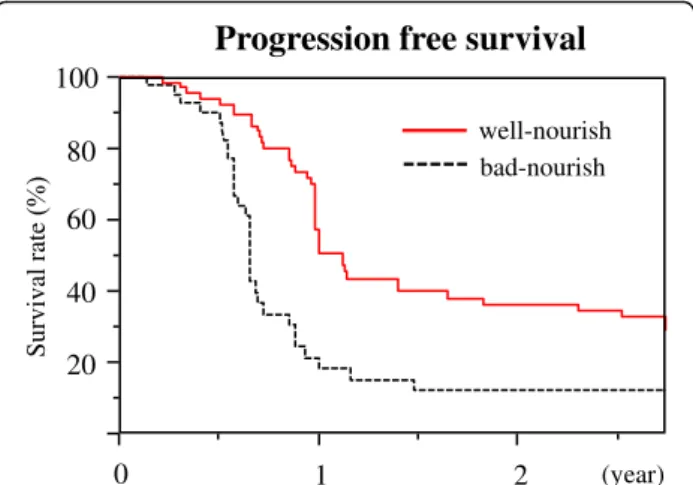
Progression-free survival and overall survival based on the nutritional status
The median follow-up time in this study is 3 years. The median PFS is significantly better in the well-nourished
than that in the control (364 vs. 233 days,p< 0.01) (Fig.
1). Also, the OS is significantly better in the well- nourished (1 year, 96.9 vs. 92.7%; 3 years, 38.2 vs. 18.4%;
5 years, 26.5 vs. 11.1%,p= 0.01) (Fig. 2).
Discussion
Our study showed that patient’s nutritional status during chemotherapy is closely related to the occurrence of AE and response of chemotherapy. The well-nourished at 6 months after chemotherapy is associated with a better response to anticancer therapy, and it contributes to prolong PFS and OS in FOLFOX/FIRI therapy.
Malnutrition is a serious problem in patients who receive anticancer therapy. Cancer-related malnutrition is multifactorial and reflects the balance between disease course and its treatment [4–6, 13]. Nutritional imbal- ance is caused by tumor progression and cancer-related hyper metabolism [8, 9, 12]. Chemotherapy-induced Table 2Serum albumin trends at 2 months after chemotherapy
Well-nourished (n= 69) Bad-nourished (n= 39) pvalue
Age (median, range) 63 (34–83) 66 (36–80) 0.67
Gender (male) 38 20 0.7
WHO performance status (> 2) 6 (8.7%) 11 (28.2) < 0.01
Body mass index (median, range) 24.1 (18.6–33.8) 23.1 (13.3–28.8) 0.47
Primary site
Rectum 23 10 0.4
Right-sided (n= 51) 27 24 0.03
Left-sided (n= 57) 40 17 0.15
Residual of primary tumor 12 5 0.53
First line regimen
FOLFOX/FOLFIRI 19/56 11/22 0.94
Add-on targeting agent
VEGFR (n= 41) 30 (43.5%) 11 (28.2%) 0.11
EGFR (n= 38) 26 (37.7%) 12 (30.8%) 0.47
None (n= 29) 13 (18.8%) 16 (41.0%) 0.01
Adverse eventa Hematotoxicity
Grade 2 13 (18.8%) 12 (30.8%) 0.11
Grade 3 4 (5.8%) 4 (10.3%) 0.39
Grade 4 0 (0%) 1 (2.6%) 0.18
Non-hematotoxicity
Grade 2 11 (15.9%) 15 (38.5%) < 0.01
Grade 3 7 (10.1%) 6 (15.4%) 0.42
Grade 4 1 (1.4%) 0 (0%) 0.68
Tumor markerb
CEA 16.8 (3.7–45.1) 6.9 (2.9–14.4) 0.39
CA19-9 19.6 (2.3–46.9) 15.6 (6.9–81.2) 0.19
aAccording to the CTC-AE Ver5.0
bMedian with internal quadorant range
Okadaet al. World Journal of Surgical Oncology (2017) 15:162 Page 4 of 7
adverse events also negatively affect nutritional status [14]. Our study showed that the nutritional status at ini- tial 2 months might be very important to continue chemotherapy without severe AE. Therefore, nutritional support may indispensable for the patients in the bad- nourished group.
The hematotoxic AE more objectively reflects chemotherapy-induced damage, and it often predicts the occurrence of severe patients’ condition such as sepsis.
In contrast, the non-hematotoxic AE reflects an early
sign of bad-nourished during chemotherapy. Our study showed that the non-hematotoxic AE occurred prior to the hematotoxic AE. Therefore, maintaining patients well-nourished during chemotherapy might have a key role in the outcomes of treatment. Therefore, the meas- urement of serum albumin trend may be important to predict patient’s outcomes.
A low serum albumin level before surgery is known to be associated with poor outcomes in patients with colo- rectal cancer. The Glasgow prognostic score, a combined Table 3Serum albumin value at 6 months after chemotherapy
Well-nourished (n= 67)
Bad-nourished
(n= 41) pvalue
Age (Median, range) 64 (35–80) 68 (34–83) 0.23
Gender 37 21 0.68
WHO performance status (> 2) 6 (9.0%) 16 (39.0) < 0.01
Body mass indexa (Median, range) 24.1 (17.9–35.0) 23.1 (20.1–28.8) 0.67
Perioral food intake 67 (100%) 36 (87.9%) 0.02
Primary site
Rectum 22 18 0.25
Right-sided (n= 51) 26 24 0.04
Left-sided (n= 57) 44 13 < 0.01
Residual of primary tumor 13 4 0.18
Continuing regimen
FOLFOX/FOLFIRI 16/51 13/29 0.38
Performing chemotherapy cycles during 6 months 21 (6–24) 11 (4–24) < 0.01
Add-on targeting agent
VEGFR (n= 48) 34 (50.7%) 14 (34.1%) 0.09
EGFR (n= 26) 11 (16.4%) 15 (36.6%) 0.02
None (n= 34) 22 (32.8%) 12 (29.3%) 0.7
Adverse event Hematotoxicity
Grade 2 21 (31.3%) 20 (48.8%) 0.18
Grade 3 6 (9.0%) 8 (19.5%) 0.03
Grade 4 0 (0%) 1 (2.4%) 0.72
Non-hematotoxicity
Grade 2 21 (31.3%) 21 (51.2%) 0.04
Grade 3 4 (6.0%) 10 (24.4%) < 0.01
Grade 4 1 (1.5%) 1 (2.4%) 0.73
Discontinueb 4 14 < 0.01
Dose reduction 4 10 < 0.01
Conversion to surgical treatment 6 1 < 0.18
Tumor markerc
CEA (mg/L) 5.3 (2.85–15.05) 27.75 (7.98–78.9) < 0.01
CA19-9 (mg/L) 15 (7.05–71.25) 33.3 (6.15–1040.13) 0.25
aAvailable 89 patients’data
bExcept for conversion surgical treatment patients
cMedian with internal quadorant ratio
score based on hypoalbuminemia and the C-reactive protein level, is an established predictor of survival after surgery [8, 9]. Information on the nutritional status of patients who receive chemotherapy remains limited. Our results were consistent with the Glasgow prognostic score and suggested that nutritional status during chemotherapy might play a vital role in outcomes.
The trend in serum CEA levels, PFS, and OS was bet- ter in the well-nourished. The patients in the well- nourished group completed chemotherapy as scheduled without serious adverse events. Therefore, there was no need for dose reduction and pending of chemotherapy in patients in the well-nourished group. Consequently, a sufficient response to treatment was obtained, and
general condition will improve as the results of antican- cer therapy.
Conclusion
In conclusion, maintaining a well-nourished during FOLFOX/FIRI therapy might contribute to higher re- sponse to cancer and fewer adverse events for patients.
A nutritional support should be one of the options for the patients in bad-nourished such as highly advanced cancer and older patients.
Acknowledgements None.
Funding
There is no funding support in this study.
Availability of data and materials Please contact the authors for data requests.
Authors’contributions
SO wrote the manuscript. TF, SO, and TK collected the patients’data. MK and TT are responsible for the supervision of the study. SY contributed to the study concept. All authors read and approved the final manuscript.
Ethics approval and consent to participate
This study is approved by the Institutional scientific committee (RK-121109-4).
Consent for publication
Written informed consent form was obtained from all patients in our institutional format style.
Competing interests
The authors declare that they have no competing interests.
Publisher’s Note
Springer Nature remains neutral with regard to jurisdictional claims in published maps and institutional affiliations.
Received: 1 February 2017 Accepted: 13 August 2017
References
1. Hurwitz H, Fehrenbacher L, Novotny W, et al. Bevacizumab plus irinotecan, fluorouracil, and leucovorin for metastatic colorectal cancer. N Engl J Med.
2004;350:2335–42.
2. Tournigand C, André T, Achille E, et al. FOLFIRI followed by FOLFOX6 or the reverse sequence in advanced colorectal cancer: a randomized GERCOR study. J Clin Oncol. 2004;22:229–37.
3. Grothey A, Sargent D, Goldberg RM, et al. Survival of patients with advanced colorectal cancer improves with the availability of fluorouracil- leucovorin, irinotecan, and oxaliplatin in the course of treatment. J Clin Oncol. 2004;22:1209–14.
4. Marik PE, Zaloga GP. Early enteral nutrition in acutely ill patients: a systematic review. Crit Care Med. 2001;29:2264–70.
5. Montejo JC, Zarazaga A, López-Martínez J. Immunonutrition in the intensive care unit. A systematic review and consensus statement. Clin Nutr. 2003;22:
221–33.
6. Elia M, Van Bokhorst-De Van Der Schueren MAE II, Garvey J, et al. Enteral (oral or tube administration) nutritional support and eicosapentaenoic acid in patients with cancer: a systematic review. Int J Oncol. 2006;28:5–23.
7. Ravasco P, Monteiro-Grillo I, Vidal PM, et al. A prospective, randomized, controlled trial in colorectal cancer patients undergoing radiotherapy.
Dietary counseling improves patient outcomes. J Clin Oncol.
2005;23:1431–8.
8. Roxburgh CSD, Crozier JEM, Maxwell F, et al. Comparison of tumour-based (Petersen Index) and inflammation-based (Glasgow Prognostic Score)
20 40 60 80 100
0 1 2
Progression free survival
Survival rate
(year) well-nourish bad-nourish
Fig. 1Progression-free survival according to the nutritional status 6 months after chemotherapy. The median progression-free survival was significantly longer in the well-nourished group than in the bad-nourished group (median, 333 vs. 242 days,p= 0.03)
20 40 60 80 100
0 1 2 3 4 5
Overall survival
Survival rate
(year) well-nourish bad-nourish
Fig. 2Overall survival according to the nutritional status 6 months after chemotherapy. The overall survival rate was significantly higher in the well-nourished group than in the bad-nourished group (1 year, 95.7 vs. 80.0%; 2 years, 80.2 vs. 47.1%; and 3 years, 60.8 vs. 37.7%;
p= 0.01, respectively)
Okadaet al. World Journal of Surgical Oncology (2017) 15:162 Page 6 of 7
scoring systems in patients undergoing curative resection for colon cancer.
Br J Cancer. 2009;100:701–6.
9. McMillan DC, Crozier JEM, Canna K, et al. Evaluation of an inflammation- based prognostic score (GPS) in patients undergoing resection for colon and rectal cancer. Int J Color Dis. 2007;22:881–6.
10. Yamazaki S, Takayama T, Okada S, et al. Good candidates for a third liver resection of colorectal metastasis. World J Surg. 2013;37:847–53.
11. Makuuchi M, Thai BL, Takayasu K, et al. Preoperative portal embolization to increase safety of major hepatectomy for hilar bile duct carcinoma: a preliminary report. Surgery. 1990;107:521–7.
12. Canna K, McMillan DC, McKee RF, et al. Evaluation of a cumulative prognostic score based on the systemic inflammatory response in patients undergoing potentially curative surgery for colorectal cancer. Br J Cancer.
2004;90:1707–9.
13. Valenzuela-Landaeta K, Rojas P, Basfi-Fer K. Nutritional assessment for cancer patient. Nutr Hosp. 2012;27:516–23.
14. Sánchez-Lara K, Ugalde-Morales E, Motola-Kuba D, et al. Gastrointestinal symptoms and weight loss in cancer patients receiving chemotherapy.
Br J Nutr. 2012;12:1–4.
• We accept pre-submission inquiries
• Our selector tool helps you to find the most relevant journal
• We provide round the clock customer support
• Convenient online submission
• Thorough peer review
• Inclusion in PubMed and all major indexing services
• Maximum visibility for your research Submit your manuscript at
www.biomedcentral.com/submit
Submit your next manuscript to BioMed Central and we will help you at every step:
論文の内容の要旨
氏名:岡田 俊次
博士の専攻分野の名称:博士(医学)
論文題名:Impact of nutritional state in the era of FOLFOX/FIRI-based chemotherapy (栄養状態が FOLFOX / FIRI ベースの化学療法の効果に与える影響)
FOLFOX / FOLFIRI(FOLFOX: 5- fluorouracil, l-leucovorin , oxaliplatin / FOLFIRI: 5- fluorouracil, l-leucovorin , irinotecan) +分子標的治療薬療法(bevacitumab または cetuximab )中の栄養状態の 維持が患者に与える効果を検討する。2010 年 5 月から 2013 年 1 月の期間に切除不能・進行結腸直腸癌で多 剤併用化学療法を施行した 108 人の患者データを後ろ向きに検討した。化学療法前、2 カ月後および化学療 法後 6 カ月後の栄養状態で、①栄養良好群 ②栄養不良群に分類した。化学療法関連有害事象は、化学療 法後 2 および 6 ヶ月後で評価した。化学療法の開始後 6 ヶ月の栄養状態に基づき、無増悪生存期間と全生 存期間を評価した。結果:多剤併用化学療法 2 か月後の評価で、栄養良好群 69 人、対照群 39 人であった。
化学療法関連有害事象では、血液毒性は、栄養良好群で少ない傾向を認めた。(Grade2; 18.8%対 30.8%、
p=0.11)非血液毒性は、栄養良好群で有意に少なかった。(Grade2; 15.9%対 38.5%、p<0.01)。化学療法 の開始から 6 ヵ月後の評価で栄養良好群 67 人、栄養不良群 41 人であった。血液毒性(Grade3, 9.0%対 19.5%、
p=0.03)非血液毒性(Grade2, 31.3%対 51.2%、p=0.04、Grade3, 6.0%対 24.4%、p<0.01)ともに栄養 良好群で有意に少なかった。無増悪生存期間の中央値は、栄養良好群で有意に良好であった。(364 日対 233 日、p<0.01)全生存期間は栄養良好群では栄養不良群より有意に良好であった。(1 年; 96.9%対 92.7%、
3 年; 38.2%対 18.4%、5 年; 26.5%対 11.1%、 p=0.01)。考察:化学療法開始後 2 ヶ月の初期の栄養状 態による有害事象の評価では、血液毒性には有意差がなかった一方で、非血液毒性は栄養良好群で有意に 少なかった。開始初期(2 カ月後)の栄養状態の評価は化学療法の効果や副作用を予見し治療を継続させる ための重要な因子と成り得る可能性が示唆された。化学療法後 6 カ月で栄養良好群では、多剤併用化学療 法のより良い効果と関連し無増悪生存期間および全生存期間の延長との相関が示された。栄養状態不良群 の化学療法関連有害事象総数が増加し、Grade 2 および 3 の発現数は血液毒性 Grade3; 10.3%から 19.5%、
非血液毒性 Grade 3; 15.4%から 24.4%と増加した。よって、化学療法期間が長期化するほど頻度が高く、
より重度の有害事象が発生し、これにより化学療法の減量・中止を余儀なくされ患者予後の短縮につなが る可能性が示唆された。本研究の結果は多剤併用化学療法中の栄養状態が治療効果や予後に重要な役割を 果たす可能性を示した。結語:多剤併用化学療法中の患者栄養状態の維持・向上は、化学療法の効果と有 害事象の低減に寄与する可能性が示唆された。高度進行癌患者や高齢者などの潜在的栄養不良患者に対す る化学療法の補助治療の 1 つとして栄養介入が有力であることが推察された。