DOCTORAL THESIS
A Structural Relationship between
Socioeconomic Status and Health among the Elderly: A Comparative Study
between Japan and China
Supervisor: Professor Tanji Hoshi
Graduate School of Urban Environment Science Tokyo Metropolitan University
Shuo Wang
September 2014
Abstract
Five chapters are organized into this doctoral dissertation.
Chapter 1 provides the trend of population aging in the world due to extended longevity and low fertility. The proportion of elderly individuals in the Japanese population represents the highest in the world at present, with over one fifth individuals aged 65 and above. It took Japan only 24 years to double the percentage of elderly people from 7% to 14%, while it was projected to cost 25 years for China to complete this aging process. Considering the fact that older people currently constitute the majority of those in poor health, the determinants of health in old age have become a growing concern.
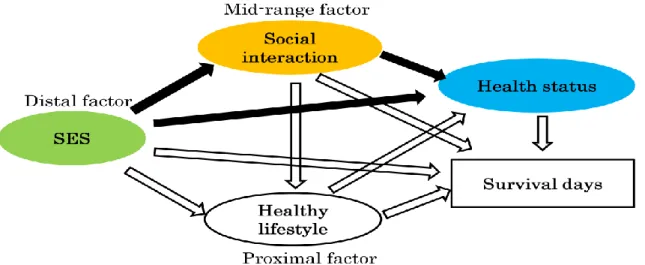
On the basis of causal distance to health, all social determinants can be divided into three levels: 1) proximal factors, 2) mid-range factors, and 3) distal factors. Proximal factors, which can be easily changed by individuals, are closest to health and include health-related lifestyles and behaviors. Social relationship and social support are regarded as mid-range factors. Distal factors cover social structure and stratification, over which people have the least control.
The purposes of this dissertation are: 1) to examine the relationship between socioeconomic status (SES) and health status of elderly people in two Asian countries
— Japan and China; 2) to inquire the mediating influence of social interaction on the association between SES and health status among elderly people in both Japan and China; 3) to investigate the SES–health mechanism through personal behaviors, such as social interaction and healthy lifestyle, and how this mechanism varies by age and gender among elderly Japanese community-dwellers.
Chapter 2 presents an empirical research on mediating effect of social interaction between SES and health status among Chinese urban community-dwelling elderly.
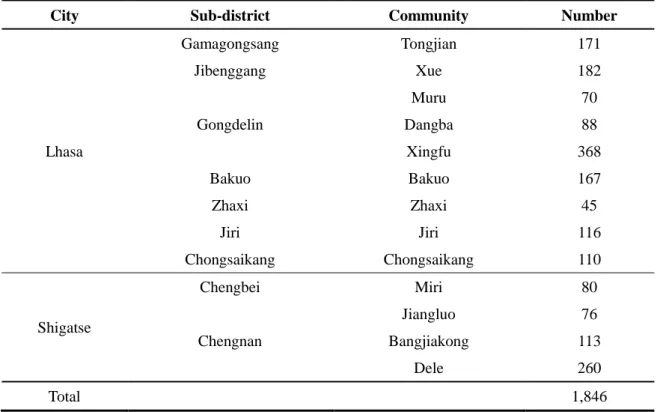
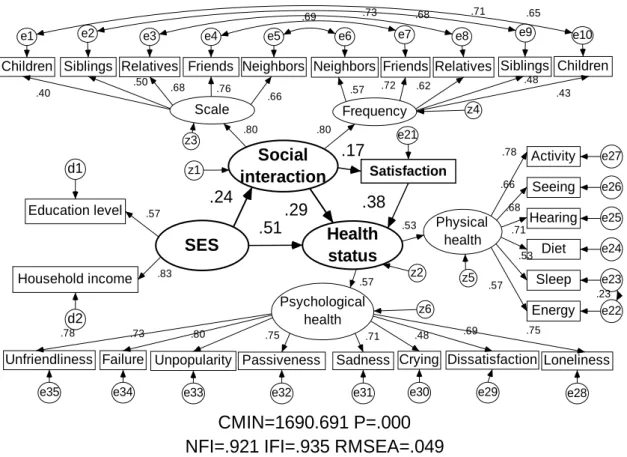
1,979 elderly individuals aged ≥60 years in 28 communities from 7 sub-districts of Lhasa City and 10 communities from 2 sub-districts of Shigatse City were invited to participate in a questionnaire based survey in 2009. Of them, 1,846 elderly answered, giving a response rate of 93.2%. The elderly people contacted their children (who did not live with them) the most (67.6%), followed by neighbors (51.5%), friends (41.0%), siblings (33.9%) and relatives (25.9%); and most elderly people had between one and three people with whom they were in contact, freely and pleasantly; the majority of elderly people were satisfied with their social interaction. In the structural model, SES had not only a direct effect, but also an indirect effect on health status by means of social interaction; compared with indirect effect, SES exerted a larger direct impact on health status, especially on psychological health. In conclusion, like western countries, people with higher SES were more likely to have better health status in China. In addition, social interaction played a mediating role on the association of SES–health status.
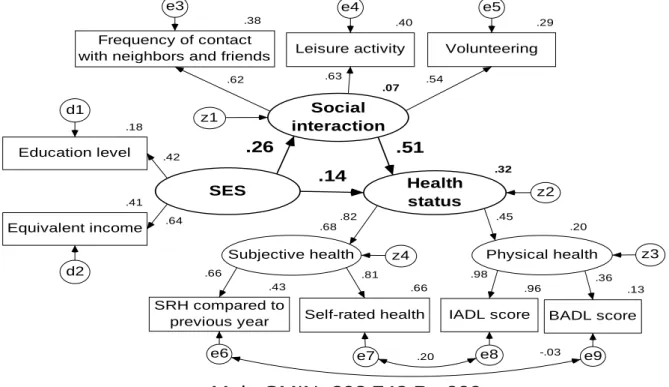
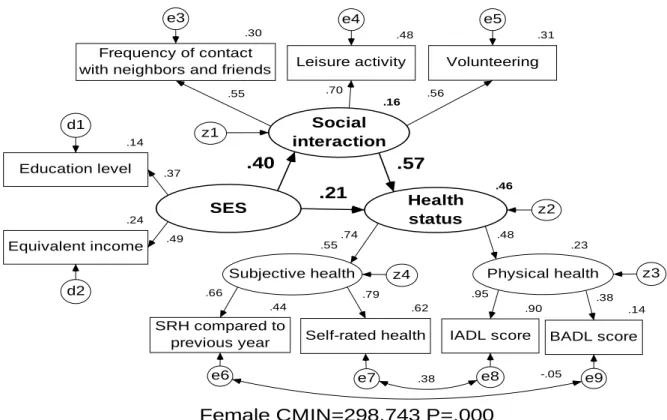
Chapter 3 presents an empirical research on mediating effect of social interaction between SES and health status among elderly suburban community-dwellers in Japan. A self-administered questionnaire was mailed to all of the elderly residents aged ≥65 years in Tama City in Japan in 2001. The results showed that SES had a positive direct impact on social interaction; and social interaction exerted a direct and positive effect on health status; SES not only directly affected health status, but also demonstrated an indirect effect via social interaction, especially on subjective health. All associations were more pronounced among elderly women. Compared with direct impact, SES was more likely
to exert an indirect impact on health status by means of social interaction. In conclusion, social interaction may partly explain SES differences in health status, especially for elderly women.
In Chapter 4, a prospective cohort study was conducted to investigate whether social interaction and healthy lifestyle reduces health disparity by SES among Japanese suburban community-dwelling elderly, and to determine whether patterns of the associations varied by age and gender. Beginning in 2001, 7,904 elderly residents of Tama City were followed for six years through self-administered questionnaires and registries. SES had no direct impact on health status and survival, but had indirect effects through social interaction and healthy lifestyle. Health status exerted the strongest influence on survival days regardless of age and gender. In summary, older individuals are able to reduce the effects of health inequalities by personal behaviors in addition to financial support from the government. The key to prolonging survival in the elderly is to promote health status through social interaction and a healthy lifestyle, especially in elderly men.
Chapter 5 summarized the important findings of this study and compared these associations in Japan and China. In the cross-sectional studies, SES had a direct effect on health status, but also an indirect effect by means of social interaction among both Japanese and Chinese elderly. By comparison, SES exerted a larger direct effect on health status in China; while SES exerted a larger indirect effect in Japan. In the longitudinal study, SES had no direct effect on survival days, but it indirectly affected survival days by social interaction and healthy behaviors among Japanese elderly. Three possible reasons were brought up for that: 1) the gap between the rich and the poor, 2) the development level of society, and 3) different usage of indicators or areas. Moreover,
several implications can be drawn from the conclusions: 1) a preventive method for ill-health was suggested with older individuals being able to diminish health inequalities through their own efforts on the basis of SES, since personal behaviors may in part contribute to the SES gradient among elderly Chinese and Japanese people; 2) interventions to improve health status of elderly people need to be country-specific, taking the development level of each country into consideration in making health policy and providing health education; 3) interventions to improve health outcomes of elderly people also need to be gender-specific and age-specific.
i
Contents
Chapter 1 Introduction ...1
1.1 Population Aging... 3
1.1.1 Global Population Aging ... 3
1.1.2 Population Aging in Japan ... 5
1.1.3 Population Aging in China ... 8
1.2 Literature Review ... 10
1.2.1 Distal Factor — Socioeconomic Status and Health... 11
1.2.2 The Mechanism of SES–Health by Healthy Lifestyle — Proximal Factor 13 1.2.3 Mid-range Factor — Social Interaction and Health ... 14
1.3 Study Objectives and Significance ... 16
1.3.1 A Comprehensive View of Prior Study and Analyses ... 16
1.3.2 Objectives of Study ... 17
1.3.3 Significance of Study ... 17
1.4 Study Design ... 18
1.5 Data and Location ... 20
1.5.1 Profile of Tibet Autonomous Region ... 20
1.5.2 Profile of Tama City ... 23
1.6 Statistical Methods ... 25
1.7 Framework of Dissertation... 26
References ... 28
Chapter 2 The Mediating Effect of Social Interaction on the Association between Socioeconomic Status and Health Status among Chinese Elderly in Tibet ...37
2.1 Background and Issue ... 39
2.2 Methods ... 41
2.2.1 Sample ... 41
2.2.2 Data Collection ... 43
2.2.3 Hypothesized Model ... 44
2.2.4 Statistical Analysis ... 45
ii
2.3 Results ... 46
2.3.1 Frequency Distribution of Characteristics of Samples ... 46
2.3.2 Measurement Model ... 53
2.3.3 Structural Model ... 55
2.4 Discussion ... 57
2.5 Conclusions ... 59
References ... 60
Chapter 3 The Mediating Effect of Social Interaction on the Association between Socioeconomic Status and Health Status among Japanese Elderly in Tama City ...65
3.1 Introduction ... 67
3.2 Methods ... 69
3.2.1 Research Population ... 69
3.2.2 Measures ... 70
3.2.3 Statistical Analyses ... 71
3.2.4 Hypothesis ... 72
3.3 Results ... 73
3.3.1 Distribution of Main Variables ... 73
3.3.2 Bivariate Analysis ... 76
3.3.3 Structural Analysis ... 77
3.4 Discussion ... 80
3.5 Conclusion ... 82
References ... 83
Chapter 4 The Effects of Socioeconomic Status and Personal Behaviors on Health among Suburban Japanese Community-dwelling Elderly over Six-year Follow-up ...89
4.1 Introduction ... 91
4.2 Material and Methods ... 93
4.2.1 Data ... 93
4.2.2 Variables ... 94
4.2.3 Research Hypothesis ... 96
iii
4.2.4 Statistical Analyses ... 97
4.3 Results ... 98
4.3.1 Bivariate Correlation Analysis Results ... 98
4.3.2 Survival Analysis Results ... 103
4.3.3 Factor Analysis Results ... 109
4.3.4 Structural Analysis Results ... 110
4.4 Discussion ... 119
4.5 Conclusions ... 121
References ... 122
Chapter 5 Conclusions and Implications ...127
5.1 Main Findings ... 129
5.2 Comparison between Japan and China ... 134
5.3 Implications ... 137
5.4 Strengths of the Study ... 140
5.5 Limitations and Future Issue ... 141
References ... 142
Acknowledgements ...143
Abstract (In Japanese) ...145
APPENDIX A: Questionnaire for Tibet Autonomous Region ...149
APPENDIX B: Questionnaires for Tama City ...157
v
List of Tables
Table 1- 1. International comparison of the speed of aging in selected countries .... 5
Table 1- 2. Trends in Population of Japan from 1900 to 2050... 6
Table 2- 1. The geographical distribution of the urban elderly in Tibet ... 42
Table 2- 2. Study subjects by age and gender ... 42
Table 2- 3. Characteristics of SES by gender... 47
Table 2- 4. Characteristics of frequency of social interaction by gender ... 48
Table 2- 5. Characteristics of scale of social interaction by gender ... 48
Table 2- 6. Characteristics of satisfaction of social interaction by gender ... 49
Table 2- 7. Characteristics of physical health by gender ... 51
Table 2- 8. Characteristics of psychological health by gender ... 52
Table 2- 9. Evaluation of measurement model ... 54
Table 2- 10. Standardized direct, indirect and total effects ... 57
Table 3- 1. Distribution of samples by age and gender ... 69
Table 3- 2. Characteristics of SES by gender... 74
Table 3- 3. Characteristics of social interaction by gender ... 74
Table 3- 4. Characteristics of health status by gender... 75
Table 3- 5. Bivariate analysis between health status and independent variables by gender ... 76
Table 3- 6. Standardized direct, indirect, and total effects by gender ... 79
Table 4- 1. Bivariate relationship between variables among younger elderly men 99 Table 4- 2. Bivariate relationship between variables among older elderly men ... 100
Table 4- 3. Bivariate relationship between variables among younger elderly women ... 101
Table 4- 4. Bivariate relationship between variables among older elderly women ... 102
vi
Table 4- 5. KMO and Bartlett’s Test... 109
Table 4- 6. The results of factor analysis ... 109
Table 4- 7. Evaluation of measurement model ... 113
Table 4- 8. Standardized direct, indirect, and total effects by age and gender... 116
vii
List of Figures
Figure 1- 1: Population aging in the world from 1950 to 2010 ... 4
Figure 1- 2: Proportion of elderly population by country from 1950 to 2050 (age ≥ 65 years) ... 4
Figure 1- 3: Population aged 65 years and over in Japan from 1900 to 2050 ... 7
Figure 1- 4: Trends in social security benefits of Japan from 1970 to 2012 ... 7
Figure 1- 5: Population aging trend in China from 1950 to 2010 ... 9
Figure 1- 6: Age structure of Chinese population in 2000 ... 9
Figure 1- 7: ICF model. ... 10
Figure 1- 8: Hypothetical model of dissertation ... 19
Figure 1- 9: Location of Tibet ... 21
Figure 1- 10: Map of Tibet ... 21
Figure 1- 11: Administrative divisions of Lhasa City ... 22
Figure 1- 12: Administrative divisions of Shigate City ... 22
Figure 1- 13: Location of Tama City in Japan ... 24
Figure 1- 14: The population trend of Tama City from 1971 to 2013 ... 24
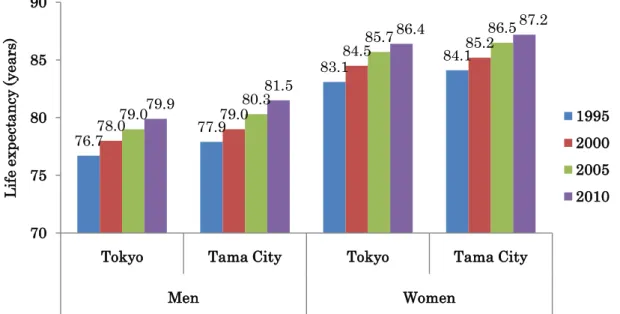
Figure 1- 15: Life expectancy at birth in Tokyo and Tama City by gender ... 25
Figure 1- 16: Framework of the dissertation ... 26
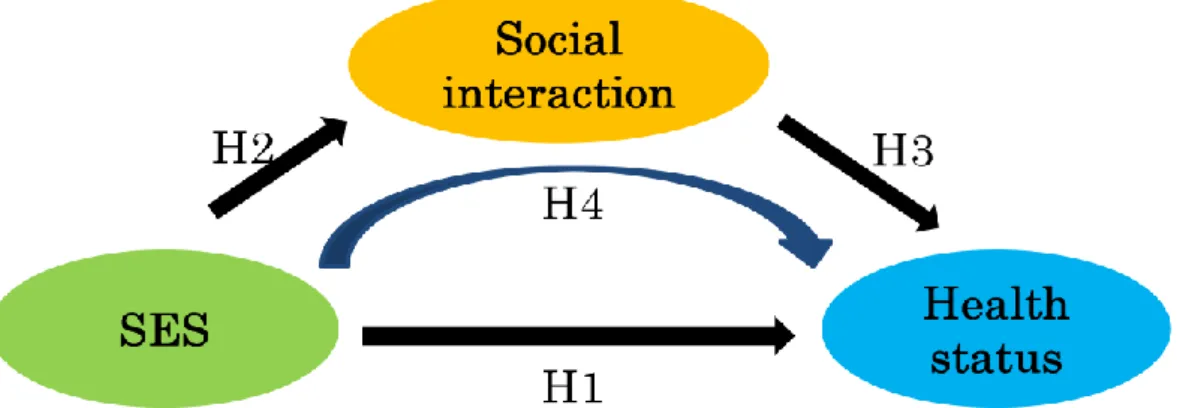
Figure 1- 17: Hypothetical model of the mediating role of social interaction on SES-health status ... 27
Figure 1- 18: Hypothetical model of the SES-health mechanism by means of personal behaviors ... 27
Figure 2- 1: Hypothesized model between SES, social interaction and health status among Chinese elderly in Tibet ... 45
Figure 2- 2: Distribution of frequency of social interaction ... 49
Figure 2- 3: Distribution of scale of social interaction ... 49
Figure 2- 4: Distribution of satisfaction of social interaction ... 50 Figure 2- 5: Structural analysis between SES, social interaction and health status
viii
among Chinese elderly ... 56
Figure 3- 1: Hypothesis of relationship between SES, social interaction, and health status ... 72
Figure 3- 2: Structural analysis of SES, social interaction, and health status among Japanese suburban elderly men. ... 78
Figure 3- 3: Structural analysis of SES, social interaction, and health status among Japanese suburban elderly women. ... 79
Figure 4- 1: Conceptual model between SES, social interaction, healthy lifestyle health status, and survival days ... 96
Figure 4- 2: Kaplan-Meier survival curves by education level 2001 ... 104
Figure 4- 3: Kaplan-Meier survival curves by equivalent income 2001 ... 104
Figure 4- 4: Kaplan-Meier survival curves by leisure activity 2001 ... 105
Figure 4- 5: Kaplan-Meier survival curves by frequency of contact with neighbors and friends 2001 ... 105
Figure 4- 6: Kaplan-Meier survival curves by volunteering 2001 ... 106
Figure 4- 7: Kaplan-Meier survival curves by healthy dietary score 2004 ... 106
Figure 4- 8: Kaplan-Meier survival curves by healthy practice score 2004 ... 107
Figure 4- 9: Kaplan-Meier survival curves by BADL score 2004 ... 107
Figure 4- 10: Kaplan-Meier survival curves by IADL score 2004 ... 108
Figure 4- 11: Kaplan-Meier survival curves by SRH 2004 ... 108
Figure 4- 12: Structural model between SES, social interaction, healthy lifestyle, health status, and survival days among younger male. ... 111
Figure 4- 13: Structural model between SES, social interaction, healthy lifestyle, health status, and survival days among older male. ... 111
Figure 4- 14: Structural model between SES, social interaction, healthy lifestyle, health status, and survival days among younger female. ... 112
Figure 4- 15: Structural model between SES, social interaction, healthy lifestyle, health status, and survival days among older female ... 112 Figure 4- 16: Standardized effects of SES, social interaction, healthy lifestyle and
ix
health status on survival days by age and gender ... 117 Figure 4- 17: Standardized effects of SES, social interaction, healthy lifestyle and health status on survival days by gender ... 117 Figure 4- 18: Standardized effects of SES, social interaction and healthy lifestyle on health status by age and gender ... 118 Figure 4- 19: Standardized effects of SES, social interaction and healthy lifestyle on health status by gender ... 118
Figure 5- 1: The structural analysis of SES, social interaction, and health status among elderly Chinese people ... 130 Figure 5- 2: The structural analysis of SES, social interaction, and health status among elderly Japanese people ... 131 Figure 5- 3: The structural analysis of SES, social interaction, healthy lifestyle, health status and survival days among elderly Japanese people over six years follow-up ... 132 Figure 5- 4: Comparison of structural relationships between Japan and China ... 134 Figure 5- 5: Gini coefficients from 1985 to 2009 in Japan ... 136 Figure 5- 6: Gini coefficients from 2003 to 2013 in China ... 136 Figure 5- 7: Prevention and healthy life expectancy ... 138
Chapter 1 Introduction
3
1.1 Population Aging
1.1.1 Global Population Aging
The elderly are currently regarded as the fastest growing age group worldwide.
Population aging becomes a global phenomenon. In the last several decades, the number of elderly people has been proportionally and consistently increasing. There were approximately 202 million people age ≥60 years globally in 1950 (Figure 1-1). Thirty years later, the number of elderly population aged ≥60 years had nearly doubled, and fifty years later people aged ≥60 years had tripled across the world, reaching 610 million, constituting 10% of the entire population.
When 10% of the population are aged ≥60 years or 7% are aged ≥65 years, society is regarded as an ―aging‖; when this increases to 20% for those aged ≥60 years, or 14%
for those aged ≥65 years, it is considered to be an ―aged society‖; and if individuals aged ≥60 years comprise more than 30% of the total population, or individuals aged ≥65 years comprise more than 21%, then a ―super aged society‖ is developing.
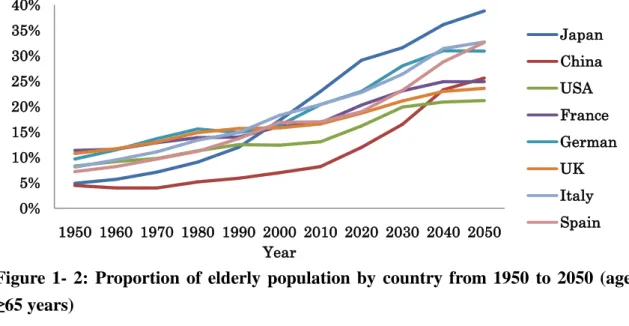
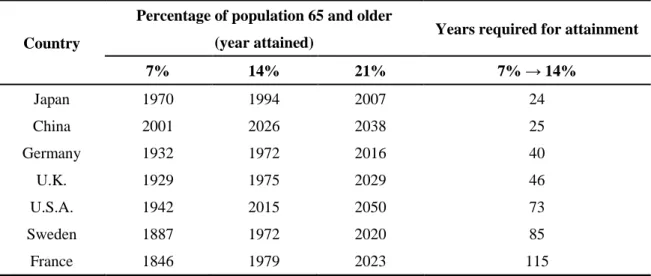
Generally speaking, the process of population aging is due to extended longevity and low fertility. Figure 1-2 displays the proportion of the elderly population aged ≥65 years in selected countries. Although the pace of aging is different, the rising tendency is clearly visible. Table 1-1 shows the years needed for selected countries to move the proportion of the elderly aged 65 years and above from 7% to 14%, in an ascending order. Most of today’s developed countries have had decades to adjust to the changing age structure, with the earlier that the population aging occurred, the longer the transition from 7% to 14%. For instance, the percentage of elderly people in Sweden and France reached 7% in the nineteenth century. It took these two countries 85 and 115 years to complete the transition from 7% to 14%, respectively; while population aging in Germany, the United Kingdom and the United States happened in the first half of the twentieth century, with 40 to 73 years were required to complete the process. Rapidly aging Japan is unusual among developed countries. The aged population in Japan accounted for only 7.1% of the entire population in 1970 but in 1994, a mere 24 years later, it had doubled in scale to 14.1%, which indicated an unparalleled pace compared with other countries; for China, the same transition is expected to happen in 25 years.
4
On one hand, this phenomenon reflects the advancement in medical technology and improvement in healthy behaviors; but on the other hand, it also brings many challenges to many aspects of the society, such as economy, policy and culture.
Figure 1- 1: Population aging in the world from 1950 to 2010
(Source: United Nations, Department of Economic and Social Affairs, Population Division, 2013) [1]
Figure 1- 2: Proportion of elderly population by country from 1950 to 2050 (age
≥65 years)
(Source: United Nations, Department of Economic and Social Affairs, Population Division, 2011) [2]
0%
2%
4%
6%
8%
10%
12%
0 10 20 30 40 50 60 70 80 90
1950 1955 1960 1965 1970 1975 1980 1985 1990 1995 2000 2005 2010
10,000persons
Year
>65 years (number) 60-64 years (number)
>60 years (%)
>65 years (%)
0%
5%
10%
15%
20%
25%
30%
35%
40%
1950 1960 1970 1980 1990 2000 2010 2020 2030 2040 2050 Year
Japan China USA France German UK Italy Spain
5
Table 1- 1. International comparison of the speed of aging in selected countries
Country
Percentage of population 65 and older
(year attained) Years required for attainment
7% 14% 21% 7% → 14%
Japan 1970 1994 2007 24
China 2001 2026 2038 25
Germany 1932 1972 2016 40
U.K. 1929 1975 2029 46
U.S.A. 1942 2015 2050 73
Sweden 1887 1972 2020 85
France 1846 1979 2023 115
(Source: Japanese Ministry of Health, Labor and Welfare, 2011) [3]
1.1.2 Population Aging in Japan
From the 18th century to the first half of the 19th century, the Japanese population remained steady at approximately 30 million. After the Meiji Restoration in 1868, it started expanding in order to build a modern nation-state. The number reached 60 million in 1926, and surpassed 100 million in 1967. During this period, the population increased at a rapid rate. In 1960, the rate of increase suddenly dropped to below 1%.
After that, the annual pace of population growth was around 1% from the 1960s to the 1970s. Since the 1980s, it has declined consistently. More recently, the population in Japan has showed negative growth from 2011. Table 1-2, the Japanese total population in 2012 was 127.52 million. This ranked Japan as tenth across the world at 1.8% of the global population. Among the Japanese population, about 30.73 million were aged ≥65 years (14.95 million men and 15.78 million women). People aged ≥65 years accounted for 24.1% of the total population, the highest in the world; that is, a quarter of Japanese are aged 65 and over. Figure 1-3 illustrates the aging trend of population age ≥65 years in Japan from 1900 to 2050. From the 1960s, the proportion of elderly people has been raising consistently and alarmingly. The proportion lines of elderly men and women started to separate since 1940, with more women than men due to women’s longer average life expectancy which has had accumulative effects. The differences in the number of men and women have been clearly observed.
6
Table 1- 2. Trends in Population of Japan from 1900 to 2050
Year
Population (N= million) Age composition (%)
Average annual rate of increase (%)
Total Males 0-14
years
15-64 years
≥65 years
1900 43.85 22.05 33.9 60.7 5.4 0.83
1910 49.18 24.65 36.0 58.8 5.2 1.16
1920 55.96 28.04 36.5 58.3 5.3 1.30
1930 64.45 32.39 36.6 58.7 4.8 1.42
1940 71.93 35.39 36.7 58.5 4.8 1.10
1950 84.12 41.24 35.4 59.6 4.9 1.58
1960 94.30 46.30 30.2 64.1 5.7 0.92
1970 104.67 51.37 24.0 68.9 7.1 1.08
1980 117.06 57.59 23.5 67.4 9.1 0.90
1990 123.61 60.70 18.2 69.7 12.1 0.42
2000 126.93 62.11 14.6 68.1 17.4 0.21
2010 128.06 62.18 13.2 63.8 23.0 0.05
2011 127.80 62.18 13.1 63.6 23.3 -0.22
2012 127.52 62.03 13.0 62.9 24.1 -0.20
2020 124.10 60.15 11.7 59.2 29.1 -0.34
2030 116.62 56.25 10.3 58.1 31.6 -0.62
2040 107.28 51.58 10.0 53.9 36.1 -0.83
2050 97.08 46.66 9.7 51.5 38.8 -0.99
(Source: National Institute of Population and Social Security Research, 2012. The numbers and percentages after 2012 were projected in 2012) [4]
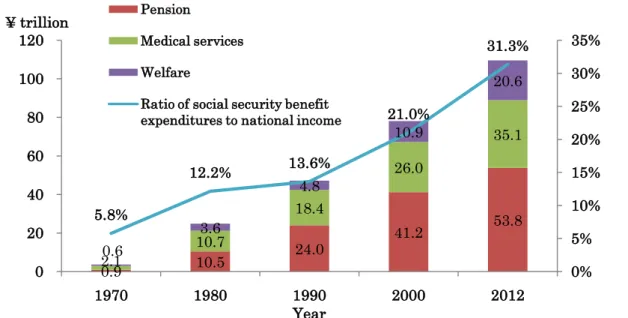
The biggest challenge caused by the rapid population aging in Japan is the soaring expenditure in social security benefits (Figure 1-4). It is clear that the social security benefits including pensions, medical services and welfare sharply increased during the past four decades from 3.5 trillion Japanese yen in 1970 to 109.5 trillion in 2012. In the 2012 fiscal year, pensions accounted for half of the total security benefit expenditure (53.8 / 109.5 = 49.1), while medical care accounted for 32.1 percent (35.1 / 109.5), and social welfare and others for 18.8 percent (20.6 / 109.5). The proportion of total benefits to national income has been growing rapidly and consistently: 5.8% in 1970, 12.2% in 1980, 13.6% in 1990, 21.0% in 2000 and 31.3% in 2012, respectively. In addition,
7
social security benefit expenditure is forecasted to continue to raise, and has been projected to reach 149 trillion Japanese yen in the 2025 fiscal year [6].
Figure 1- 3: Population age ≥65 years in Japan from 1900 to 2050
(Source: National Institute of Population and Social Security Research, 2012; The numbers and percentages after 2012 were projected in 2012) [4]
Figure 1- 4: Trends in social security benefits of Japan from 1970 to 2012
(Notes: Social security benefit expenditures = Pension + Medical services + Welfare.
Source: Ministry of Health, Labor and Welfare, 2012) [5]
0%
5%
10%
15%
20%
25%
0 50 100 150 200 250
100,000 persons
Year Male ≥ 65 years (number) Female ≥ 65 years (number) Male ≥ 65 years (%)
Female ≥ 65 years (%)
0.9 10.5 24.0 41.2 53.8
2.1
10.7
18.4
26.0
35.1
0.6
3.6
4.8
10.9
20.6
5.8%
12.2% 13.6%
21.0%
31.3%
0%
5%
10%
15%
20%
25%
30%
35%
0 20 40 60 80 100 120
1970 1980 1990 2000 2012
¥ trillion
Year Pension
Medical services Welfare
Ratio of social security benefit expenditures to national income
8
1.1.3 Population Aging in China
As displayed in Figure 1-5, in 1950 there were 54.4 million people in China, including 4.1 million people aged ≥60 years, accounting for 7.5% of the total population.
Thirty five years later in 1985, the number of elderly aged ≥60 years doubled and reached 8.8 million. In 2000, this number reached 12.8 million, suggesting a three-fold increase compared with 1950, comprising 10.0% of the total population. Thus, China has become an aging society.
According to the fifth national population census data in 2000 (Figure 1-6), there were 126.6 million people in main land China, including 65.2 million men (51.5%) and 61.4 million women (48.5%). In this population, the proportion of people aged 0 – 14, 15 – 59 and people ≥60 years was 22.9%, 66.6% and 10.5% respectively. In 2010, when the sixth national population census was undertaken [8], there were 134.0 million people in main land China, including 68.7 million men (51.27%) and 65.3 million women (48.73%). The proportion of people in these age groups changed to 16.6% (0 – 14 years), 70.14% (15 – 59 years) and 13.26% (≥60 years). In comparison with the fifth national census, the total population of main land China increased by approximately 7.3 million annually with an annual average growth rate of 0.57%; the proportion of those aged 0 – 14 decreased by 6.29%, while the proportion of those aged ≥60 years increased by 2.93%.
In the Aging Development Forum of China in 2013 launched by the Ministry of Human Resources and Social Security of the People’s Republic of China, the total number of elderly people aged ≥60 years had exceeded 200 million. In recent years, a daily average 25,000 elderly reached the age of 60 years in China. Population aging is therefore considered to be one of the most crucial demographic and social problems facing contemporary China.
9
Figure 1- 5: Population aging trend in China from 1950 to 2010
(Source: United Nations, Department of Economic and Social Affairs, Population Division, 2013) [1]
Figure 1- 6: Age structure of Chinese population in 2000
(Source: National Bureau of Statistics of the People’s Republic of China, 2000) [7]
0%
2%
4%
6%
8%
10%
12%
14%
0 20 40 60 80 100 120 140 160
1950 1955 1960 1965 1970 1975 1980 1985 1990 1995 2000 2005 2010
10,000 persons
Year
< 60 years (number)
≥ 60 years (number)
≥60 years (%)
≥65 years (%)
0%
10%
20%
30%
40%
50%
60%
70%
0 50 100 150 200 250 300 350 400 450
0-14 years 15-59 years ≥ 60 years
1,000,000 persons
Age men (number)
women (number)
% of the total population
10
1.2 Literature Review
Considering the fact that older people currently constitute the majority of those in poor health, the determinants of health in old age are a growing concern.
The International Classification of Functioning, Disability and Health, often referred to as ICF, is a classification of health and health-related domains by all 191 WHO Member States in the fifty-four World Health Assembly in 2001 [9]. ICF acknowledges that every human being would experience a decline in health, but the extent to which the health of an individual is impaired could be totally different. A list of environmental factors was also included in the ICF, as well as personal factors, since an individual’s health occurs within a context. Thus, changes in the social and ecological environments could alter health conditions (Figure 1-7).
Figure 1- 7: ICF model.
(Source: WHO, 2001) [9]
Both in western industrialized countries and developing countries, every improvement in human health of the history is not only ascribed to advances in medical technology, but also to the development in the economy and environment. However, in modern society, the contribution of advancement in medical knowledge and technology to population health is diminishing (accounts for only 10%). Population health was mainly determined by personal health behaviors (50%), social environment (20%) and
Health condition
Body function
&structures Activity Participation
Environmental
factors Personal
factors
11
heredity (20%) [10]. Therefore, social determinants which were basic and sustainable for national health gradually attracted more attention and were taken into consideration.
Similarly, from the perspective of multiple etiology, in addition to genetic and physical factors, health problems and diseases were also caused by a wide variety of social determinants that were at the root of these inequalities in health [11]. On the basis of causal distance to health, social determinants could be divided into three levels:
proximal factors, mid-range factors and distal factors. Proximal factors which could be easily changed by individuals are closest to health, including health-related lifestyles and behaviors; social relationships and social support are regarded as mid-range factors;
and distal factors cover social structure and stratification, over which people have the least control.
1.2.1 Distal Factor — Socioeconomic Status and Health
An increasing number of literature shows clearly that socioeconomic status (SES) and health are strongly related, in both industrialized and developing countries, in both welfare states and liberal democracies. The issue of whether SES affects health or vice versa has been controversial [12]. Two theories were extracted from these disputes:
―social causation‖ and ―health selection‖ [13]. The social causation theory claims that health is related to socially determined structural factors such as SES [14]. The health selection theory suggests that SES is affected by health, and that the healthy people move up the class hierarchy while the less healthy people move down [15]. Given that the research population is composed of elderly adults, this study uses the social causation theory; that is, SES impacts an individual’s health. A social gradient in health can be identified in both western countries [16-25], and eastern countries [26-30]:
people with high SES are more likely to have better health as assessed by self-rated health (SRH) [31-36], functional status [37-39], or mortality [40-47], and regardless of whether SES is measured by levels of income, years of education or occupational class.
In addition, SES has accumulative effects [48], which means that socioeconomic differences in health escalate with an increase in age [49]. However, several studies identified that SES differences in health expand through late middle-age and decline thereafter [50-52]. Declining health inequalities in later life have been attributed to
12
selective mortality, social sector services targeting older adults, and cohort effects [53].
However, some studies did not draw a consistent conclusion. Lampert suggested that small socioeconomic differences in functional aspects of health up to the age of 90 years, were followed by significant differences in those aged 90 years and over in a research population aged 70 years and over [54]. A Germany study has shown that socioeconomic differences were significant among those aged 70 – 79 and disappeared after 80 years of age [24]. Another Germany study revealed that only a slight age variation existed in the association between SES and health among individuals aged 60 and above [25]. In Japan, there is limited knowledge about how the effects of SES on mortality interact with age and gender. Liang and his colleagues pointed out that there is no significant educational difference of mortality among the 70 – 79 age group [44]. In contrast, a Mexican study analyzed by Smith and Goldman using a nationally representative sample of older adults, indicated no significant age variation in the effects of education and wealth on SRH and physical functioning [39].
Gender differences also emerged in the relationship between SES and health. In Japan a cross-sectional study was carried out among 9,650 participants aged between 47 and 77 to identify gender differences of the impacts of income on health [55]. Males with a low household income were more likely to report poor or fair health but not females. Another Japanese study, conducted by Liang et al. in 2002, found an opposite association to western countries with an educational crossover observed among elderly men [44]. This association may be due to gender and SES differences in the causes of death, morbidity, and health behavior. Fukuda and his colleagues found that the relationship between mortality and SES (including income and education) was stronger in men than in women [41]. In line with this gender difference, Smith and Goldman also claimed an SES-related difference in health was smaller in older women than men [39].
While Bassuk, Berkman and Amick recognized education, household income and occupational prestige were generally associated with lower mortality for men, this was true only for women regarding income among elderly residents in four US communities (East Boston, Massachusetts; New Haven, Connecticut; east-central Iowa; and the Piedmont region of North Carolina) [40]. Prus and Gee believed that the relationship between income and health is only significant in older women aged ≥65 years, based on
13
data from the 1994 to 1995 National Population Health Survey in Canada [56].
Compared with studies in western countries, the research on the relationship between SES and health is very limited in Asian countries, let alone among elderly people; furthermore, little is known about how the SES–health link differed by age and gender. Therefore, consistent results have not yet to be drawn.
1.2.2 The Mechanism of SES–Health by Healthy Lifestyle — Proximal Factor
Sufficient evidence has shown that health-related lifestyles could partly explain health differentials by SES [57,58]. People with high SES are characterized by greater consumption of high-quality and low-fat diets [59,60]. In contrast, disadvantage groups tend to involve cigarette smoking and excessive alcohol consumption [39,61], in order to cope with stress in their lives.
These associations also vary by age and gender. Øvrum, Gustavsen, and Rickertsen explored how the income and education gradients in physical activity, smoking, consumption of fruit and vegetables and SRH vary with age among Norwegians aged 25 to 79 [62]. The education gradient in smoking and in physical activity, as well as the income gradient in consumption of fruit and vegetables among elderly men, became smaller at older age; while only physical activity among elderly women grew stronger.
Smith and Goldman showed reverse income gradients in obesity, smoking and drinking in Mexico, which was contrary to patterns in the industrialized world [39]. A Canadian survey, by Denton and Walters, claimed that smoking and alcohol consumption were more important determinants of health (subjective health and functional health status) for men than women aged 20 and above, while body weight and being physically inactive were more important determinants of health for women than men aged 20 and above [63]. Prus and Gee found having an acceptable body weight was positively linked to health for elderly Canadian women [56]. In China, adults aged 18 to 70 with a high SES were more likely to engage in a healthy lifestyle, being able to afford this, which in turn promoted their SRH [64]. Kim and his colleagues conducted a comparative study between China and the United States to understand health discrepancy issues cross-nationally [65]. As SES (income and education) improved, lifestyle (diet, physical
14
activity, smoking, and alcohol consumption) became less healthy in China. Conversely in the United States, a higher SES was related to a healthier lifestyle. These findings are important in explaining corresponding age and gender patterns of inequality in health.
However, a longitudinal study in America of 3,617 non-institutionalized adults showed that cigarette smoking, alcohol consumption, physical activity, and Body Mass Index (BMI) explained only a modest portion of the socioeconomic differences in health [66].
That is, the higher prevalence of these four health-risk behaviors among lower SES groups was not the dominant mediating mechanism which could contribute to health inequalities by SES.
In fact, multiple liner regression analysis and logistic regression models, which are widely applied in prior studies, are not a good choice for mechanism studies, since these two kinds of analytical methods are not able to reflect indirect impacts, nor are they able to detect the co-variation between independent variables and dependent variables, as well respective analyses would also yield inconsistent results. Most of the mechanism research on SES–health paid attention to the general population, with only a limited number of studies focused on elderly people. Whether healthy lifestyle could explain socioeconomic differences in health among elderly individuals is still unclear.
1.2.3 Mid-range Factor — Social Interaction and Health
After reaching old age, individuals have much more leisure time as a result of retirement from activities they used to be responsible for, such as work, household duties and social activities. Social interactions with other people are a crucial part of daily life for elderly people.
Since the mid-1970s, there has been a rapid increase in epidemiological research on the effect of social interaction on health status and longevity. It is well-known that social interaction has a powerful impact on health in old age. Lack of social interaction predicts poor physical health [67-70], low subjective well-being [71,72] and mortality from all causes [73-77]. The reasons are that social interaction may be beneficial to promoting access to information about health and health-related behaviors, rendering emotional support to cope with stress, providing tangible help [78-81], and supplying more opportunities to go outside and do exercise [82].
15
Social interaction has a greater effect on the life of the elderly than on other age groups in the human population [80]. Unger and his fellow authors indicated that the beneficial effects of social interaction were stronger for male respondents in a sample of initially high-functioning men and women aged 70 to 70 years over a 7-year period from the MacArthur Study of Successful Aging [83]. Avlund et al. used data from 1,396 older non-disabled adults from the Danish Intervention Study on Preventive Home Visits to investigate whether social interaction was related to physical health (disability) and whether these associations vary by age and gender [84]. A large diversity in social interaction and high social participation was important in maintaining functional ability among men and women aged 75 years. Being embedded in a strong network of social relationships provides protection against functional impairment. Mendes de Leon et al.
also reported a similar but more specific result that being embedded in a social network of friends and relatives, not of children or a confidant, reduces the risk for functional decline, as well as enhancing recovery from activity of daily living (ADL) disability [85]. In addition, gender differences in the influence of social interaction on the subjective well-being of Japanese older adults were determined among 498 elderly over a three-year survey interval [71]. Interactions with children had benefits on satisfaction only among elderly women. Social interaction quantity and quality were inversely associated with mortality [86], and exerted independent effects on mortality [73,87]. A community sample consisting of 331 individuals 65 years and older in North Carolina, America was assessed by Blazer, who found that the frequency of social interaction significantly predicted thirty-month mortality [74].
A growing body of evidence relating to social interaction and a better state of health status and lower mortality has led to general acceptance of the thought that social interaction influences quality and quantity of health, but there is less consensus on whether social interaction has a mediating role on the associations between SES and health status, as well as mortality. As far as we know, no paper has investigated this explanatory role of social interaction comparing Japan and China.
16
1.3 Study Objectives and Significance
1.3.1 A Comprehensive View of Prior Study and Analyses
Findings from previous empirical research gave us a better understanding of the effect of SES on health status and mortality. Many social scientists and public health researchers also provided suggestions on how to promote health status and reduce the risk of premature death. Although results in available literature are not quite consistent, they have still laid the foundation for associations between SES and health.
Socioeconomic inequalities in health exist all over the world, but vary by country, age, and gender. Some studies place the emphasis on understanding the mechanisms linking SES to health, including health status and mortality. Critical limitations of prior studies and analyses should be addressed in attempts to elucidate the association of SES–health and the mechanisms which this association acts on.
Firstly, looking at the target research population, the issues of health disparity by SES have been long known in western countries, but less in Asian countries, especially in Asian developing countries. Given that older adults constitute the majority of people who have health problems, special focus should be given to elderly people.
Secondly, looking at the methodological issue, structural equation modeling (SEM) is a statistical method that combines factor analysis and regression analysis. It can be applied to study both direct and indirect effects, and display the co-variation between all independent variables and dependent variables. To this point, it is superior to commonly used logistic regression analysis in previous studies in this field.
Thirdly, the perspective of this mechanism study is that few studies have explored the mechanism of how SES affects health status and survival time in an integrated perspective. A large number of studies have investigated the explanatory impact of healthy lifestyle on the SES–health status and on SES–mortality, however whether it applies to the elderly is still unclear. In addition, whether social interaction can mediate socioeconomic differences in health among elderly people in Asian countries is also far from clear. Furthermore, little studies have taken distal, mid-range and proximal factors of health into account simultaneously.
Lastly, indicators will be used on the basis of inconsistent findings in existing
17
literature, partly due to multifarious indicators. Different indexes could set limitations on international comparisons.
1.3.2 Objectives of Study
This study aims to investigate the structural relationships between SES, social interaction, healthy lifestyle, health status and mortality among community-dwelling elderly in Japan and China, as well as whether these associations differ in subgroups, for example, country, age or gender. More specifically, there are three objectives:
(1) to examine the relation between SES and health of elderly Japanese and Chinese people;
(2) to inquire the mediating role of social interaction on the association between SES and health status among elderly people in both Japan and China;
(3) to investigate the SES–health mechanism through personal behaviors, such as social interaction and healthy lifestyle, and how this mechanism varies by age and gender among elderly Japanese community-dwellers.
1.3.3 Significance of Study
This study applies a perspective of multiple etiology in accordance with causal distance to health to analyze the relationship between distal, mid-range, proximal factors and the health of older citizens. There is a knowledge gap in the understanding of SES–health and its mechanism among elderly people in Asian countries. Furthermore, the comparisons between Japan and China can provide a deep insight into differences in developing and developed Asian countries. Thus, the study may bridge the gap by using population-based data.
In addition to academic significance, there is practical significance. From the microscopic view, examining predictors of health status and mortality is helpful to improve quality of life for elderly people and lighten burdens for their caregivers; from the macroscopic view, identifying the mediating effects of personal behaviors on health status and mortality is helpful to establish cost-economical policy to preventive care and promote health.
18
1.4 Study Design
In the light of multiple etiology, and prior studies, a hypothesized model is established to illustrate the structural relationships of SES, social interaction, healthy lifestyle and health status, as well as survival time in Figure 1-8. It depicts the underlying direct and indirect pathways from SES to health. There are four latent variables in the ovals (SES, social interaction, healthy lifestyle and health status) and one observed variables in the rectangle (survival days) in the model. Health status and survival days are employed in the study to indicate health outcomes, which were described as quality and quantity of life, respectively. Among the influence factors, SES is a distal factor which individuals have the least control over; social interaction and healthy lifestyle are behavioral factors which individuals could change relatively easier.
Single-headed arrows represent the direction of relationship between two variables. It is hypothesized that:
Hypothesis 1: SES has both positive and direct effects on health status.
Hypothesis 2: SES has both positive and direct effects on survival days.
Hypothesis 3: SES affects health status indirectly by means of social interaction.
Hypothesis 4: SES affects survival days indirectly by means of social interaction.
Hypothesis 5: SES affects health status indirectly by means of healthy lifestyle.
Hypothesis 6: SES affects survival days indirectly by means of healthy lifestyle.
Hypothesis 7: Survival days was positively associated with SES, social interaction, healthy lifestyle and health status.
Hypothesis 8: The structural relationships between SES, social interaction, healthy lifestyle, health status and survival days vary by age and gender.
19
Figure 1- 8: Hypothetical model of dissertation (Wang, 2011)
(Notes: Latent variable is included in the oval shape and observed variable is included in the rectangle shape. Single-headed arrow indicates the direction of relationship between two variables.)
SES
Healthy lifestyle Social interaction
Health status Distal factor
Mid-range factor
Proximal factor
Behavioral factors Health
Survival days
20
1.5 Data and Location
The data of the study were collected from Tibet Autonomous Region (TAR) of China in 2009, and Tama City of Japan in 2001, 2004 and 2007.
1.5.1 Profile of Tibet Autonomous Region
Tibet Autonomous Region was established in September 1, 1965. It is located in the southwest border of China (Figure 1-9). Tibet faces Sichuan province, Yunnan province, Qinghai province and Xinjiang province on the east and north. It is bounded on the west by India and Nepal, and on the south by Bhutan and Myanmar. Tibet is the highest plateau on earth, with an average elevation of 4,900 meters. Thus, it is often referred to as the ―Roof of the World‖. Tibet covers over 1,220,000 square kilometers, accounting for 12.8% of China, embracing over 2.84 million people in 2007. The natural growth of population was 11.3‰, with a birth rate of 16.4‰ and a mortality rate of 5.1‰. Tibet is home to the Tibetan, Han and Hui people, as well as other ethnic groups. [89]
Tibet Autonomous Region contains a prefecture-level city (Lhasa City), a country-level city (Shigatse City) and six prefectures (Shigatse, Chamdo, Shannan, Ngari, Nakchu and Nyingchi) (Figure 1-10). According to administrative divisions, there are only two cities in Tibet — Lhasa City and Shigatse City.
Lhasa, which literally means ―Land of the Gods‖, is the capital of the Tibet Autonomous Region of China. It has always been the political, economic, and cultural center over its 1,300-year history. Lhasa is one of the highest cities in the world with an altitude of 3,600 meters, and sits in a valley next to the Lhasa River. The valley location protects the city from intense cold or heat and heavy winds. Lhasa City administers one district (Chengguan District) and seven counties (Lhünzhub County, Damxung County, Nyêmo County, Qüxü County, Doilungdêqên County, Dagzê County and Maizhokunggar County) (Figure 1-11). Lhasa City had 223,001 people in the Chengguan District in 2000 (117,004 men and 105,997 women), and nearly half of Lhasa city’s population lives here [91]. There are 7 sub-districts and 28 communities in Chengguan District. The seven sub-districts are Gamagongsang, Jibenggang, Gongdelin,
21
Bakuo, Zhaxi, Jiri, and Chongsaikang.
Shigatse City, which means ―the fertile land‖, is the administrative center of Shigatse Prefecture as a county-level city, and the second largest city in the TAR of China (Figure 1-12). Shigatse City had a population of 99,863 (51,915 men and 47,948 women) in 2000 [91] and sits in southwest of Lhasa City about 250 kilometers. It is located in flat terrain surrounded by mountains at an elevation of 3,840 meters. Shigatse governs two sub-districts (Chengbei and Chengnan) and ten townships: Lian, Nianmu, Jiangdang, Bianxiong, Dongga, Nierixiong, Jiacuoxiong, Qubuxiong, Qumei, Na’er.
There are five communities in the Chengnan Sub-district and five communities in the Chengbei Sub-district.
Figure 1- 9: Location of Tibet (Retrieved from
http://img.shanghaifocus.com/image/tibet/Map-of-Tibet-Location-in-China.jpg) [88]
Figure 1- 10: Map of Tibet