NOVEL OPTICAL DEVICES BASED ON SILICONE OPTICAL TECHNOLOGY (SOT) AND THEIR APPLICATIONS FOR
CHEMICAL AND BIOLOGICAL ANALYSIS
チャクリヤ, マラスク
http://hdl.handle.net/2324/4110521
出版情報:九州大学, 2020, 博士(工学), 課程博士 バージョン:
権利関係:
NOVEL OPTICAL DEVICES BASED ON SILICONE OPTICAL TECHNOLOGY (SOT) AND THEIR APPLICATIONS
FOR CHEMICAL AND BIOLOGICAL ANALYSIS
CHACRIYA MALASUK
2020
Novel optical devices based on Silicone Optical Technology (SOT) and their applications
for chemical and biological analysis
By
Chacriya Malasuk
A thesis submitted to Kyushu University for the degree of Doctor of Engineering
Department of Electrical and Electronic Engineering
Graduate School of Information Science and Electrical Engineering Kyushu University
Fukuoka, Japan
September 2020
i
Abstract
Nowadays, small, portable, low cost and fast fabricated analytical devices have been interested because of their availability and flexibility for on-demand and on-site chemical and biological applications. The measurement instrumentation in analytical chemistry has also been developed to a new design which is emphasized on small detection system using photometric instruments and portable instrument due to the drawbacks of traditional optical system as expensive and unwieldy. Novel method for fabrication of optical system was proposed to be compact, tiny, lightweight, and easy prototype for use in chemical and biological analysis. In addition, potential optical properties of low noise detection and high sensitivity has been required to improve in optical devices for determination of chemical and biological compound in real samples.
In chapter 1, the introduction, including principle of analytical chemistry, a pleasing modern analytical technique termed flow injection analysis (FIA), three-dimensional (3D) printing technique for analytical chemistry, the background of novel fabrication technique for the optical device termed silicone optical technology (SOT), and chemical and biological applications in this study were explained. In addition, objectives of this work were also described in this chapter.
In chapter 2, materials, 3D printing process and optical detector in this work were described.
ii
In chapter 3, a quasi-spatial filter that was previously demonstrated based on silicone optical technology (SOT) was combined with a light source of light emitting diode (LED), 24-well microplate (6 × 4 wells), and color sensors (Red-Green-Blue-Infrared) called of the SOT compact microplate reader to use for the continuous cell monitoring. This chapter presents a compact microplate reader that can measure cell activity and cell environment in a 24-well microplate continuously using the detection of optical absorption. The proposed compact microplate reader provided benefits of upkeep and control of cell production and discrimination. The SOT-spatial filter which showed an excellent effect of noise reduction was embedded in similar size with the cell culture microwell plates that is convenience for use to monitor cell state. Light reflection or light scattering can be absorbed by the special optical filter and only straight light can be transmitted. The fabricated compact microplate reader allows real-time cell monitoring during cell cultivation and culture medium condition in the clean room by uniting with the SOT spatial filter. In addition, this proposed device was possible to investigate concentration continuously and pH of cell culture in real time. A cell activity was also detected using the proposed device. These results showed that the newly developed device is a warranting tool for monitoring of cell conducts for quality control of cell without altering the cell culture surroundings.
In chapter 4, The new compact and flexible optical module using fast digital fabrication was proposed based on a concept of silicone optical technology (SOT) using in analytical technique of flow-injection analysis (FIA). A mold free optical module with additive planting of quasi-spatial filter (QSF) for straightforward optical detection was demonstrated. In this work, 3D printed silicone rough-frame was embedding SOT-QSF
iii
simple injecting and coating method for trapping unwanted light signal. The simple coaxial structure of SOT-QSF using clear PDMS core and carbon black doped PDMS clad was fabricated by injecting and coating of carbon-dispersed-PDMS on an optical channel of the 3D printed optical module. The coating properties as optical trapping layer and optical trapping efficiency was performed. These embedding technique and method development that is a rapid on-demand-fabrication will be beneficial for the application in analytical chemistry with general FIA research.
In chapter 5, currently, trend of devices in analytical chemistry has become low cost, portable, and tiny due to the adjustability and accessibility for on-site measurement applications. In this work, a fully flexiblecompact optical device using digital fabrication of 3D printing was demonstrated based on the concept of SOT for flow injection analysis (FIA) system as SOT-FIA optical device. A simple core and cladding structure using optical core of clear polydimethylsiloxane (PDMS) and a cladding of carbon black doped PDMS performs as a simple and tiny optical filter that can trap the tilted incident light as noise signal.
A simple injection coating method was used to embed the structure of SOT optical filter. The coating properties and the optical properties of the proposed device were evaluated. The results show that the developed optical module successfully provided a 99.8% trapping efficiency of unexpected light and noise level was lower than 0.5% demonstrating the low noise level detection of the developed optical module. This proposed optical module was combined with FIA system and absorbance sensor of Ushio picoExplorer™ using for colorimetric determination of iron in natural water samples. An outstanding linearity, a broad chemical analysis range, and acceptable percentage recovery performance were observed.
iv
Moreover, the results of iron contents in real water samples using the proposed optical device were validated with the results from the traditional spectrophotometric method. This inexpensive, movable, simple, adjustable, and highly sensitive optical device was potentially useful for on-site chemical analysis measurements.
In chapter 6, a proposed SOT-FIA optical device was used for light absorption in a flow enzyme-linked immunosorbent assay (ELISA) method by enzymatic reaction of polyaniline using aniline, H2O2 and horseradish peroxidase (HRP) enzyme. A radical polymerization of aniline to polyaniline is rapidly formed via the enzymatic reaction. This rapid reaction rate provides a benefit for flow ELISA. In this work, the flow competitive ELISA for determination of 3-phenoxybenzoic acid (3PBA) was investigated by an anti-3- phenoxybenzoic acid monoclonal antibody (mAb). The competitive ELISA was performed on a Y-shaped channel acrylic plate. An acrylonitrile butadiene styrene (ABS) resin beads with 1 mm diameter were filled in the Y channel to enhance the surface area for the mAb immobilization. The SOT-FIA optical device fabricated by a 3D printing and injection coating method which was made of polydimethylsiloxane (PDMS) as optical core and PDMS containing carbon black as cladding of optical trapping layer can significantly decrease light scattering. The acrylic flow chip and the SOT-FIA optical device was connected by the flow tube and combined with a blue LED as a light source for the flow ELISA. The results of flow response showed that the absorbance changes were related to the enzymatic reaction and the flow competitive ELISA with the proposed optical device was achieved for quantitative analysis of 3PBA in the range of 3PBA concentration from 0.2 to 2 ppm. Also, the proposed
v
FIA competitive ELISA was applied in real sample of an artificial urine that showed no significant matrix effect of the artificial urine on the ELISA.
In chapter 7, based on concept of silicone optical technology (SOT) advantages in optical properties for low noise detection with compact package, use of common matrix of polydimethylsiloxane (PDMS), and easy integrated optical equipment, thus, in this work, a rapid design and digital fabrication of SOT optical modules was proposed for chemical analysis via flow injection analysis technique and a compact absorbance meter picoExplorer™. A rapid digital fabrication of 3D printing method was used to create the 3D printed mold or frame. A simple structure based on SOT concept which optical core used transparent PDMS mixed with rutile particle of titanium dioxide (TiO2) as W-PDMS and a cladding used carbon black dispersed PDMS (K-PDMS) was fabricated by casting the PDMS on the 3D printed mold/frame. This structure acts as a spatial filter which is small and simply fabricated showing the ability of trapping the tilted incident light. The TiO2 dispersed into PDMS provided a special benefit in optical properties for enhancing of the optical sensitivity due to increasing the amount of scattered light by the white pigment of TiO2. This optical module was designed to directly mount on a LED light source and the absorbance color sensors of red-green-blue (RGB) at 45 degrees to the flow channel to increase the detection length. The effects of the percentage of white pigment of TiO2 (%wt. of W-PDMS) and the effect of the detection length were investigated an improvement of optical sensitivity. The enhancement of 35 to 45 times of the sensitivity of detection was achieved compared to the calculation from the Beer-Lambert’s law theory. In addition, the optical property of reduction noise effect was observed with lower than 1% of different percentage of RGB signal between
vi
dark room and light room. The proposed optical module integrated with a FIA system with compact LED detection system was achieved to determine iron in drinkable tap water samples. An outstanding linearity, a broad dynamic range, low limit of detection, good percentage recovery, and high precision were observed to confirm the usefulness of the proposed optical system. The results from our proposed method also agreed well with the traditional spectrophotometric method. The design of the proposed optical device shows newly developed and evaluated.
In chapter 8, the conclusions of all chapters were summarized.
vii
Contents
Cover
Abstract ... i
Contents ... vii
List of Tables ... xiv
List of Figures ... xvi
Chapter 1 Introduction ... 1
1.1 Analytical chemistry ... 2
1.2 Flow injection analysis ... 5
1.2.1 The phenomenon of flow injection analysis system ... 6
1.2.2 Basic component of flow injection analysis system ...8
1.2.3 The flow injection analysis results...9
1.2.4 Detection system in flow injection analysis system: absorption spectroscopy...11
1.3 3D printing technique ... 14
1.3.1 Laboratory equipment ... 18
1.3.2 Analytical equipment ... 18
1.3.3 Chemical and biological fluidic devices... 20
viii
1.3.4 Teaching aids ... 23
1.4 Silicone Optical Technology (SOT) ... 24
1.5 Chemical application: Colorimetric determination of iron (II) ... 27
1.6 Biological applications ... 29
1.6.1 Continuous monitoring of the cell ... 29
1.6.2 Determination of 3-Phenoxybenzoic Acid with Anti-3-Phenoxybenzoic Acid Monoclonal Antibody ... 30
1.7 Objectives of this thesis and outline ... 31
References ... 33
Chapter 2 Methodology ... 48
2.1 Materials ... 49
2.1.1 Polydimethylsiloxane (PDMS) ... 49
2.1.2 Carbon black (CB) ... 49
2.1.3 Titanium dioxide (TiO2) ... 50
2.2 3D printing ... 50
2.3 Optical detector... 52
2.3.1 Compact microplate reader ... 52
2.3.2 Ushio picoexplorer™ model PAS-110 absorbance sensor ... 53
ix
References ... 54
Chapter 3 Continuous cell culture monitoring using a compact microplate reader with a silicone optical technology-based spatial filter ... 56
3.1 Introduction ... 57
3.2 Materials and Methods ... 58
3.2.1 Device design and optical properties evaluation ... 58
3.2.2 Measurement of the concentration of the solution ... 61
3.2.3 Measurement of the pH in the culture medium ... 61
3.2.4 Evaluation of cell activity ... 62
3.3 Results and Discussion ... 62
3.3.1 Light absorption characteristics of the SOT spatial filter ... 62
3.3.1.1 Trapping efficiency of the SOT spatial filter ... 62
3.3.1.2 Crosstalk testing and noise reduction effect ... 64
3.3.2 Measurement of solution concentration ... 65
3.3.3 Change in pH of the culture medium ... 67
3.3.4 Cell activity and ammonium concentration in the culture medium ... 69
3.4 Conclusions ... 71
References ... 72
x Chapter 4
3D printing optical devices based on silicone optical technology (SOT) and its
application on analytical chemistry ... 74
4.1 Introduction ... 75
4.2 Materials and Methods ... 77
4.3 Results and Discussion ... 79
4.3.1 Properties of coated black PDMS surface ... 79
4.3.2 Trapping efficiency of SOT-QSF optical module ... 81
4.4 Conclusions ... 84
References ... 84
Chapter 5 Compact and on-demand 3D-printed optical device based on silicone optical technology (SOT) for on-site measurement: Application to flow injection analysis .... 87
5.1 Introduction ... 88
5.2 Materials and Methods ... 91
5.2.1 Reagents and standards ... 91
5.2.2 SOT-FIA optical module design ... 91
5.2.3 Fabrication method for the SOT-FIA module ... 92
5.2.4 SOT-FIA module optical properties evaluation ... 95
xi
5.2.5 Application of the SOT-FIA optical system ... 95
5.3 Results and Discussion ... 97
5.3.1 Properties of surface coated using the injection-blowing method... 97
5.3.2 Evaluation of optical properties of SOT-FIA module ... 100
5.3.2.1 Optical trapping efficiency ... 100
5.3.2.2 Noise reduction effect with LED detection system ... 102
5.3.3 Application of the SOT-FIA optical system ... 104
5.3.3.1 Robustness and chemical endurance of SOT-FIA optical module ... 104
5.3.2.2 Colorimetric determination of Fe(II) in real sample ... 105
5.4 Conclusions ... 111
References ... 113
Chapter 6 Enzyme-linked immunosorbent assay based on light absorption of enzymatically generated polyaniline: flow injection analysis for 3-phenoxybenzoic acid with anti-3- phenoxybenzoic acid monoclonal antibody ... 117
6.1 Introduction ... 118
6.2 Materials and Methods ... 121
6.2.1 Fabrication of 3D printed SOT-FIA optical device ... 121
6.2.2 Characterization of enzymatic reaction of polyaniline ... 122
6.2.3 Competitive FIA-ELISA ... 123
xii
6.3 Results and Discussion ... 125
6.3.1 Enzymatic reaction of polyaniline ... 125
6.3.2 Flow competitive ELISA ... 128
6.4 Conclusions ... 131
References ... 132
Chapter 7 Flow-through optical device based on Silicone Optical Technology (SOT) for determination of iron in drinkable tap water ... 139
7.1 Introduction ... 140
7.2 Materials and Methods ... 142
7.2.1 Fabrication method of the SOT-FIA optical device ... 142
7.2.2 Optical properties evaluation of the SOT-FIA optical device ... 146
7.2.3 Application of the SOT-FIA optical system: colorimetric determination of iron(II) ... 146
7.3 Results and Discussion ... 148
7.3.1 Optical properties evaluation of SOT-FIA module ... 148
7.3.1.1 Effect of W-PDMS on the optical intensity enhancement ... 148
7.3.1.2 Effect of detection length on the sensitivity of detection ... 151
7.3.1.3 Reduction of noise effect of the proposed SOT-FIA optical device ... 153
7.3.2 SOT-FIA optical system for Fe(II) determination in real sample ... 155
xiii
7.3.2.1 Analytical characteristics of the developed method ... 156
7.3.2.2 Accuracy of the developed method ... 158
7.3.2.3 Precision of the developed method ... 159
7.3.2.4 Method validation ... 160
7.4 Conclusions ... 161
References ... 162
Chapter 8 Conclusions ... 165
Acknowledgement
xiv
List of tables
Table 3.1 Cross talk testing and reduction of noise signals results from the proposed compact device. The RGB-IR signal of the blank air sample was evaluated in light room versus dark room and switch on vs switch off the near LED. ... 65 Table 5.1 Noise effect results of the proposed optical module using compact LED
detection system. The blank air sample was measured light intensity of RGB sensor at light room and dark room. ... 103 Table 5.2 Comparison of analytical characteristics of flow methods for the determination
of iron in natural water ... 109 Table 5.3 Percentage recovery of iron from natural water samples ... 110 Table 5.4 Validated results of iron determination in natural water sample using the
proposed optical system compared to the traditional detection of
spectrophotometer. ... 111 Table 6.1 Matrix effect of the artificial urine observed by the proposed FIA-ELISA.... 131 Table 7.1 Transmittance test of the standard iron solution using the proposed optical
device for different percentages of W-PDMS ... 151 Table 7.2 Noise effect results obtained by the proposed optical device using with the
simple LED detection system. The RGB signal of blank air sample were
compared measuring in light room versus dark room. ... 154 Table 7.3 PTFE tube scattering effect by the proposed optical device using with the
simple LED detection system. The RGB signal of blank air sample were
compared measuring with a PTFE tube versus without a PTFE tube ... 154
xv
Table 7.4 Comparison of analytical parameters of previous spectrophotometric method, the proposed optical device using K-PDMS, and this proposed W-PDMS optical device. ... 157 Table 7.5 Percentage recovery of iron determination from drinkable tap water
samples ... 158 Table 7.6 Intra-day and inter-day variation of iron determination from drinkable tap water samples ... 159 Table 7.7 Validated results of the iron contents in drinkable tap water observed by the
proposed optical system and a traditional spectrophotometric method. ... 160
xvi
List of figures
Fig. 1.1 Effect of dispersion on the sample flow profile at various time of flowing
solution in FIA system a) at the time of injection ... 7
Fig. 1.2 Illustration of a simple flow injection analysis system showing its basic components ... 9
Fig. 1.3 Typical FIAgram for flow injection analysis showing the detector ... 10
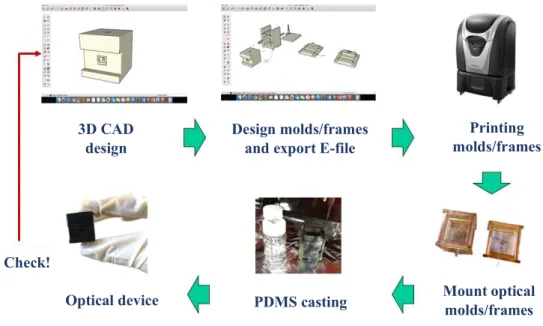
Fig. 1.4 Schematic of the 3D printing process from the first step (design the 3D CAD) to the printing by 3D printer ... 17
Fig. 1.5 Schematic illustration of 3D-printed flow-through cuvette fluorescence measurements ... 19
Fig. 1.6 Schematic of light propagation through the SOT quasi-spatial filter ... 25
Fig. 1.7 Trapping performance measurement of the SOT optical filter ... 26
Fig. 1.8 Molecular structures of 3PBA and several pyrethroid insecticides ... 31
Fig. 2.1 Illustration of 3D printing process of 3D printed silicone optical device ... 51
Fig. 2.2 Illustration of 3D printing process of 3D printed mold/frame of the optical device ... 52
Fig. 2.3 Images of fabricated compact microplate reader ... 53
Fig. 2.4 a) Appearance of Ushio picoexplorer™ model PAS-110 absorbance sensor ... 54
Fig. 2.4 b) Schematic of detector of the Ushio picoexplorer ... 54
Fig. 3.1 Illustration of the compact microplate reader ... 59
xvii
Fig. 3.2 a) Real image of the proposed device which the 24-well culture plate was directly set on the SOT spatial filter including the color sensors set below ... 60 Fig. 3.2 b) The image of side view of the proposed device showing that each LED light is
aligned on each well of the 24-well culture plate ... 60 Fig. 3.3 Trapping efficiency graph evaluated by the SOT spatial filter. The pass light
intensity was decreased in the function of incidence angle ... 63 Fig. 3.4 Bar graph of the Red-Green-Blue-Infrared signal when comparison of the free
air sample under condition of light room vs dark room and switch on vs switch off the near LED ... 64 Fig. 3.5 Optical signals for all wells in the 24-well plate investigated by the fabricated
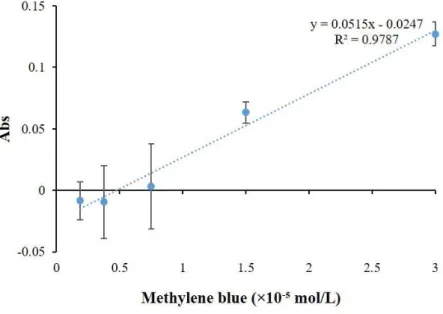
compact device ... 66 Fig 3.6 Calibration curve of methylene blue measuring by the compact microplate
reader ... 66 Fig. 3.7 a) Changes in the pH of the culture medium observed by a pH/mV meter over
time... 68 Fig. 3.7 b) Changes in the absorbance of the culture medium in microwells observed by
the developed compact device (λ = 530 nm). ... 68 Fig. 3.8 Cell activity of Osteoblastic cells using the fabricated device (n=5). The
measurement wavelength was 460 nm ... 69 Fig. 3.9 Calibration curve of ammonium concentration. The measurement wavelength
was 615 nm ... 70 Fig. 4.1 a) 3D CAD design (20 x 30 x 20 mm, OD = 2.0 mm) and image of 3D printed
silicone optical device ... 78
xviii
Fig 4.1 b) Cross section cut of SOT device after coating process ... 78 Fig. 4.2 The visible images and microscopic images (x250) of coated black PDMS
surface on 3D printed silicone optical device ... 80 Fig. 4.3 a) Microscopic images (40x) of coated black PDMS surface (cross section cut) 81 Fig 4.3 b) AFM microscopic image (250x, 20x20 µm) of coated black PDMS surface ... 81 Fig 4.4 Experimental setup of in-house instrument for trapping performance ... 82 Fig. 4.5 Experimental trapping efficiency which normalized intensity of the SOT-QSF
optical module for analytical chemistry application plotted versus the torsion angle ... 83 Fig. 5.1 a) 3D CAD design (10 mm×30 mm×20 mm, OD = 2.0 mm) ... 92 Fig 5.1 b) Real image of the silicone 3D printed optical module ... 92 Fig. 5.2 Illustration of the fabrication process of SOT-FIA optical module using
injection coating method for embedding the SOT-QSF ... 93 Fig. 5.3 Visible images and microscopic images (×250) of black PDMS-coated surface
on the proposed 3D printed optical device ... 98 Fig. 5.4 a) Microscopic images of black PDMS coated surface (40×) ... 100 Fig. 5.4 b) AFM microscopic image of black PDMS-coated surface (250× magnification,
50 × 50 μm2) ... 100 Fig. 5.5 Trapping efficiency graph of SOT-FIA module ... 102 Fig. 5.6 a) AFM images and 2D virtual surface images of the coated surfaces after
chemical resistance test under acid conditions ... 105
xix
Fig. 5.6 b) AFM images and 2D virtual surface images of the coated surfaces after
chemical resistance test under base conditions ... 105 Fig. 5.6 c) AFM images and 2D virtual surface images of the coated surfaces after
chemical resistance test under organic conditions ... 105 Fig. 5.7 Image of SOT-FIA system coupled with handheld LED detection system .... 106 Fig. 5.8 a) Examples of signal profiles of standard iron solution... 108 Fig 5.8 b) Calibration curve for iron colorimetric determination using the developed
optical system ... 108 Fig. 6.1 Illustration of competitive ELISA of enzymatic reaction of polyaniline with
3PBA antigen-antibody interaction ... 120 Fig. 6.2 a) An illustration of proposed optical module... 122 Fig. 6.2 b) Real image of the proposed optical device ... 122 Fig. 6.3 A schematic of an acrylic Y-shaped flow cell for flow competitive ELISA .. 123 Fig. 6.4 Absorption spectra of enzymatic reaction of polyaniline in the function of HRP
concentration ... 125 Fig. 6.5 a) Time dependent absorbance of enzymatic reaction of polyaniline under
condition of 10 mM aniline, 1 ppm HRP and 1 mM H2O2 in a phosphate buffer solution (pH = 6.6). ... 127 Fig. 6.5 b) Initial velocities against concentrations of HRP ... 127 Fig. 6.6 a) Flow response of the enzymatic reaction of polyaniline observed by FIA
competitive ELISA as illustrated in Fig. 6.3 ... 130
xx
Fig 6.6 b) The flow response of FIA-ELISA related to concentration of 3PBA antigen.130 Fig. 7.1 Illustration of fabrication process of proposed device by a simple casting
method ... 144 Fig. 7.2 a) SEM image (×50) of the surface of a W-PDMS film (500 µm thick). White
spots indicate TiO2 rutile particles ... 149 Fig 7.2 b) Illustration of the propagating light through the W-PDMS layer. ... 149 Fig 7.3 Light propagation through W-PDMS ... 149 Fig. 7.4 a) Transmittance plotted as a function of detection length observed by the
proposed optical device ... 153 Fig. 7.4 b) Relationship between realistic length from the experiment versus effective
length calculating via Beer-Lambert’s law equation ... 153 Fig. 7.5 a) Flow profiles of colorimetric determination of iron using the proposed optical
system... 155 Fig. 7.5 b) Calibration curve of standard iron concentration obtained by using the
proposed optical system ... 156
1
Chapter 1
Introduction
2 1.1 Analytical chemistry
Analytical chemistry studies and uses instruments and methods used to separate, identify, and quantify matter [1]. It is science involved with qualitative analysis which identifies desired compound or analytes in the sample, and quantitative analysis which determines the numerical amount or concentration of analytes in the sample by using instrumentation and robots specifically developed to prepare and analyze the sample.
Practically, the entire analysis in analytical chemistry composed of separation, identification or quantification. Analytical chemists need to use their understanding of chemistry, computer, instrumentation, and statistics to fix problems in almost every area of chemistry. Thing that analytical chemists do is to prepare appropriate sample by specific method, measure sample using proper instrument and interpret read out data in appropriate contexts and outcomes.
There are two difference method in analytical chemistry as classical method or wet chemical methods and modern method or instrumental method. The classical methods are extraction, and distillation precipitation for qualitative analysis of classical methods. The color, odor, radioactivity, reactivity, melting point or boiling point were observed, and the changes of volume or mass were observed in term of quantitative analysis of the classical method. The flow injection analysis, chromatography, electrophoresis or field flow fractionation were used to separate and quantify the amount of chemical compounds by the instrumental method.
Thus, the new instrumental method is very convenient to investigate the compounds in qualitative and quantitative analysis. In addition, the other instruments used the ability of electric fields, magnetic fields, heat interaction, and light interaction were commonly utilized for many application in analytical chemistry area. Analytical chemistry has applications
3
including in environmental analysis, materials analysis, bioanalysis, clinical analysis and forensic science [2].
The case of quantitative analysis in analytical chemistry, important analytical characteristics are required to report for considering of the utilization of the developed method for useful applications. These analytical parameters are the factors that guarantee the quality of the chemical analysis using the developed methods from analytical chemists. The significant parameters are described the meaning and the importance below;
1. Calibration curve, linearity of the method; a detector response (signal response) observed by many detection systems used for measuring the chemical compound or analyte; for example, an optical signal as absorbance, the electrical signal as voltage, i.e., is investigated in function of relative concentration of analyte. The relationship between the signal responses and concentrations of the analytes is then plotted as calibration curve. The linearity is presented in the regression equation. This equation is used for investigation of the analyte concentration in the sample, which is the result of quantitative analysis.
2. Linear range is a range of linear relationship between detector responses and the analyte concentrations. The linear range is sometimes called working range which is the range that is reliable for investigation the analyte concentration is the sample.
3. Dynamic range is the ratio between the largest and smallest values that a certain quantity or in the linear range can assume. It is often used in the circumstance of signals, for example sound, volt, light. It is measured either as a ratio or as a base-10 (decibel) or base-2 (doublings,
4
bits or stops) logarithmic value of the difference between the smallest and largest signal values [3].
4. Sensitivity is the smallest change of quantity or analyte concentration which the instrument or detector can detect by a measurement.
5. Selectivity is the selective chemical reaction of the analyte to the specific reagent. Other chemicals cannot be reacted to the reagent except the analyte.
6. Detection limit or limit of detection (LOD) is the lowest quantity/concentration of analyte that can be distinguished from a blank value with a stated confidence level [4]. The LOD is defined as the probability density function for normally distributed measurements at the blank of 3 times of standard deviation of the blank.
7. Quantitation limit is the lowest quantity/concentration of analyte that can be reliably measure by the detector. It is defined as 10 times of standard deviation of the blank.
8. Accuracy is a measurement of the closeness of the experimental value to the actual amount of the substance or analyte in the matrix [5]. Commonly, the spiked recovery is used to investigate the accuracy of the analytical method, which is defined as the percentage of the amount of observed analyte concentration recovered from the matrix compared to the nominal concentration of analyte.
9. Precision is measurement of how close individual measurements are to each other [5], which is defined as the deviation of the results from each replicates of the measurement.
5
Normally, the deviation can be calculated represented as %RSD, equals to the percentage of the standard deviation (SD) divided by mean or average value of the result.
10. Robustness is the tolerances of the analytical method to the chemical and physical interferences, for example heat, light, basic-acid condition i.e.
11. Sample throughput is the speed of the measurement of sample per hour (the amount of samples that can measure in an hour).
Analytical chemistry research is largely developed by investigation of the analytical performance including linear range, dynamic range, selectivity, sensitivity, detection limit, accuracy, precision, robustness, and speed or sample throughput. The cost which sums up of purchase, operation, training, time, and space is also one of the factors that was concerned in analytical chemistry application. Also, development in new determinations method for trace chemical compounds or difficultly observed compounds is one role of the analytical chemists.
1.2 Flow injection analysis
Flow injection analysis (FIA) is one of the analytical chemistry techniques. It is a highly efficiently automated method of chemical analysis referred the injection of sample into carrier stream or reagent stream in tubing closed system. The principle of the FIA method was injecting a plug of sample into a flowing carrier stream that mixes with reagents and then mixed solution of sample and reagent will transport to reach a detector for measurement and data analysis. FIA was developed in the mid-1970s by Ruzicka and Hansen in Denmark and Stewart and coworkers in United States as a new effective technique for the automated
6
analyses of samples and this technique allows for the rapid with an unlimited number of samples of sequential analysis. FIA is the modern technique in analytical chemistry with benefits of versatile, simple, and fast analysis for use in various application for quantitative analysis of chemical compounds [6]. In addition, it can be highly repeated, adapt to micro- miniaturization, limit chemicals in close system, reduce waste chemicals, and use small amount of reagent economically in the level of microliter. The main point of FIA is the formation of well-defined concentration gradient when an analyte or sample is injected into the reagent stream. Thus, this phenomenon offers a highly reproducible analyte to reagent ratios. Also, and the accurate time of flow operation is provided from excellent control over the reaction conditions [7].
1.2.1 The phenomenon of flow injection analysis system
The main phenomenon occurred in flow injection analysis system is laminar flow. As normal, the sample is injected into the carrier stream providing the rectangular flow profile of width (w) as shown in Fig. 1.1-part a. After the plug of sample moving through the mixing and reaction zone, the width of the sample plug is increased because of dispersion of the sample into the carrier stream. The dispersion is from two processes, one is convection due to the flow of the carrier stream and two is diffusion due to the concentration gradient between the sample and the carrier stream. Convection occurs by laminar flow. Because the difference of the linear velocity of the sample at the tube’s walls and at the center (a linear velocity of the sample at the tube wall is zero whereas the linear velocity of the sample at the center is twice time of carrier stream), it provides a parabolic flow profile occurred in FIA
7
system (Fig. 1.1-part b). Then, the different linear velocity at the center and the edge of tubing was occurred by radial diffusion. At the edge of tubing, the velocity was higher than at the center and diffusion can maintain the integrity of the flow profile of the sample (Fig. 1.1-part c). Both convection and diffusion make magnificent effect on dispersion from approximately 3–20 sec which is the normal time scale for a FIA after the sample’s injection. After approximately 25 secs, flow profile was affected by the diffusion which can observe as Figure 1.1-part d [8].
Fig. 1.1 Effect of dispersion on the sample flow profile at various time of flowing solution in FIA system a) at the time of injection, b) the convection overcomes the dispersion, c) the convection and the diffusion conduct to dispersion, and d) the diffusion overcomes the dispersion [8].
Direction of flow a)
b)
c)
d)
8
1.2.2 Basic component of flow injection analysis system
The basic components of a flow injection analysis system include reservoir for storing of reagent as the carrier stream, propelling unit uses for moving of carrier stream and maintaining a constant flow of the carrier. Normally, the peristatic pump or syringe pump was used as propelling unit in FIA system for transport the stream. The propelling unit possibly controls the flow rates from 0.0005–40 mL/min which is more than adequate to meet the needs of FIA (0.5–2.5 mL/min in common). The FIA system also has the tubing that comprises the transport system, the sample injector part as injection value for injecting the sample into carrier stream, the mixing coil using for mixing the sample with reagent stream and providing reaction zones before reaching the flow-cell of detector for measurement the signal of target compound reaction/assay. The electrochemical and optical detectors are the most common detectors used in FIA system. Fig. 1.2 presents the schematic of simplest design of flow injection analysis system consisting of a single channel and one reagent reservoir call single channel manifold. The reagent stream is set independent each other line stream. All line stream must be merged before the carrier stream gets to the detector. The complete transport system is called a manifold. Nowadays, the FIA system has been developed to dual and multi-channel FIA system for complicated chemical analysis. These complicated FIA systems can transport two or more reagent streams with the complex transported line for mixing the standard analyte or sample. The manifold can design for many applications in chemical and biological analysis. Thus, the design of manifold is very important in the research of analytical chemistry.
9
Fig. 1.2 Illustration of a simple flow injection analysis system showing its basic components.
The sample is injected into the carrier stream of the reagent and then mixed and reacted to provide the sample signal before reaching to the detector. The reacted solution was flow to waste and next injection can continue to measure next sample [8].
1.2.3 The flow injection analysis results
The response signal from detector when is plotted as function of the time provides the FIA curves or FIAgram. Example of typical FIAgram shows in Fig. 1.3 for conditions in which both convection and diffusion leads the dispersion of the sample. Also, several parameters for characterizing a FIAgram of the sample are described as following;
ta = Travel time, time between the sample injection and the arrival of its leading edge at the detector
T = Residence time, the time required to obtain the maximum signal of detector response t' = the time difference between travel time and residence time
∆t = time between the arrival of the leading edge to the departure of its tailing edge Reagent
Pump
Injector (valve)
Mixing coil
Waste Detector
10
T' = The elapsed time between the maximum signal and its return to the baseline is the return time
h = sample peak height related to the analyte concentration in sample
Fig. 1.3 Typical FIAgram for flow injection analysis showing the detector [8]
For development of FIA for variety of applications, the parameters of time need to optimize due to highly sensitive measuring of sequentially chemical analysis of FIA system.
The quantitative analysis of FIA system can be obtained from linear calibration curve plotted from the relationship between external standards (containing known concentrations of analyte) peak heights of detector responses and the known nominal concentrations. For example, the format of calibration curve can be plotted between absorbance versus concentration in case of optical detector, and potential versus concentration in case of electrochemical detector, which is depended on the method of detection. Then the sample
11
peak height is used for calculation of analyte concentration in the sample from linear regression of calibration curve. The precision and accuracy of the FIA method can be comparable with conventional method. Also, the selectivity is often better than the related traditional method of analysis, because the kinetic nature of the measurement process cause slow reaction of other potential interferents compared to reaction of analyte and the close system of FIA from storage of samples and reagents in closed reservoir and their transportation in tubing cause low contamination from external sources.
A calibration curve is investigated by injecting a series of known concentrations of analyte as external standards for quantitative analysis in flow injection method. The formats of calibration curve exemplify plots of the response of light absorption as absorbance versus concentration or electrochemical detection as potential versus concentration which it is depended on the method of detection. Over past three decades, FIA techniques evolved into a wide impressive display of applications as clinical, environmental, pharmaceutical, agricultural, and industrial applications using spectrophotometry, fluorescence spectroscopy, mass spectrometry, atomic absorption spectroscopy, and other methods of instrumental analysis for detection [9].
1.2.4 Detection system in flow injection analysis system; absorption spectroscopy
The goal of the analytical method is to apply the developed method for determination of the target analyte in the real samples that have different matrices. Thus, the selective detection system in FIA is required towards a given target analyte. The common detection system in flow injection analysis is absorptive molecular spectrophotometry in the UV/Vis
12
range because it is widely available and usually low cost than other kinds of instruments for detection. There are many optical equipment using in the FIA system. Traditionally, the spectrophotometers coupled with flow cuvettes was used. Then the fiber optics, light emitting diode (LED)-based optoelectronic detectors [10] were developed for miniaturizing the detection system using in FIA system. The sensitivity of the absorption spectroscopic detection in FIA system can be essentially enhanced by the light waveguide capillary cell [11]. For example, trace determination of iron in water [12] or wine [13] samples, and trace determination of Copper [14].
In the last 20 years ago, a miniaturization of instruments with photometric detection has been developed in design of analytical measuring instrumentation as portable instruments for on-site measurements. The light-emitting diodes (LED) was particularly used as use as light sources [15]. in the 1980s, the LED detector was used for absorptive measurements in first applications in detection systems [16]. It was used in capillary electrophoresis, chromatographic detectors, and microfluidics analysis. The other applications of the LED as luminescence and spectro-electrochemical measurements were applicable because of ability to use in deep-UV region to the mid-IR region [17]. LEDs has sufficient for use in photometric analytical because of the width of the emission bands, however the unavoidable nonlinearity of Lambert–Beer’s law can be observed depended on the matching of the absorbance band of the analytes and the LED emission spectra. The LEDs detector was successfully utilized in FIA system with linear response presented in recently applications For example, the blue LED at λ = 470 nm was used for iron determination using isothiocyanate [18], and LED-based detector at λ = 540 ± 10 nm was used for determination
13
of chromium with 1,5-diphenylcarbazide that were presented a good precision results with better LOD values compared to the common spectrophotometric method using a diode array [19].
The LED based flow cell was recently reported with use of light-dependent resistor for light absorption detection. It was used for determination of pesticide paraquat by using sodium dithionite as a reducing agent. The results in natural water samples showed no matrix interference of other herbicides [20]. For further complex detection system, the LED-based photometric detectors which a fused-LED sensor and an optical probe integrating two optoelectronic components were achieved [21,22]. The application of LED-based photometric detector was published asthe FIA system for enzymatic determination of urea [23]. A pH changes resulting from an enzymatic reaction with use of bromothymol blue dye was demonstrated with photometric detection of a two LED-based flow cell that incorporated with tubular PVC reactor with triacetate cellulose membrane/ immobilized urease that united both urease and Bromothymol Blue. Other application was applied for determinations of nitrate in water based on the chromotropic acid [24]. The 3D printed LEDs flow cell was used for absorbance measurements. The use of silicon photodiodes and LEDs as detectors was compared and the LED photocurrents were ten times lower, and generally, the faster setting times of photodiode provided better signals and precision [25].
Even though the selective detector for specific analyte is required for using in the real applications of flow injection analysis system, the development of new improved flow- through detectors and optimization of conditions for their applications, together with
14
permanent simplify of sample-processing steps is also needed when the detector response is not sufficient. Thus, the improvement of sensitivity of the detection is very important for chemical and biological applications since the ability for determination of some trace analyte compounds is requested.
1.3 3D printing technique
3D printing is an additive manufacturing (AM) process defined as the process of joining materials to make 3D objects via computer control of 3D model design. The process formed the object layer by layer which is deducts the step of fabrication of traditional machining [26,27]. Because the design and control of the 3D printing is digital process by 3D computer aids design (CAD) program as computer aids design and the printer program, the 3D printed material can be fabricated in many complex and sophisticated geometries without need of post-processing. The users can freely design their unique products and create for their specific desire of use. Firstly, a CAD file which is the sketch of the structure or device is prepared in 3D virtual model of the object for the printing process. Next, the process converted a 3D CAD through a digital standard tessellation language (STL) file into a physical product is required. The 3D CAD sketch file is broken down into a series of horizontal layers. The computer controls the printer to print one layer at time. The layers are stacked in the vertical (z axis) direction which each layer relates to the print resolution in the z direction. To achieve a coherent build of previous layer to another layer, supporting structures which bonding the layers to make the object without the fall of layers by gravity was built by the printing software. The supporting layers can be removed after the object is
15
completely printed. Then the last process is printing process or making product. The STL file is sent to the 3D printer. The printer need setting before the final part is fabricated. The fabricated process of 3D printing can be divided into seven unique methods as described below [28-31];
1. Material extrusion – the process that selectively dispense materials through a nozzle or orifice called fused deposition modelling (FDM), and robocasting/direct ink writing (DIW).
The material used in the process is thermoplastic polymers and composite materials, such as glass and carbon- reinforced composites.
2. Binder jetting - the process that selectively deposit a liquid bonding agent to join powder materials called 3D printing (3DP), and binder jetting (BJG). The material used in the process is metals composites, including alloys based on Al, Cu, Fe, Ni and Co, as well as silica, glass and graphite- based ceramics.
3. Material jetting - the process that selectively deposit droplets of build material called continuous inkjet printing (CIJ), drop-on-demand (DoD), multijet modelling (MJM), and polyjet modelling (PJM). The material used in the process is UV- curable photopolymers, typically acrylates, epoxides, or urethanes.
4. Directed energy deposition - the process that use focused thermal energy to fuse materials by melting as they are being deposited called laser engineered net shaping (LENS), directed light fabrication (DIF), and direct metal deposition (DMD). The material used in the process
16
is metal powders, including aluminium, stainless steel, nickel- based alloys, titanium, copper, and cobalt.
5. Powder bed fusion - the process that selectively fuses regions of a powder bed by thermal energy called direct metal laser sintering (DMLS), electron- beam melting (EBM), laser sintering (LS), and selective heat sintering (SHS). The material used in the process is metal alloys, polymers, such as nylon-12, polypropylene (PP) and PEEK, some experimental ceramics, and reinforced composites.
6. Sheet lamination - the process that bond sheets of material to form an object called laminated object manufacturing (LOM), and ultrasonic additive manufacturing (UAM). The material used in the process is sheets of paper, thermoplastics such as PVC and softer metals such as aluminium or copper.
7. Vat photopolymerization - the process that selectively cure liquid photopolymer in a vat by light- activated polymerization called two- photon polymerization (2PP), continuous liquid interface production (CLIP), digital light processing (DLP), and stereolithography (SL). The material used in the process is UV- curable photopolymers, typically acrylates, epoxides or urethanes.
Each process is unique in the method and material used in the printing process.
However, all processes are based on the sequential layer- by-layer deposition of print material.
Due to many processes of the 3D printing technique, various applications of chemical and biological analysis can be succeeded using 3D printing technique with simple and easy prototyping as a main advantage.
17
Fig. 1.4 Schematic of the 3D printing process from the first step (design the 3D CAD) to the printing by 3D printer [32]
The 3D printing technique has been used in Chemical, Material, and Biological application since 2012 and growing availability of affordable desktop printer can gain the attention of the use of the 3D printing since then. The 3D printing was popular due to its lots of advantages; explore the newly useful designs, embed the sensor technologies, rapid repeat process, easy to make simple device components. However, its drawbacks were the comparable with the solvents, the printing resolution, cost of some printing materials, and specific for some chemical application.
Versatile applications of 3D printing technique have been reported in analytical chemistry. Highlight future research directions and the challenges in chemistry need to be overcome. The research of 3D printing in applications of analytical chemistry were divided in important sorts of fabrication of common laboratory hardware, bespoke analytic instrumentation, custom micro-or milli-fluidic devices and teaching aids to illustrate complex scientific concepts.
18 1.3.1 Laboratory equipment
Use of 3D printing technique for fabrication of common equipment in laboratories can reduce the cost of research and teaching laboratories. Due to the demands of repairing, customizing, or developing bespoke laboratory equipment, the 3D printing is increased to use for convenient fabrication and saving cost compared to commercial alternatives.
Nowadays, it is very convenient to use the 3D printing laboratory hardware in chemical and biochemical applications because there are free downloaded sources of various 3D printing designs or printing resources for fabrication of general laboratory equipment [32]. The common laboratory equipment is designed to meet the objectives of the experiments. The 3D printed equipment was presented in many types, for a mixer and shaker [33], a syringe pump [34], a miniature peristatic pump [35], the microfluidic pumping [36], i.e. The common printing materials, including polypropylene (PP), polylactic acid (PLA), polyethylene terephthalate glycol (PETG), and acrylonitrile butadiene styrene (ABS) have been tested the solvent compatibility and permeability especially in alcohol solvent to prove the ability of use of 3D printed laboratory hardware.
1.3.2 Analytical equipment
Analytical instrumentations have special properties which are needed the complex design to meet the desire of usage in chemical applications. Use of 3D printing to prototype and manufacture bespoke devices can reduce the costs and associated production times. The first demonstration of 3D printed analytical device was the temperature- stable and pressure- stable high-performance liquid chromatography (HPLC) column using selective laser
19
melting from Ti-6Al-4V titanium alloy [37]. The channels of the HPLC column were internally functionalized post- print with a poly(butyl methacrylate- co- ethyleneglycoldimethacrylate) stationary phase for proteins separation of the complex mixtures. A 3D printed single- piece photometric detector body with a slit was printed by FDM process. It is used for quantitative photometric detection when integrated with a commercial light- emitting diode (LED) and a photodiode on either side of the capillary tube [38]. Other demonstrations of printed analytical hardware have included devices for UV–
visible (UV–vis) spectroscopy as 3D printed cuvette and open-source colorimeter [39,40], and LED array detection as 3D printed detector [41]. In flow injection analysis system, the 3D printed flow-through cuvette fluorescence measurements [42], One-step 3D printed flow cells using single transparent material [43], 3D-printed flow system for determination of lead in natural waters [44], and 3D printed radial flow-cell for chemiluminescence detection [45]
were also demonstrated for application in FIA system. Thus, 3D printing technique plays an important role in development of FIA system to become simple, easily fabricated, low cost, and on-demand devices used in various analytical chemistry application.
Fig. 1.5 Schematic illustration of 3D-printed flow-through cuvette fluorescence measurements [42]
Solution chamber
20 1.3.3 Chemical and biological fluidic devices
The use of 3D printed fluidic devices have been popularly demonstrated for preparation, synthesis and analysis of small volumes of chemical reagents that are the advantage of this kind of devices [46]. The traditionally manufactured processes of fluidic devices referred as microfluidics or millifluidics, lab- on-a- chip (LOC) or miniaturized total analysis systems (μTAS) are photolithography, soft lithography, injection molding, chemical etching, laser ablation, micromachining, thermoforming and hot embossing [47]. These processes are used a template or master to fabricate the fluidic devices. Commonly, polydimethylsiloxane (PDMS) is used as the molding material for fabrication of the template or master. Because of the advantages of low cost, transparency, biocompatibility, gas permeability, simple integration with flow components, the PDMS favored for fluidic applications. However, its drawbacks are chemical swelling in many organic solvents, deformation at relatively low pressures (>1×10⁵ Pa), and absorption of hydrophobic compounds. Furthermore, at final step of the fluidic device’s fabrication by PDMS master, the casting form the master pattern can be uncompleted final piece because some part of the final piece device was bonded chemically with the master [48]. Other disadvantages of these traditionally manufactured processes are the restriction of the design of fluidic devices, the complex mixing pathways, the analytical functionality, and accessible geometries mostly only can only fabricate to 2D planar channel networks, the high cost of clean room facilities, requirement of specialist equipment, time consuming and complex processing. Thereafter, the product costs heighten with increase in complex design, waste of costs when reproducing designs, and the post-production prolonged [49].
21
Recently, high- resolution and cost- effective 3D printing have approached to print the micro or milli fluidic devices. Although the resolution of the 3D printing is not equal to the photolithography of gold-standard approaches. However, the process overcomes the simple fabrication in one step [32]. In addition, the 3D printing technique can overcome the limitation of complex designs with rapid fabrication compared with other manufacturing approaches. 3D printing provided an easy accessibility of fabrication fluidic devices and is driving considerable innovation in many research areas.
The FDM techniques of 3D printing was used to produce chemical reactors in preparative chemistry as reactionware [49,50]. It facilitated advanced analytical approaches to monitor the reactions by electrochemical detection and UV- vis spectroscopy. The reactionware has been adopted to produce valuable pharmaceutical compounds such as ibuprofen [52,53]. The 3D printing applications in flow chemistry were achieved. The potentially 3D printed reactors were demonstrated to integrate with accessible analytical instrumentation for inline UV–vis and attenuated total reflectance infrared (ATR- IR) spectroscopy, and/or electrospray ionization mass spectrometry (ESI- MS) to rapidly produce experimental data [54–56]. Even though the 3D printed devices showed simplicity of fabrication, however the accuracy of determination of the printing process for example, chemical compatibilities, printing parameters and material properties need to achieve a working device.
The issues of design elements to the success of the 3D printed fluidic devices were reported [57, 58] and the results showed that the complexation of printing geometry can affect
22
the mixing of chemicals in the fluidic devices. The layer thickness, density and part orientation of the print parameters needed to be optimized for a desirable mixing effect due to the layer-by-layer nature of FDM-type printing. The different printing techniques were compared and assessed them for the fabrication of flow devices [59].
The increase in functionalities of the flow reactors was able to integrate by using 3D printing technology. The optical detector as fiber optics can be successfully embedded into 3D printed structures [60,61]. The complex design of the 3D printed fluidic devices with good alignment of the fibres, light source and detector are required for successful application.
Other designs were also proposed to make 3D printed microfluidic device embed with the flow cell of the diode array detector of an HPLC instrument to achieve online reaction monitoring [62].
In biological applications, 3D printing technologies shows the achievable goal to produce the devices that can integrate chemical reaction optimization and investigation of the biological responses to the compounds. The increase in biological applications of 3D printed devices has been raised due to the effective cost of the printed system with drug development and pharmaceutical screening. Complicated microfluidic devices for pharmaceutical testing was fabricated by 3D printing and the suitably complicated design based on biological response to various engineering alterations provided the simplicity to researchers for development in biological applications. The efficacy of 3D printing in bio- microfluidics has previously been discussed extensively [63]. However, the biocompatibility of 3D printed material for using in biological system is required to assess for the 3D printed
23
devices. Many 3D printed devices that feature biological functionality have been produced [64,65]. To duplicate a biological fluid such as blood system, the fluid perfusion devices was fabricated and used in many biological applications [66-68]. Although, a print resolution of the advances 3D printing technology can reach in level of 100 µm which in the scale of microfluidic devices. In addition, the speed of printing process and replicate production were the benefits of 3D printing over the conventional techniques [69].
1.3.4 Teaching aids
The most common applications of 3D printing are the production of teaching aids.
The 3D printed models of the laboratory items or the scientific models used in undergraduate teaching assist the students to illustrate more or less complex concepts. The increase in accessibility of printable educational material and affordability of printing technology provided potentially reduction of the teaching costs and stimulated the innovative teaching methods. The students can more understand about the concepts of complex scientific phenomena via the manufacture of 3D model kits, which visualize molecular structures, orbitals, and symmetry [70–72]. Also, the fabrication of 3D diagrams to represent spectroscopic data was reported in a more engaging format [73]. In flow chemistry, the 3D printed models illustrated principles of continuous flowsynthesis through simplistic mixing devices [74]. The teachers can use 3D printed instrumentation to describe innovation and potential of this technology to the students.
24 1.4 Silicone Optical Technology (SOT)
An optical system was traditionally configured optical components in a space to provide the robust optical light path for stable signal and be flexible for optical intensity tuning. The optical components and fundamental base need to be durable and black optical coverage generally render to the fundamental base to obtain the good ability of the optical system. These make the drawbacks of traditional optical system as heavy, hard, expensive and hard to carry. Thus, optical system which the light path was filled with transparent and solid-state medium called “filled path” optical system [75-77] was demonstrated to replace the blank space in transitional optical system. This replacement showed ability of reducing in fundamental base and increase in stability, but a tunability was decreased. A small cross section of an optical fiber proposes a significant concept of the filled path optical system [78]
with simultaneously longitudinal robustness and transverse flexibility. Then, waveguide technology such as Wavelength-Division Multiplexing or WDM has been studied [79] for using in network applications. However, in some applications of filled path optical system as in case of lab on a chip device [80], The simple optical system as an absorption cell was integrated in the flow-injection system consisting of glass, the problem of high background noise was occurred due to multiple internal scattering of glass substrate. Thus, some external optical component as optical filter is needed for sensitive measurement. Because of the problem mentioned above, in 2017, Nomada et. al. was demonstrated novel optical system using soft materials for spectroscopic analysis of laser-induced fluorescence (LIF) detection [81]. The soft matrix used for fabrication was polydimethylsiloxane (PDMS). Because PDMS has suitable optical properties as flexibility for tuning signal, high chemical stability,
25
low fluorescence, and transparency in the UV region, this research studied the use of PDMS for optical system design for special optical properties. A core of transparent PDMS and clad of black particle dispersed PDMS structure was proposed for reducing of internal stray light.
The refractive index matching of core/clad structure provides the suppression of intense background radiation due to multiple internal scatting in a transparent material. This presents the special optical properties as a quasi-spatial filter (QSF) and carbon micro particles and carbon nanotubes dispersed PDMS can attain to absorb the stray light 99-99.7 %.
Fig. 1.6 Schematic of light propagation through the SOT quasi-spatial filter
Comparison to the previous researches using metallic (Al, Ag, Au, Cu) layer have been be used as optical trapping layer or sub wavelength scatterers [81-83], The SOT -QSF provided benefits of inexpensive, flexible, and simple fabrication overwhelming the metal trapping layer. The Nomada’s proposed compact optical system was cigarette box size which composed of laser light source (532 nm), PDMS sample chamber (black PDMS of carbon particle doped PDMS), hole for critical reflection, transparent PDMS as light channel, dye
26
PDMS wavelength filter (Sudan-II), and photodetector. This is the first time of the optical system developed to be tiny size, light weight, no shall or frame, and portable by using fabrication of soft material.
Fig. 1.7 Trapping performance measurement of the SOT optical filter [84] described that the SOT filter can trap the stray light providing decrease in noise signal.
The boundary of black PDMS cladding and the transparent PDMS core seemed to effect to the trapping of scattering light which can provide the low blank signal level.
According to the results of trapping performance by observing the transmittance of the flexible PDMS core/black PDMS clad light channel as a function of the bending angle (Fig.
1.7), the sample of optical QSF as straight light guides (cross section of 1-2 mm2, length of 50 mm) were prepared to evaluate trapping performance. The black PDMS were prepared by using 10% wt. of carbon black (CB) doped PDMS and 0.83% wt. of carbon nanotubes (CNTs) to cover the transparent PDMS core. These results of trapping performance of the light guides show the function of straight filter that only light propagating along the axis of
27
core channel can pass to the photodetector. The scattering light can be absorbed via black particle diffused PDMS as optical trap layer. Thus, the noise signal can be suppressed to ̴ 0%
and 99-99.7% of trapping performance was observed. This presented the novel idea of fabrication of the optical system with low noise level detection that can provide the advantages in many areas of research.
1.5 Chemical application: Colorimetric determination of iron (II)
Iron is a metal that belongs to the first transition series and group 8 of the periodic table. It is present in many material and commonly, has oxidation states of iron(II) and iron(III). The iron (II) solution can react with 1,10-phenanthroline (C12H8N2, ortho- phenanthroline or o-Phen) is a tricyclic nitrogen heterocyclic compound to form colored complexes of a deeply red color. This property provides an excellent and sensitive method for determining these metal ions in aqueous solution called colorimetric analysis which the concentration of the analyte is based on the change in the intensity of the color of solution.
Colorimetric methods represent the simplest form of absorption analysis that normally use the spectrophotometric method for determination of the analyte. In case of iron (II) reacts with o-Phen, the colored solution is formed following below equation [85];
ortho-phenanthroline
3 + Fe2+
Ferrous tris-o-phenanthroline 2+
28
For the quantitative analysis of iron (II). The Fe(II)-o-Phen complex provided the red color solution which it absorbed the visible light as λmax at 510 nm. Based on the Beer- Lambert’s Law, is a very simple relationship: A = εcl while A is the absorbance of an analyte at a specified wavelength λ in nanometer range, normally used in electromagnetic region of the ultraviolet (UV) and visible (Vis); the molar absorptivity (ε) of the ferrous complex, [(C12H8N2)3Fe]2+, is 11,100 M-1 cm-1 at the λmax, c is the concentration in molarity as M, and l is the length of the light path through the sample, usually in cm. For Fe(II)-o-Phen complex, the intensity of the color is independent of pH in the range 2 to 9 and complex is very stable that the intensity of the complex color does not change for long analysis time. The applications of colorimetric determination of iron using o-Phen were widely used for determination of iron in vitamin tablet, milk, urine and i.e. Also, the determination of iron in water samples is usually carried out for routine quality control because the legislation limited the iron content in drinking water of lower 200 µg L-1 [86]. In case of iron analysis in the seawater, river, tap water or other source of natural water, the matrix effects and trace concentration levels of iron contents are the main issue for quantitative analysis. Thus, increase in sensitivity, preconcentration, and good separation are required in spectrophotometric method. The FIA system with increase in precision, accuracy and sample throughput was successfully used for determination of iron in natural water by o-Phen [87], however the method need the long-pathlength liquid core waveguide as the additional equipment to improve the sensitivity of the method. Thus, the determination of iron by o- Phen can be developed to improve the sensitivity by development of the detection system.
![Fig. 1.3 Typical FIAgram for flow injection analysis showing the detector [8]](https://thumb-ap.123doks.com/thumbv2/123deta/9786275.1869501/33.892.233.663.343.652/fig-typical-fiagram-flow-injection-analysis-showing-detector.webp)
![Fig. 1.4 Schematic of the 3D printing process from the first step (design the 3D CAD) to the printing by 3D printer [32]](https://thumb-ap.123doks.com/thumbv2/123deta/9786275.1869501/40.892.134.761.215.381/fig-schematic-printing-process-step-design-printing-printer.webp)

![Fig. 1.7 Trapping performance measurement of the SOT optical filter [84] described that the SOT filter can trap the stray light providing decrease in noise signal](https://thumb-ap.123doks.com/thumbv2/123deta/9786275.1869501/49.892.231.645.350.598/trapping-performance-measurement-optical-filter-described-providing-decrease.webp)

![Fig. 2.4 a) Appearance of Ushio picoexplorer™ model PAS-110 absorbance sensor b) Schematic of detector of the Ushio picoexplorer [9]](https://thumb-ap.123doks.com/thumbv2/123deta/9786275.1869501/77.892.147.758.295.478/appearance-ushio-picoexplorer-absorbance-sensor-schematic-detector-picoexplorer.webp)