PAPER
Phase-Based Periocular Recognition with Texture Enhancement
Luis Rafael MARVAL-PÉREZ†,Nonmember, Koichi ITO†a),andTakafumi AOKI†,Members
SUMMARY Access control and surveillance applications like walking- through security gates and immigration control points have a great demand for convenient and accurate biometric recognition in unconstrained scenar- ios with low user cooperation. The periocular region, which is a relatively new biometric trait, has been attracting much attention for recognition of an individual in such scenarios. This paper proposes a periocular recognition method that combines Phase-Based Correspondence Matching (PB-CM) with a texture enhancement technique. PB-CM has demonstrated high recognition performance in other biometric traits, e.g., face, palmprint and finger-knuckle-print. However, a major limitation for periocular region is that the performance of PB-CM degrades when the periocular skin has poor texture. We address this problem by applying texture enhancement and found out that variance normalization of texture significantly improves the performance of periocular recognition using PB-CM. Experimental evalua- tion using three public databases demonstrates the advantage of the proposed method compared with conventional methods.
key words: periocular recognition, phase-only correlation, phase-based image matching, phase features, texture enhancement, biometrics
1. Introduction
Reliable authentication of individuals in unconstrained sce- narios is increasingly required for applications, such as immi- gration control, entrance-exit management, surveillance, law enforcement, forensics, etc. [1]. Capturing high-resolution images in less-constrained environments with relaxed coop- eration is crucial for user experience in terms of convenience and acceptability[2], and it is relatively easy using the state- of-the-art imaging technology. However, accurate person authentication requires careful consideration in the choice of an adequate biometric trait. In general, iris and face have been used in unconstrained scenarios. Face recognition per- formance has greatly improved in the last decades[3], and iris recognition has arguably the highest performance in con- trolled settings[4]. On the other hand, the applicability of face recognition is limited, since face recognition methods have to deal with factors such as facial expressions, lighting variations, and occlusions in order to achieve accurate au- thentication. Iris recognition methods also have to deal with different factors, especially, partial occlusions due to specu- lar reflections and eyelashes, non-frontal gaze, motion blur, and defocus blur. Such impairments degrade recognition performance or sometimes prevent recognition at all.
Over the last years, the periocular region— the ex- Manuscript received November 16, 2018.
Manuscript revised March 29, 2019.
†The authors are with the Graduate School of Information Sci- ences, Tohoku University, Sendai-shi, 980-8579 Japan.
a) E-mail: [email protected] DOI: 10.1587/transfun.E102.A.1351
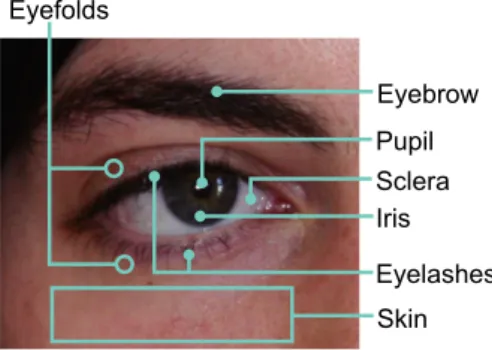
Fig. 1 Discriminative features included in the periocular region, where the image sample is from the UBIPr database.
tended region around the eye — has received considerable attention[5]–[7]. Periocular region includes many discrim- inative components, such as iris, sclera, skin, eyefolds, eye- lashes and eyebrows [6]. These components are indicated in Fig. 1 for an image sample from the UBIPr database[8].
They allow highly accurate recognition comparable with iris recognition in non-controlled scenarios [9]–[11]. In addi- tion, existing sensing setups for face recognition and iris recognition can be used also for periocular recognition.
In order to achieve efficient performance in periocular recognition, highly accurate image matching techniques are indispensable, since images captured from periocular region usually exhibit nonlinear deformation due to variations in head pose and facial expression as well as partial occlusion by eyeglasses, hairs, etc. This paper proposes a periocular recognition algorithm using Phase-Based Correspondence Matching (PB-CM) [12], which has demonstrated efficient performance in face, palmprint and finger knuckle recog- nition [13]. PB-CM employs local block matching using phase features obtained from 2D Discrete Fourier Trans- form (DFT) of image blocks. It combines phase features with image resolution pyramids to deal with deformation caused by variations in head pose and facial expression. The final matching score is calculated by summarizing results of local block matching in PB-CM, resulting in having the ro- bustness against partial occlusion. The above characteristics of PB-CM are useful also in periocular recognition because of its robustness against partial occlusion and non-linear im- age deformation.
A major problem of PB-CM is that its performance is significantly degraded when it is applied to regions with poor texture such as the skin under the eye. Addressing this problem, we combine phase-based correspondence match- Copyright © 2019 The Institute of Electronics, Information and Communication Engineers
ing with a texture enhancement technique to make a highly robust recognition algorithm for periocular images. Experi- mental evaluation using three public databases demonstrates the efficient performance of the proposed algorithm in peri- ocular recognition compared with conventional algorithms.
Contributions of this paper are summarized as fol- lows: (i) a new periocular image recognition algorithm using phase-based correspondence matching, (ii) a technique for improving its recognition performance through variance nor- malization, and (iii) systematic experimental evaluation of the algorithms using three public databases.
2. Related Work
Let us start by reviewing a simplified flow diagram in Fig. 2 of a biometric system that performs periocular recognition.
The recognition process comprises sensing, periocular re- gion extraction, feature extraction and matching. During sensing, the system captures a raw image which includes the periocular region in the visible or near-infrared spec- trum. Once the image is captured, the system normalizes the periocular region using eye detection[9],[14]–[16]or eye corners detection[8]. Normalization involves scaling, rotation and cropping of the captured image. From the nor- malized periocular image, the system extracts discriminative feature vectors. Then, the similarity between a probe im- age and a registered image is evaluated by comparing these features.
Previous works on periocular recognition applied tradi- tional features used in biometric recognition, especially, in face recognition. Examples of works employ Histograms of Oriented Gradients (HOGs) [17]–[19], Local Binary Patterns (LBPs)[8],[17],[19]–[22], Principal Component Analysis (PCA)[22]and Scale-Invariant Feature Transform (SIFT)[8],[17],[18], etc. The recognition methods using these features are relatively robust against imperfect align- ment and changes in facial expression. However, their per- formance is limited since they do not fully exploit the texture information within the periocular region.
Among recent periocular recognition methods, we find those based on Convolutional Neural Networks (CNNs) [23]–[25]and those based on a correlation filter known as Fusion Optimal-Trade-off Synthetic Discriminant Function (FOTSDF)[18],[26]–[28]. For comparison purpose, we put our attention on two of these methods: Semantic-Assisted CNN (SCNN) [23]and Periocular Probabilistic Deforma- tion Model (PPDM)[27]. One major disadvantage of these state-of-the-art methods is that they require training data.
CNN-based approaches require large training datasets for optimization which are not usually available, and FOTSDF- based approaches rely on image samples of target users for training and parameter selection.
In this paper, we propose Phase-Based Correspondence Matching (PB-CM) with texture enhancement for periocu- lar recognition. PB-CM handles various nonlinear trans- formation by comparing local blocks at their corresponding location in a similar way to SIFT feature matching. Com-
Fig. 2 Flow diagram of a periocular recognition system.
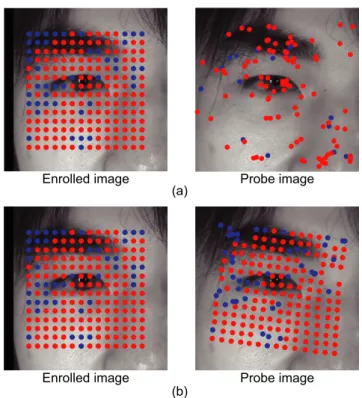
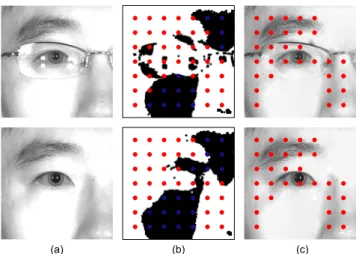
Fig. 3 Correspondence matching examples for two periocular images of the same person (genuine pair) using m-SIFT features matching (a) and using PB-CM (b). Red dots indicate corresponding locations successfully estimated, and blue dots indicate failed estimations.
paring with SIFT feature matching (Fig. 3(a)), PB-CM uti- lizes precise corresponding locations for accurate similar- ity evaluation (Fig. 3(b)). PB-CM employs phase features which have shown to be effective for representing various biometric texture, such as fingerprint, iris, face, palmprint and finger-knuckle-print[29]. However, the skin below the eyes has usually a weak texture and does not yield the same recognition performance as other parts of the periocular re- gion. We found out that we can enhance the skin texture with variance normalization and improve the discriminative capacity of the phase features in periocular recognition. In this manner, the novel combination of PB-CM with texture enhancement makes an intensive use of the available perioc- ular texture. This allows our method to compete favorably against advanced periocular recognition approaches such as FOTSDF-based[27]and CNN-based[23]methods.
3. Fundamentals for Phase-Based Periocular Recogni- tion
Let us formalize the image matching problem. The problem is to accurately measure the similarity between two peri- ocular images, a given enrolled image I (registered in the gallery) and a probe imageJ. In a real situation, the peri- ocular regions in these images are not perfectly normalized, and may contain occlusions and global deformation, which must be addressed in the image matching task. The block- wise image matching, which compares multiple local image blocks extracted from the given pair of images, could handle these problems, since occlusions and deformation are less pronounced at the scale of small blocks. For these compar- isons to be accurate, it is necessary for the local blocks to be aligned, i.e., to be at their corresponding locations between the two images, like the locations indicated by red dots in Fig. 3(b). We use Phase-Only Correlation (POC) to find the corresponding locations and to measure the collective similarity between the groups of blocks.
We first present fundamentals of POC for robust image matching. Second, we introduce a texture enhancement tech- nique, which significantly improves matching performance for periocular images. Third, we present a technique for phase-base correspondence search and possible similarity measures for periocular recognition. We leave the overall design of the periocular recognition algorithm to the next section.
3.1 Phase-Based Image Matching
Let us consider two N1 ×N2 local blocks, f(n1,n2) and g(n1,n2), extracted from the imageI with the center coor- dinate p and from the image J with the center coordinate q, respectively. The ranges of image coordinates are given byn1=−N−
1,· · ·,N+
1 andn2=−N−
2,· · ·,N+
2, whereN−
1 = d(N1−1)/2e,N+
1 = b(N1−1)/2c,N−
2 =d(N2−1)/2eand N+
2 = b(N2−1)/2c. In order to extract the local phase features, we calculate the 2D DFTs of the blocks with the following equations:
F(k1,k2) = X
n1,n2
(f(n1,n2)−fDC)
w(n1,n2)
×WNk1n1
1 WNk2n2
2
= AF(k1,k2)ejθF(k1,k2), (1) G(k1,k2) = X
n1,n2
(g(n1,n2)−gDC)
w(n1,n2)
×WNk1n1
1
WNk2n2
2
= AG(k1,k2)ejθG(k1,k2), (2) whereP
n1,n2denotesPN1+
n1=−N− 1
PN2+
n2=−N− 2
, the twiddle factors are given byWN1 =e−j
2π
N1 andWN2 =e−j
2π
N2, and the ranges of the transformed blocks are k1 = −N−
1,· · ·,N+
1, k2 =
−N−
2,· · ·,N+
2. AF(k1,k2)andAG(k1,k2)are the amplitude
components of the two image blocks, and θF(k1,k2) and θG(k1,k2)are the phase components.
We modify the original POC-based matching[31],[32]
as follows. In order to address the wrap around effect of the 2D DFT, we apply a window function w(n1,n2), i.e., Hanning window, to Eqs. (1) and (2) in our case. As observed above, we subtract the DC components of f(n1,n2) and g(n1,n2), which are denoted by fDC andgDC, since they do not contribute to the texture description.
We define the local phase features at the coordinates p andqas
X(k1,k2) = F(k1,k2)
|F(k1,k2)|, (3)
Y(k1,k2) = G(k1,k2)
|G(k1,k2)|. (4)
The normalized cross-power spectrumR(k1,k2)is computed from the phase featuresX(k1,k2)andY(k1,k2)as
R(k1,k2) = X(k1,k2)Y(k1,k2)
= ej{θG(k1,k2)−θF(k1,k2)}, (5) where X(k1,k2) is the complex conjugate of X(k1,k2). Then, the POC functionrPOC(n1,n2) is defined as the 2D Inverse DFT (2D IDFT) ofR(k1,k2):
rPOC(n1,n2) = 1 N1N2
X
k1,k2
R(k1,k2)
×WN−k1n1
1 WN−k2n2
2 , (6)
whereP
k1,k2denotesPN1+
k1=−N− 1
PN2+
k2=−N− 2
.
The POC functionrPOC(n1,n2) exhibits a sharp peak when the two image blocks are similar. The location of this correlation peak indicates the translational displacements δ=(δ1, δ2)between the two image blocks, while the peak height α serves as a measure of their similarity [30]. In this way, we can compare two image blocks by comput- ing their POC function. However, the correlation peak of the POC function can be very noisy due to the low signal- to-noise ratio in the high-frequency domain. In computer vision applications, this problem has been addressed with a spectral weighting function to decrease the influence of high frequency components [31], while in biometrics a simpler strategy to omit the high frequency components is adopted.
This approach is called Band-Limited POC (BLPOC)[32], since it limits the frequency band to a smaller sizeK1×K2 (K1 < N1,K2 < N2) in the 2D IDFT computation of Eq. (6). More precisely, the frequency range is restricted as k1 =−K−
1,· · ·,K+
1 andk2=−K−
2,· · ·,K+
2, whereK−
1 = d(K1−1)/2e,K+
1 =b(K1−1)/2c,K−
2 =d(K2−1)/2eand K+
2 =b(K2−1)/2c. Then, the BLPOC functionr(n1,n2)is defined by rewriting Eq. (6) as
r(n1,n2) = 1 N1N2
X
k1,k2 0
R(k1,k2)WN−k1n1
1 WN−k2n2
2
, (7)
whereP0
k1,k2 denotesPK1+
k1=−K1−
PK2+
k2=−K2−. The peak location of the BLPOC function
δBL
1 , δBL
2
indicates the translational displacementδ = (δ1, δ2) between the image blocks such that δ1 = δBL
1 N1/K1 and δ2 = δBL
2 N2/K2. The BLPOC function is particularly effective for matching a variety of biological textures and is useful for biometric authentication [29].
We refer to the phase featuresX(k1,k2)andY(k1,k2) as band-limited functions. That is to say, they are defined fork1 =−K−
1,· · ·,K+
1 andk2 = −K−
2,· · ·,K+
2. Note that r(n1,n2) is also band-limited, and hence it is defined for n1=−K−
1,· · ·,K+
1 andn2=−K−
2,· · ·,K+
2. 3.2 Texture Enhancement
Phase-based image matching has shown to be effective for recognizing popular biometric traits such as fingerprint[32], iris[33], palmprint[12],[34], and finger knuckle[35],[36], which contain homogeneous texture components. When we apply phase-based image matching to periocular recognition, however, we have to deal with heterogeneous texture com- ponents contained in periocular images. For example, while the appearance of eyebrows have very distinctive textures, the skin around the eyes might have poor texture, which de- teriorates the recognition performance. It is necessary to enhance the periocular images so as to make the poor texture more visible and make the whole image more homogeneous.
Therefore, we employ variance normalization of texture, also known as contrast normalization[37], which adjusts the lo- cal variance of pixel intensity across the whole image to the same level. The phase-only image, which, for example, is obtained from IDFT ofXin Eq. (3), corresponds to the image having an equalized variance of pixels. This fact indicates that phase features in the frequency domain corresponds to the image in the spatial domain after variance normalization.
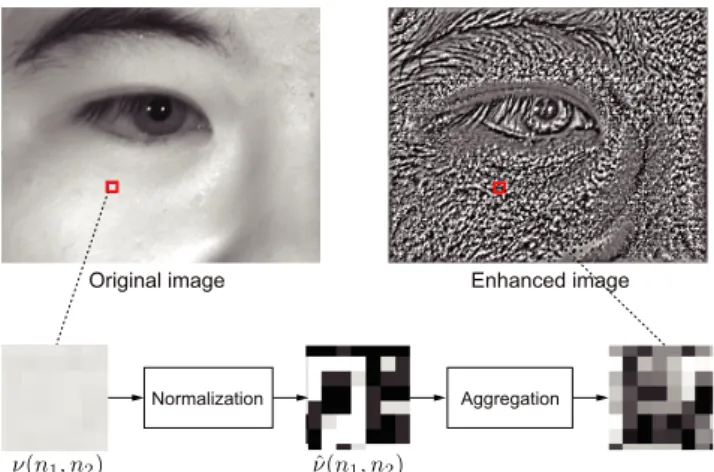
Therefore, the important information of phase features can be enhanced by applying variance normalization in the spa- tial domain. Variance normalization consists of three steps as illustrated in Fig. 4.
(i) Extract local patches: Extract a small (e.g. 7×7 pixels) local patch from the original image for every pixel.
(ii) Normalize patches: For all the patches, eliminate their DC components and normalize their variance. A given patch ν(n1,n2)is normalized as follows:
ν(nˆ 1,n2)= ν(n1,n2)−νDC max*
. ,
η,r P
{n0 1,n0
2} ∈C
{ν(n0
1,n0
2)−νDC}2+ / - ,
(8) whereCis a set of patch coordinates,ηis a small constant to cancel noise andνDC is the DC component which is given by
νDC= X
{n1,n2} ∈C
ν(n1,n2)
|C| . (9)
Fig. 4 Texture enhancement with variance normalization, which consists of three steps: (i) extract one patch per pixel, (ii) normalize the variance of each patch and (iii) combine them into a new image.
(iii) Aggregate normalized patches: Construct a new image by aggregating the patches using their original pixel coordi- nates. The intensity of each pixel in the new image is given by adding overlapping neighbor patches.
The general formulation of the steps (i) and (ii) is called Divisive Normalization Transform (DNT), and it is effective to reduce the statistical dependencies[38]. DNT has been applied to image processing tasks such as image compression [39]and contrast enhancement[40]among others.
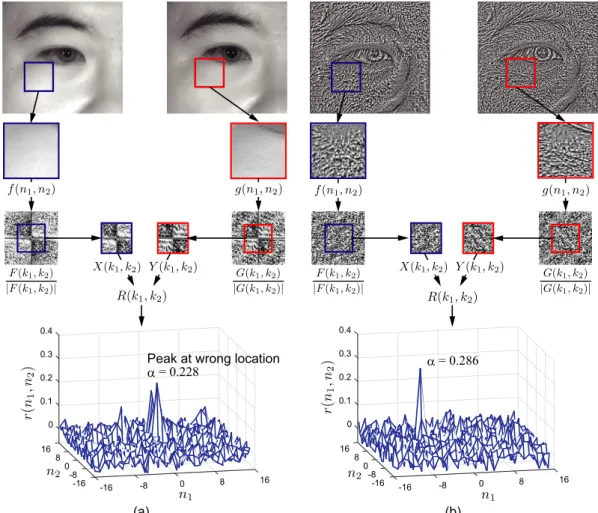
In order to illustrate the effect of texture enhancement on the BLPOC function, Fig. 5 depicts an example of BLPOC matching without texture enhancement and another example with texture enhancement. Both examples show the image blocks f(n1,n2)andg(n1,n2), the phase featuresX(k1,k2) andY(k1,k2)and the respective BLPOC functionsr(n1,n2). The BLPOC function without enhancement exhibits multiple peaks, and the location of the highest peak does not corre- spond to the correct translational displacement between the two image blocks. On the other hand, the BLPOC function with texture enhancement produces a single peak, which location indicates the correct translational displacement be- tween the two image blocks.
3.3 Phase-Based Correspondence Search
As mentioned above, accurate authentication in biometrics cannot be performed unless dealing with various transfor- mation between the images, for example, those caused by variations in facial expression and head pose. To address the global image transformation appeared in periocular images, we combine phase-based block matching with a coarse-to- fine search strategy using multi-scale image pyramids[41].
This technique is known as Phase-Based Correspondence Matching (PB-CM) and it consists of two main steps: cor- respondence search and similarity evaluation. Ito et al. [12]
proposed this technique for palmprint recognition and it was later extended to other biometric traits[13],[42]. We mod- ified this technique for periocular recognition and demon- strated that the designed method can achieve the highest
Fig. 5 Effect of texture enhancement on the BLPOC function for comparison of a genuine block pair with poor texture (left: without texture enhancement, right: with texture enhancement).
level of performance on matching periocular features tex- tures when compared with the other methods reported so far.
Given a pair of periocular images, the problem con- sidered here is to find a set of corresponding block pairs between the two images and evaluate their similarity on the basis of block-wise correlation computation. LetPbe a set ofNblocal block locations (i.e., coordinates) on the enrolled imageI, whereP={p1,· · ·,pNb} ⊆Z2 determined in ad- vance. The correspondence search problem is to find the set of corresponding block locationsQ= {q1,· · ·,qNb} ⊆Z2 on the probe imageJ. The search ofQcomprises three main steps:
(i) Generate multi-resolution image pyramids
We indicate the resolution layer of the image pyramids by the superscriptl, where l =0,· · ·,lmax. That isIl for the enrolled image andJlfor the probe image. We generate the image pyramids by settingI (= I0) and J (= J0) and applying the following equations:
Il(n1,n2)= 1 4
X1
j1=0
X1
j2=0
Il−1(2n1+j1,2n2+j2), (10)
Jl(n1,n2)=1 4
X1
j1=0
X1
j2=0
Jl−1(2n1+j1,2n2+j2), (11)
for all l = 1,· · ·,lmax. After generating image pyramids, texture enhancement described in Sect. 3.2 is carried out for all the resolution layers.
(ii) Determine a set of local block locations in the enrolled image pyramid
Let Pl = {pl
1,· · ·,plN
b} denote a set of local block locations on the thel-th layer enrolled image Il. A set of block locationsP0 ={p0
1· · ·,p0N
b}on the original enrolled image I0 are given in advance as P0 = P and pt0 = pt. Then, the lower-resolution coordinates can be automatically computed as
plt=
$1 2l
p0t
%
, (12)
wheret =1,· · ·,Nbandl=1,· · ·,lmax.
(iii) Estimate the corresponding block locations LetQl ={ql
1,· · ·,qlN
b}denote a set of corresponding block locations on thel-th layer probe imageJl. These coor- dinates are estimated using a coarse-to-fine strategy. Thel-th
Fig. 6 Sketch of phase-based correspondence matching.
layer corresponding block locationqlt(∈Ql)is derived from the(l+1)-th layer correspondence(pl+1t ,qtl+1)recursively by
qtl =2
ql+1t +δl+1t
, (13)
wheret=1,· · ·,Nb,l <lmaxandδl+1t denotes the transla- tional displacement betweenpl+1t andql+1t estimated by the BLPOC function. This recurrence starts from the coarsest layerl =lmax, where we assume the simplest approxima- tion:
qtlm a x =pltm a x. (14)
The recurrence ends at the original resolution layerl =l0. As a result, we obtain a set of coordinatesQ =Q0 on the probe image that corresponds to a set of coordinatesPon the enrolled image. Fig. 6 depicts the coarsest-to-fine strategy for estimating the corresponding pointsqt1onJ1 andq0t on J0. The result of the original layerl0is used for similarity evaluation as it is explained below in Sect. 3.4.
We modify the original PB-CM[12],[13],[42]in or- der to dedicate PB-CM to periocular image matching as summarized below. The original PB-CM uses three level resolution pyramids, that is,lmax = 3[13]. In the case of periocular images, this is challenging due to the presence of occlusions and variations in gaze. Nonetheless, detection of eyes and facial landmarks is very mature and can ensure reliable global alignment of periocular images. Our exper- imental observation shows that correspondence search with two-level resolution pyramid,lmax =1, should suffice to a wide range of periocular recognition applications. We also introduce the new similarity evaluation metric for periocular recognition described in the next subsection.
3.4 Similarity Evaluation
We evaluate the similarity betweenI andJthrough block- wise matching on the original resolution using the corre- sponding locations Q obtained from the correspondence search. This is to compute the BLPOC functions between a set of blocks at locations P on I and a set of blocks at locationsQon Jso as to find the correlation peak values.
Fig. 7 Block center selection using thresholding to detect reflections:
(a) the original image pair, (b) reflection masks and block locations with selected locations indicated by red dot and the discarded locations indicated by blue dots and (c) images after filling the areas that have reflections and the final block locations used for matching.
So far, we assumed that all the blocks inQ = q1,· · ·,qNb
are valid in that they precisely correspond to the blocks in P=p1,· · ·,pNb.
In a real situation, however, we have to consider that some blocks inQare meaningless, since periocular images can present different kinds of occlusions such as glasses, hair, hats and specular reflections, which significantly dis- turb the matching operation. In particular, specular reflec- tions have a considerable impact on recognition performance [43], which we actually confirmed through experiments. To address this problem, we detect the specular reflections with simple thresholding operation and discard the blocks (in P andQ) that are mostly covered by reflections. To be precise, in our experiments, a block is discarded when reflections occupies more than 50% of the block area.
We first define reflection masks MI and MJ for the enrolled imageIand the probe imageJ, respectively, through thresholding:
MI(n1,n2) =
(1 ifI(n1,n2)<252
0 otherwise , (15)
MJ(n1,n2) = (
1 ifJ(n1,n2)<252
0 otherwise , (16)
where 1 indicates valid pixels and 0 indicates possible spec- ular reflections. In order to weaken the effect of abrupt intensity changes caused by specular reflections, we fill the area with reflections by interpolating inward from the pixel values on the outer boundary of such area†.
Using the reflection masks, we can select valid blocks for which more than half of the pixels are valid. Fig. 7 depicts the block selection for two images with considerable specular reflections (Fig. 7(a)). We can observe how the effect of the specular reflection on the glasses is reduced in
†For example, Matlab provides theregionfillfunction for this purpose.
Fig. 8 Overall of the proposed periocular recognition method: (a) verification procedure of phase- based correspondence matching with texture enhancement and (b) enrolment procedure of phase-based correspondence matching with texture enhancement.
Fig. 7(c). After the block selection, we can determine the valid block pairs(pt,qt), where both of two blocks are valid inIand J, respectively. LetV be the set of all the indices t for the valid block pairs(pt,qt), i.e.,V = {t|(pt,qt)}is a valid block pair, where pt ∈ Pand qt ∈ Q. Then, the correlation peak valueαt of the BLPOC function between the block pair(pt,qt)is said to be valid if and only if the block pair is valid, i.e.,t∈V.
We consider three measures for similarity (i.e., match- ing scores) betweenIandJusing the valid correlation peak values. The first measure is the straightforward average of the valid peak valuesαtas
Save = 1
|V| X
t∈V
αt. (17)
The second measure is the n-rank of peak values ordered from highest to lowest as
Srank =αtn, (18)
where the valid peak values are sorted asαt1 ≥ · · · ≥ αtn ≥
· · · ≥αt|V|. The third measure is the number of peak values that are greater than a threshold valuet hras
Sthr =X
t∈V
h(αt), (19)
where h(x)=
(1 ifx≥T hr 0 otherwise. .
4. Periocular Recognition Algorithm
We describe our proposed algorithm for periocular recogni- tion using PB-CM with texture enhancement. Fig. 8 shows the overall of the recognition method. The enrolment proce- dure is depicted in Fig. 8(b) and described by Algorithm 1.
During enrolment, we register a given periocular image as
Algorithm 1Enrolment procedure
Require: An imageIto be enrolled
Ensure: A set of phase featuresXtl(k1,k2)forI Generate the reflection maskMI(n1,n2)by Eq. (15)
Fill the area with specular reflections onIas described in Sect. 3.4 Generate a two-layer resolution pyramid and apply texture enhancement so as to obtainI0andI1as described in Sect. 3.3 and Sect. 3.2 fort∈ {1,2,· · ·,Nb}do
ifthe block at locationp0thas more than 50% of valid pixels according toMI(n1,n2)then
Extract a block fromI0atp0t
Compute the phase featureX0t(k1,k2)by Eq. (3) Extract a block fromI1atp1t
Compute the phase featureXtl(k1,k2)by Eq. (3) end if
end for
Store the computed phase features in the gallery
an array of local phase features extracted from its multi- resolution image pyramid with texture enhancement. A phase feature extracted from the enhanced enrolled image Ilat positionpltis denoted byXtl(k1,k2).
The verification procedure is depicted in Fig. 8(a) and described by Algorithm 2. During verification, given a probe image J, we extract a set of phase features from its multi- resolution image pyramid with texture enhancement. We compare these phase features with the phase features in the gallery using correspondence search and similarity evalua- tion. Ytl(k1,k2) denotes a phase feature extracted from the enhanced probe imageJlat a positionqt.
In addition, we reduced the registered-data size of the phase features stored in the gallery. We stored only a reduced portion of the total phase information by taking advantage of the spectrum symmetry and including only the band re- quired for the calculation of the BLPOC functions. Also, we applied quantization to the phase angles (see[13],[34]for details). Phase quantization has shown slight degradation of the recognition performance by carefully considering the number of bits used.
Algorithm 2Verification procedure
Require:A probe imageJ
Ensure: A matching score betweenJand the enrolled imageI Generate the reflection maskMJ(n1,n2)by Eq. (16)
Fill the area with specular reflections onJas described in Sect. 3.4 Generate a two-layer resolution pyramid and apply texture enhancement so as to obtainJ0andJ1as described in Secs. 3.3 and 3.2
Initialize the corresponding points q1t (t = 1,2,· · ·,Nb) onJ1 by Eq. (14)
Initialize the setV, i.e.,V={∅ } for t∈ {1,2,· · ·,Nb}do
if there is a phase featureX1t(k1,k2)in the gallerythen Extract a corresponding block fromJ1atq1t Compute the phase featureYt1(k1,k2)by Eq. (4)
Compute the BLPOC function betweenX1t(k1,k2)andYt1(k1,k2) by Eq. (5) and Eq. (7)
Estimate the translational displacementδ1t Determineq0tfromq1tandδ1tby Eq. (13) Extract a corresponding block fromJ0atq0t
ifthe block atq0t has more than 50% of valid pixels according to MJ(n1,n2)then
Compute the phase featureYt0(k1,k2)by Eq. (4)
Compute the BLPOC function between X0t(k1,k2) and Yt0(k1,k2)by Eq. (5) and Eq. (7)
Obtain the peak valueαtand addtto the setV end if
end if end for
Compute the matching score betweenIandJfrom the valuesαt(t∈V) using one of the similarity measures described in Sect. 3.4
5. Experimentals and Discussion
This section describes performance evaluation of the pro- posed method and two baseline methods, which are one based on LBP[44]and the other based on SIFT[45], using three publicly available databases: CASIA-Iris-Distance in the CASIA Iris Image Database Version 4.0 (CASIA)[46], UBIPr database (UBIPr)[8], and ocular still challenge of the NIST FOCS database (FOCS)[47]. We also compare the recognition performance of our method with the per- formance reported in the literature for advanced periocular recognition methods[23],[27].
For the comparative evaluation, we present the Receiver Operating Characteristic (ROC) curve, which is a plot of the False Rejection Rate (FRR) against the False Acceptance Rate (FAR). In all the experiments, we measured the verifi- cation performance using the Equal Error Rate (EER), which is the error rate when FAR [%] is equal to FRR [%]. We compute the EER [%] values by linear interpolation of the ROC curves.
5.1 Databases
The images in the CASIA database were collected by the Institute of Automation, Chinese Academy of Sciences[46].
This database consists of 2,567 partial face images taken from 142 subjects under near infrared illumination, where the subjects stand at a distance around 3m from the camera. The size of this images is 2,352×1,728 pixels (width×height)
and they cover from the mouth to the forehead of the subjects.
The images contain small variations in head pose and occlu- sions due to hair, eyeglass, and specular reflections. When the tilt (or rotation of the face) is more than six degrees, we correct it by aligning the eyes position horizontally. We scaled the images to one-fourth of the original image resolu- tion and cropped two periocular regions of 300×300 pixels for each eye.
The University of Beira Interior Periocular (UBIPr) database [8]consists of 10,950 periocular images captured in the visible spectrum from 342 subjects[47]. Each subject has images at five different resolutions: 501×401 pixels at 8m (stand-off distance), 561×441 pixels at 7m, 651×501 pixels at 6m, 801×651 pixels at 5m and 1,001×801 pixels at 4m. We scale all these images to a common size of 240×300 pixels and transform them into gray-scale.
The Face and Ocular Challenge Series (FOCS) database [47] consists of 9,581 periocular images of 136 subjects where 4,792 images are from left eyes and 4,789 images are from right eyes. Images are captured with a near-infrared camera at an image resolution of 750×600 pixels. These periocular images were extracted from video sequences of subjects while walking. This database contains images with blur, occlusion and gaze deviation. The images also exhibit drastic variations in illumination and sensor noise. We scale these images to a size of 300×240 pixels.
5.2 Baseline Methods
In order to compare the recognition performance of the pro- posed method, we implemented two baseline recognition methods, which employ well-known image descriptors: Lo- cal Binary Patterns (LBP)[48]and modified Scale-Invariant Feature Transform (m-SIFT)[18]. The first method used the LBP operator[49], which assigns a label to every pixel of an image by thresholding the neighborhoods of each pixel with the center pixel value and considering the result as a binary number. Then, the histogram of the labels is used as a texture descriptor. Periocular recognition is performed by block-wise comparison of the local histograms. We tested two block sizes for the histogram computation, which are 30×30 pixels for small size and 50×50 pixels for large size. In the experiments with the CASIA database, images are divided into 10×10 (column×row) for small blocks and 6 ×6 for large blocks. In the case of FOCS and UBIPr databases, we divided images into 10×8 for small blocks and 6×5 for large blocks. We use Matlab implementation of LBP†. The modified SIFT (m-SIFT) method[18]is a bio- metric recognition method based on SIFT features[45]. In our experiments, m-SIFT is implemented using the VLfeat library††like Ross et al.[18]. For a fair comparison, we also applied the reflection mask described in Sect. 3.4 to select or discard features for the two baseline methods. If the circular region around a SIFT keypoint has less than 70% of valid
†http://www.cse.oulu.fi/CMV/Downloads/LBPSoftware
††http://www.vlfeat.org/
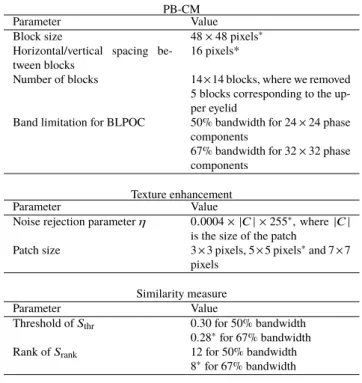
Table 1 Parameters for PB-CM and texture enhancement. Parameters indicated with∗are used in the comparative evaluations.
PB-CM
Parameter Value
Block size 48×48 pixels∗
Horizontal/vertical spacing be- tween blocks
16 pixels*
Number of blocks 14×14 blocks, where we removed 5 blocks corresponding to the up- per eyelid
Band limitation for BLPOC 50% bandwidth for 24×24 phase components
67% bandwidth for 32×32 phase components
Texture enhancement
Parameter Value
Noise rejection parameterη 0.0004× |C| ×255∗, where|C| is the size of the patch
Patch size 3×3 pixels, 5×5 pixels∗and 7×7 pixels
Similarity measure
Parameter Value
Threshold ofSthr 0.30 for 50% bandwidth 0.28∗for 67% bandwidth
Rank ofSrank 12 for 50% bandwidth
8∗for 67% bandwidth
area, that keypoint is discarded, and if an LBP block has less than 70% of valid area, that block is discarded.
5.3 Impact of Texture Enhancement on Recognition Accu- racy
We employed the CASIA database to evaluate the effect of texture enhancement, since CASIA images are larger than those of the other two databases and display richer skin tex- ture. The parameters for PB-CM and the texture enhance- ment are presented in Table 1. Texture enhancement affects the appearance of the images with a whitening-like effect, which intensifies the texture representation in the higher fre- quency bands. Hence, the use of wider BLPOC bandwidth compared with the usual 50% bandwidth[13]can improve verification performance. For this reason, we consider two band limitation setups for BLPOC and three patch size for texture enhancement. Table 2 presents the EERs for the aforementioned configurations. We observe consistent im- provement using texture enhancement for both eyes. The introduction of texture enhancement and 67% BLPOC band- width can reduce EER to less than one third of the original case (50% bandwidth) and no enhancement. Considering these results, in the following experiments, we employ a patch size of 5×5 pixels and a bandwidth of 67%. For this configuration, the similarity measures Sthr and Srank con- sistently outperform Save, and hence we omit Save in the following experiments.
5.4 Comparative Performance Evaluation
We compared our proposed method with the baseline meth-
ods for the three databases. We adopt the parameters marked with ∗ in Table 1. The number of blocks for PB-CM is changed depending on the database used, i.e., 14×14 for CASIA and 14×11 for FOCS and UBIPr. Additionally, we employ 4-bit quantization for phase angle representation (see Appendix for further on the effect of quantization). We also compare the performance of the proposed method without texture enhancement in order to demonstrate the effective- ness of texture enhancement in periocular recognition. Ta- ble 3(a), (b) and (c) summarize the verification performance for the CASIA, UBIPr, and FOCS databases, respectively.
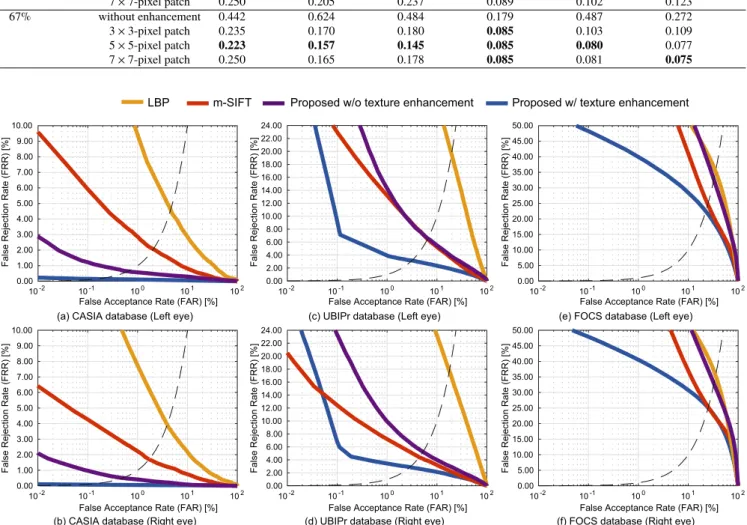
Fig. 9 compares the ROC curves of the proposed method with Srank, the proposed method with texture enhancement and Srankand the conventional methods using m-SIFT and LBP (the best case) for the three databases. The proposed method with texture enhancement outperforms m-SIFT, while m- SIFT outperforms LBP for the three databases. The pro- posed method with texture enhancement outperforms that without texture enhancement in all the cases. Hence, we dis- cuss the experimental results only for the proposed method with texture enhancement in the following.
As for the CASIA database shown in Table 3(a), the proposed method exhibits EERs one order of magnitude lower than those of m-SIFT. As observed at FAR=0.01%
in Fig. 9(a) and (b), the proposed method has a significantly low FRR, i.e., 0.23% for left eye and 0.09% for right eye, compared with m-SIFT, i.e., 9.6% for left eye and 6.4% for right eye. The CASIA database has an advantage for the pro- posed method due to its relatively good quality images with some skin texture. This database is also acceptable for m- SIFT, since the images have around 400 m-SIFT keypoints on average.
As for the UBIPr database shown in Table 3(b), the pro- posed method and m-SIFT performed relatively close, while LBP performed poorly. Unlike the CASIA database, the UBIPr database contains images with significant large head- pose variation specially in yaw rotations, which are difficult to address. This is a relatively advantageous scenario for m- SIFT due to its robustness against image deformation. Also, the UBIPr images contain a significant number of SIFT key- points, where around 1,200 keypoints in average per image are detected. Nonetheless, as observed at FAR=0.1% in Fig. 9(c) and (d), the proposed method exhibits significantly low FRRs, i.e., 9.1% for left eye and 6.5% for right eye, with respect to m-SIFT, i.e., 16.7% for left eye and 10.29% for right eye.
As for the FOCS database shown in Table 3(c), all the methods performed poorly. The proposed method performs slightly better than m-SIFT in terms of EER. This database is highly challenging, since it contains images with substantial blur and noise.
5.5 Comparison with Methods Based on Trained Features In Sect. 5.4, we demonstrated that the proposed method achieves higher performance on periocular recognition com- pared with other well-established biometric recognition
Table 2 EERs [%] of phase-based image matching with and without texture enhancement. Bold fonts indicate the best EER per similarity measure.
Bandwidth Texture enhancement Left eye Right eye
Save Srank Sthr Save Srank Sthr
50% without enhancement 0.415 0.451 0.472 0.165 0.313 0.351
3×3-pixel patch 0.237 0.197 0.210 0.094 0.116 0.128
5×5-pixel patch 0.237 0.179 0.227 0.089 0.098 0.108
7×7-pixel patch 0.250 0.205 0.237 0.089 0.102 0.123
67% without enhancement 0.442 0.624 0.484 0.179 0.487 0.272
3×3-pixel patch 0.235 0.170 0.180 0.085 0.103 0.109
5×5-pixel patch 0.223 0.157 0.145 0.085 0.080 0.077
7×7-pixel patch 0.250 0.165 0.178 0.085 0.081 0.075
Fig. 9 Comparison of ROC curves of the proposed method and conventional methods.
methods, which employ highly robust feature descriptors:
m-SIFT and LBP. The major difficulty of periocular recog- nition is that the skin under the eyes has considerably weak texture and hence conventional methods of biometric fea- ture representation could not capture its inherent features.
Another possibility to address this problem would be to use state-of-the-art machine learning techniques with training data set. In order to enhance the credibility of this paper, in this section, we additionally consider two methods: one is based on Convolutional Neural Networks (CNNs), which are gaining traction also in biometric applications[50],[51], and the other is based on correlation filters, which have been studied on periocular recognition[9],[18],[26]–[28],[52].
Specifically, we compared with “Semantic assisted CNN (SCNN)” proposed by Zhao et al.[23]and “Periocular Prob- abilistic Deformation Model (PPDM)” proposed by Smereka
et al.[27].
We prepared a subset of the CASIA database that im- itates the setup used in [23]for SCNN, although we used different image segments. Table 4 presents the parame- ters of this setup, and Table 5 shows the resulting EERs of our method and SCNN implementation†. The error rates of our method are one order of magnitude lower than those of SCNN. We assumed that our segments were fa- vorable to SCNN, since in our experiments SCNN yielded EER=4.32%, which is lower than EER=6.61% reported in the literature [23]. Therefore, the comparison in Table 5 should be fair. Note that the EERs of the proposed method in Table 5 differ from those in Table 3 due to the difference in experimental setup.
We also compare our method with PPDM considering
†http://www4.comp.polyu.edu.hk/ csajaykr/scnn.rar
Table 3 EERs [%] of the proposed method and conventional methods on CASIA database, UBIPr database and FOCS database, where TE indicates texture enhancement.
(a) CASIA database
Method Left eye Right eye
LBP (Block size: 30×30 pixels) 6.067 4.877 LBP (Block size: 50×50 pixels) 4.595 3.920
m-SIFT 2.065 1.710
Proposed withSrank 0.640 0.510
Proposed withSthr 0.610 0.290
Proposed with TE andSrank 0.143 0.075 Proposed with TE andSthr 0.150 0.078
(b) UBIPr database
Method Left eye Right eye
LBP (Block size: 30×30 pixels) 19.59 17.70 LBP (Block size: 50×50 pixels) 30.10 29.88
m-SIFT 5.57 4.15
Proposed withSrank 6.55 5.25
Proposed withSthr 5.19 4.05
Proposed with TE andSrank 3.16 2.87
Proposed with TE andSthr 3.47 3.17
(c) FOCS database
Method Left eye Right eye
LBP (Block size: 30×30 pixels) 35.30 35.45 LBP (Block size: 50×50 pixels) 46.60 43.03
m-SIFT 24.69 25.26
Proposed withSrank 32.64 32.79
Proposed withSthr 32.02 32.46
Proposed with TE andSrank 22.46 25.08 Proposed with TE andSthr 24.67 26.46
Table 4 Experimental setup for comparing with SCNN.
Parameter Value
Image selection As provided in the webpage† Image resolution 0.294 times the original resolution,
which is estimated from image sam- ples provided in the webpage†
Image size 240×240 pixels
Right eye images Right eye images are flipped horizon- tally, since SCNN is trained for left eye images
Number of blocks for PB-CM 10×10 blocks
Table 5 EERs [%] on a subset of CASIA database.
Method Left eye Right eye
SCNN 4.32 4.25
Proposed withSrank 0.682 0.237
Proposed withSthr 0.735 0.253
the EERs reported in the literature for left eye images. The EERs of PPDM are 10.47% and 7.67% for CASIA database [23]and UBIPr database[27], respectively. These EERs are more than double of those of our method for the respective databases, i.e., 0.68% and 3.16%. We do not consider that the difference in test protocols can be the reason of such pronounced difference in performance. Therefore, we con- clude that our method has clear advantage over PPDM in periocular image matching.
In the case of FOCS database, for left eye images, the EER of SCNN reported in [23] is 10.47%, and the EER of PPDM reported in[27]is 22.44%. Their experimental
evaluation differs in term of preprocessing and selection of test images. However, we can infer that the performance of our method, i.e., EER=22.19% is close to PPDM, while it is clearly worse than the performance of SCNN. This is because our method did not deal with such a high level of noise and blur as is observed in the FOCS images, while CNNs are able to manage a certain degree of feature ambiguity due to image quality degradation. We will consider introducing deblurring and denoising based on spatiotemporal analysis of video sequences in addition to texture enhancement so as to realize accurate periocular recognition for walking persons in future work.
6. Conclusion
We proposed a periocular recognition algorithm using phase- based correspondence matching with texture enhancement.
We demonstrated that the phase-based approach also exhibits impressive performance in periocular recognition compared with conventional approaches. By using texture enhance- ment, we improved the recognition performance of phase- based image matching on the skin texture of periocular im- ages. Experimental evaluation using three public databases demonstrated a clear advantage of the proposed method matching on periocular images over conventional methods.
Acknowledgments
This work was supported by JSPS KAKENHI Grant Number 18H03253.
References
[1] M. De Marsico, M. Nappi, and M. Tistarelli, Face Recognition in Adverse Conditions, IGI Global, 2014.
[2] K. Ricanek, M. Savvides, D.L. Woodard, and G. Dozier, “Uncon- strained biometric identification: Emerging technologies,” Com- puter, vol.43, no.2, pp.56–62, Feb. 2010.
[3] S.Z. Li and A. Jain, Handbook of Face Recognition, Springer, 2011.
[4] M.J. Burge and K. Bowyer, Handbook of Iris Recognition, Springer, 2013.
[5] G. Santos and H. Proença, “Periocular biometrics: An emerging technology for unconstrained scenarios,” Proc. IEEE Symp. Compu- tational Intelligence in Biometrics and Identiry Management, pp.14–
21, April 2013.
[6] I. Nigam, M. Vatsa, and R. Singh, “Ocular biometrics: A survey of modalities and fusion approaches,” Information Fusion, vol.26, pp.1–35, Nov. 2015.
[7] F. Alonso-Fernandez and J. Bigun, “A survey on periocular biomet- rics research,” Pattern Recogn. Lett., vol.82, no.2, pp.92–105, Oct.
2016.
[8] C.N. Padole and H. Proença, “Periocular recognition: Analysis of performance degradation factors,” Proc. Int’l Conf. Biometrics, pp.439–445, March 2012.
[9] V.N. Boddeti, J.M. Smereka, and B.V.K.V. Kumar, “A comparative evaluation of iris and ocular recognition methods on challenging ocular images,” Proc. Int’l Joint Conf. Biometrics, pp.1–8, Oct. 2011.
[10] S. Bharadwaj, H.S. Bhatt, M. Vatsa, and R. Singh, “Periocular bio- metrics: When iris recognition fails,” Proc. IEEE Int’l Conf. Bio- metrics: Theory, Applications and Systems, pp.1–6, Sept. 2010.
[11] P.E. Miller, J.R. Lyle, S.J. Pundlik, and D.L. Woodard, “Performance

![Table 3 EERs [%] of the proposed method and conventional methods on CASIA database, UBIPr database and FOCS database, where TE indicates texture enhancement.](https://thumb-ap.123doks.com/thumbv2/123deta/5634431.1501525/11.892.71.430.164.579/proposed-conventional-methods-database-database-database-indicates-enhancement.webp)
