九州大学学術情報リポジトリ
Kyushu University Institutional Repository
表面形状自動測定システムの開発に関する研究
ムハマド, ハズラト, アリ
https://doi.org/10.15017/1441225
出版情報:Kyushu University, 2013, 博士(工学), 課程博士 バージョン:
権利関係:Fulltext available.
DEVELOPMENT OF AUTOMATIC MEASUREMENT SYSTEM FOR SURFACE PROFILES
MD. HAZRAT ALI
March, 2014
Doctoral Thesis
Department of Mechanical Engineering Graduate School of Engineering
Kyushu University
ii
ABSTRACT
This thesis presents the research findings of measuring surface profile automatically in manufacturing components where the traditional measurement system is not applicable. In Part I of this study, the laser guided deep-hole measurement system is applied to holes with normal millimeter-level diameters and lengths of several hundred millimeters. A measurement system which can measure a small size hole with a diameter between 17 to 21 mm and having a length between 0 to 800 mm is developed, and the performance has been evaluated experimentally.
Accurate measurement of diameter, roundness, cylindricity, and straightness of a deep-hole is essential for improving the performance of manufacturing products and components. However;
existing systems have drawbacks to precisely measuring holes with large- length-to- diameter ratios, which require multiple measurement devices. In order to accurately evaluate the parameters of such deep-holes with millimeter-level diameters and meter-level lengths using a single device, a laser-guided deep-hole measurement probe is developed. In Part II of this thesis, the developed gear circumference measurement system has been described with the increment of scanning speed up to 20 times faster than the conventional system. During gear profile measurement, the synchronized movement control of both axes is the key issue to achieve the constant line speed scanning in whole measurement. To justify the proposed measuring strategy, the new Gear Measuring Machine (GMM) is developed with direct axis-driving and 3D probe implementation. A standard cylindrical gear is measured using the developed GMM and the whole shape of the gear outline was successfully obtained with the maximum scanning speed of 7 mm/s without detaching the stylus from the workpiece. The tip edge is one of the challenging shapes to be measured, but it is also obtained with good accuracy by adjusting the nominal data.
The proposed method has great advantage over conventional gear measurement system as it gives detail information of tooth profiles of both tooth flanks for all teeth, tip diameter, the edge shapes of tooth tips, root and bottom profiles for all teeth, as well as pitch deviation in one complete measurement. Since those useful deviation parameters can be obtained automatically in only one scanning procedure for a target gear; it is very useful and cost effective in manufacturing industries. In addition; a camera and software system is integrated with the gear measurement system in order to enhance overall safety and reliability of the developed system.
iii
PART I
LASER-GUIDED DEEP-HOLE MEASUREMENT SYSTEM FOR
HOLES HAVING SMALL DIAMETERS AND LONG LENGTHS
iv
Table of Contents
Contents Page no.
ABSTRACT ... ii
PART I ... iii
Table of Contents ... iv
List of Figures ... ix
List of Tables ... xiii
CHAPTER 1 ... 1
INTRODUCTION ... 1
1.1 Introduction ... 1
1.2 Deep-hole ... 2
1.3 Problem statement ... 3
1.4 Research objectives ... 3
1.5 Research methodology ... 4
1.6 Research scope ... 5
1.7 Thesis organization ... 5
CHAPTER 2 ... 6
BACKGROUND STUDY ... 6
2.1 Introduction ... 6
2.2 Surface roughness measurement system ... 9
2.2.1 Measurement probe with various measurement units ... 9
2.2.2 Working principle of previous measurement system for larger holes ... 10
2.3 Roundness error evaluation technique ... 12
v
2.4 Three point roundness measurement ... 13
2.5 Non-contact based roundness measurement ... 13
2.6 Surface measurement applied optical instruments ... 14
2.7 Laser based macrostructure measurement ... 14
2.8 Measurement system based on confocal laser scanning microscope ... 15
CHAPTER 3 ... 16
MEASUREMENT SYSTEM COMPONENTS ... 16
3.1 Measurement system ... 16
3.2 Design of measurement unit ... 16
3.3 Pentaprism ... 16
3.4 Integrated optical components ... 18
3.4.1 Pentaprism and its working principle ... 18
3.4.2 Corner-cube prism and its working principle... 19
3.5 Laser system ... 20
3.5.1 Laser beam radiation and reflection ... 20
3.5.2 Laser interferometer‟s output ... 21
3.5.3 Basic laser beam testing ... 23
3.6 Front axis setting by PSD sensor ... 24
3.7 Setting main axis ... 26
3.8 Complete system setting ... 27
3.9 Rear axis setting ... 27
3.10 Rear CCD camera ... 29
3.11 Rear CCD camera spot detection ... 29
3.12 Summary ... 31
vi
CHAPTER 4 ... 32
WORKING PRINCIPLES OF ROUNDNESS MEASUREMENT ... 32
4.1 Introduction ... 32
4.2 Working principle of laser interferometer... 34
4.2.1 Laser interferometer and its function ... 36
4.2.2 Experimental procedure using laser interferometer ... 36
4.3 Working principle of PSD sensor ... 38
4.4 Working principle of rear CCD cameras ... 40
4.4.1 Rear optical device ... 43
4.4.2 Rear probe‟s coordinate calculation based on CCD spot ... 43
4.4.3 Measurement effects on the spot changes of CCD camera ... 44
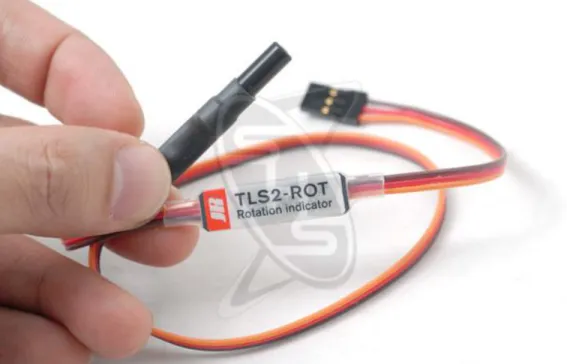
4.5 Working principle of rotation detector sensor ... 45
4.5.1 Features of the rotation detecting sensor ... 45
4.5.2 Specifications of rotation detecting sensor ... 46
4.6 Working principle of measurement unit ... 46
4.6.1 Detection of hole deviation ... 46
4.6.2 Deviation of probe from hole center ... 47
4.6.3 Effect of initial inclination on detection accuracy ... 48
4.7 Measurement unit control ... 49
4.8 Working principle of integrated computer system ... 51
4.8.1 Measurement probe ... 51
4.8.1.1 Measurement system without actuator ... 52
4.8.1.2 Integrated measurement system with actuator ... 52
4.8.2 Editing program ... 54
vii
4.8.3 Saving program after editing ... 54
4.8.4 Compiling program ... 55
4.8.5 Table feed ... 55
4.8.6 Roundness measurement ... 56
4.9 Summary ... 56
CHAPTER 5 ... 57
RESULTS AND DISCUSSION ... 57
5.1 Introduction ... 57
5.2 Experimental results ... 57
5.2.1 Experiment # 1: Hole depth = 40 mm ... 57
5.2.2 Experiment # 2: Hole depth = 50 mm ... 60
5.2.3 Experiment # 3: Hole depth = 60 mm ... 62
(1) Trial # 1 ... 62
(2) Trial # 2 ... 65
(3) Trial # 3 ... 68
(4) Trial # 4 ... 71
5.2.4 Experiment # 4: Hole depth = 100 mm ... 74
5.2.5 Experiment # 5: Hole depth = 200 mm ... 76
5.2.6 Experiment # 6: Hole depth = 300 mm ... 78
5.2.7 Experiment # 7: Hole depth = 400 mm ... 80
5.2.8 Experiment # 8: Hole depth = 800 mm ... 82
5.2.8.1 Intermediate feed and circumferential scanning ... 83
5. 3 Experimental results at different conditions ... 85
5.3.1 Case 1: N=6 min-1, f=0.5 mm/rev, distance 100 mm ... 85
viii
5.3.2 Case 2: N=6 min-1, f=0.5 mm/rev, distance 200 mm and 400 mm ... 85
5.4 Experimental results for longitudinal scanning ... 86
5.5 Key achievements ... 86
5.6 Performance analysis of the developed deep-hole measurement system ... 87
5.6.1 Performance evaluation of roundness measurement ... 87
5.6.2 Performance evaluation of 3d shape measurement ... 87
5.6.3 Performance evaluation of CCD data measurement ... 88
5.7 Summary ... 88
CHAPTER 6 ... 89
CONCLUSION AND FUTURE WORKS ... 89
6.1 Introduction ... 89
6.2 Conclusion ... 89
6.3 Future works ... 90
6.4 Mechanical actuator for the measurement system ... 91
6.5 Assembly design of the mechanical actuator ... 93
REFERENCES ... 95
ix
List of Figures
Figures ...Page no.
Fig. 2. 1 Laser guided deep-hole measurement probe ... 10
Fig. 2. 2 Fundamental structure of deep-hole measurement probe ... 10
Fig. 2. 3 Overview of the measurement system ... 11
Fig. 3. 1 Pentaprism for the measurement head ... 16
Fig. 3. 2 Combined assembly design of the measurement head ... 17
Fig. 3. 3 Measurement head checking ... 17
Fig. 3. 4 Pentaprim and its working principle ... 18
Fig. 3. 5 The reflection principle of pentaprism ... 19
Fig. 3. 6 Corner cube prism and its working principle ... 20
Fig. 3. 7 State of the working laser interferometer ... 20
Fig. 3. 8 (a) A correct laser beam radiation; (b) an error occurred during laser beam radiation ... 21
Fig. 3. 9 (a) An active laser interferometer during manufacturing process; (b) an example of correct laser beam radiation before measurement ... 21
Fig. 3. 10 (a) An example of active measurement while generates alarm in monitor; (b) Laser interferometer monitor after resetting the button ... 22
Fig. 3. 11 Laser and optical error checking ... 23
Fig. 3. 12 PSD sensor for front axis setting ... 24
Fig. 3. 13 Adjustment of position and slope of laser optical axis………....25
Fig. 3. 14 Overview of the measurement system ... 27
Fig. 3. 15 Positioning of the rear CCD camera ... 28
Fig. 3. 16 CCD camera (LU 125) ………...29
x
Fig. 3. 17 Laser spots on computer monitor from (a) CCD1 and (b) CCD2 cameras ... 30
Fig. 3. 18 (a) CCD camera shows the spot position in terms of „X‟ and „Y‟ axes; (b) rear measurement deviation result recorded by CCD cameras ... 30
Fig. 4. 1 Axis setting for laser interferometer ... 35
Fig. 4. 2 A set of complete laser interferometer ... 36
Fig. 4. 3 Shape of the workpiece ... 36
Fig. 4. 4 Measurement unit ... 37
Fig. 4. 5 Calculation of radius of the hole ... 37
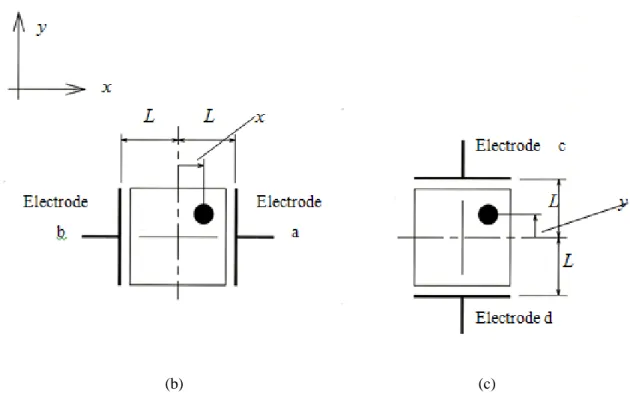
Fig. 4. 6 Measurement principle of the PSD: Determination of (b) x coordinate, Determination of (c) y coordinate ... 40
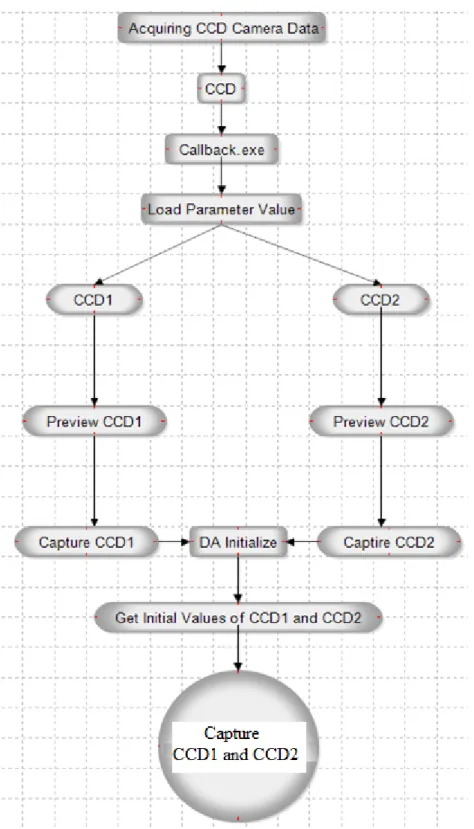
Fig. 4. 7 Flow chart for acquiring CCD camera data ... 41
Fig. 4. 8 Measurement method for probe position and inclination ... 42
Fig. 4. 9 (a) Rear laser beam setting, (b) mirror 1 and (c) mirror 2 of the rear optical system43 Fig. 4. 10 Rotation detector sensor ... 45
Fig. 4. 11 Hole shapes measurement ... 47
Fig. 4. 12 Deviation of probe from hole center ... 47
Fig. 4. 13 Motor and controller used for measurement head ... 49
Fig. 4. 14 Measurement head controlling program using Microchip programmer ... 50
Fig. 4. 15 Controlling method of DC motor ... 50
Fig. 4. 16 Measurement probe design ... 51
Fig. 4. 17 Manufactured measurement probe ... 52
Fig. 4. 18 Laser-guided deep-hole measurement system without actuators ... 52
Fig. 4. 19 Integrated experimental set up ... 53
Fig. 4. 20 Flow chart for editing the program ... 54
xi
Fig. 4. 21 Flow chart for saving the program after editing ... 54
Fig. 4. 22 Flow chart for compiling the program ... 55
Fig. 4. 23 Flow chart for moving the table ... 55
Fig. 4. 24 Flow chart for roundness measurement ... 56
Fig. 5. 1 Measured roundness curve of the hole ... 58
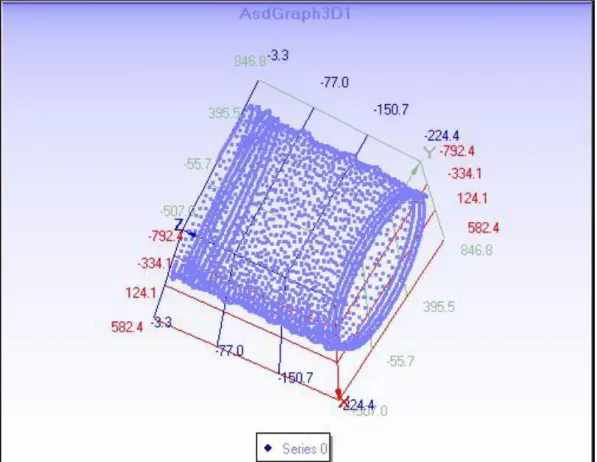
Fig. 5. 2 3d inner shape of the measured deep-hole ... 59
Fig. 5. 3 Rear view obtained from CCD camera ... 59
Fig. 5. 4 Measured roundness curve of the hole ... 60
Fig. 5. 5 Measured 3d shape of the inner hole surface ... 61
Fig. 5. 6 Rear CCD camera data for 50mm ... 61
Fig. 5. 7 Measured roundness curve ... 63
Fig. 5. 8 3d inner shape of the measured deep-hole ... 64
Fig. 5. 9 Rear view obtained from CCD camera ... 64
Fig. 5. 10 Measured roundness curve of the hole ... 66
Fig. 5. 11 3d inner shape of the measured deep-hole ... 67
Fig. 5. 12 Rear view obtained from CCD camera ... 67
Fig. 5. 13 Measured roundness curve of the hole ... 69
Fig. 5. 14 3d inner shape of the measured deep-hole ... 70
Fig. 5. 15 Rear view obtained from CCD camera ... 70
Fig. 5. 16 Measured roundness curve of the hole ... 72
Fig. 5. 17 3d inner shape of the measured deep-hole ... 73
Fig. 5. 18 Rear view obtained from CCD camera ... 73
Fig. 5. 19 Measured roundness curve of the hole ... 74
xii
Fig. 5. 20 3d shape of the inner hole surface ... 75
Fig. 5. 21 Rear CCD camera data for 100mm ... 75
Fig. 5. 22 Measured roundness curve of the hole ... 76
Fig. 5. 23 Measured 3d shape of the inner hole surface ... 77
Fig. 5. 24 Rear CCD camera data for 200mm ... 77
Fig. 5. 25 Measured roundness curve of the hole ... 78
Fig. 5. 26 Measured 3d shape of the inner hole surface ... 79
Fig. 5. 27 Rear CCD camera data for 300mm ... 79
Fig. 5. 28 Measured roundness curve of the hole ... 80
Fig. 5. 29 Measured 3d shape of the inner hole surface ... 81
Fig. 5. 30 Rear CCD camera data for 400 mm ... 81
Fig. 5. 31 Spirally scanned hole shape measured by the laser interferometer ... 82
Fig. 5. 32 Circumferentially scanned hole shape: measured every hole depth of 50 mm by the laser interferometer ... 83
Fig. 5. 33 Corrections of measured roundness profile using fitting method, and locational delay of rotation-detection sensor ... 84
Fig. 5. 34 Hole deviation obtained from CCDδ and CCDi ... 86
Fig. 5. 35 Longitudinal scanning of four hole walls ... 86
Fig. 6. 1 Middle part of the actuator ... 91
Fig. 6. 2 Connecting part of the actuator ... 92
Fig. 6. 3 Assembly design of different parts of the actuator... 93
Fig. 6. 4 Assembly drawing with integrated worm gear ... 94
xiii
List of Tables
Table Page no.
Table 3. 1: Pentaprism specification (Sigma Koki.co.jp) ... 19
Table 3. 2 : Laser specification ... 23
Table 3. 3 : Specifications of PSD sensor... 25
Table 3. 4 : CCD camera specification (Lu 125) ... 29
Table 4. 1 : CCD1 camera‟s coordinate effects ... 44
Table 4. 2 : CCD2 camera‟s coordinate effects ... 44
1
CHAPTER 1
INTRODUCTION 1.1 Introduction
Nowadays, the production quality is a major stake specially for fields like mechanical and nuclear industries which have to produce extremely accurate parts. Large hole can be found in jet engine shaft, wheel shaft of high speed train or in the cylinder liner of a large ship for example. It is very difficult to measure precisely the accuracies of these kind of hole parameters, such as its diameter, roundness, cylindricity and straightness;
particularly when the hole has high length to diameter ratio (L/D). Currently, all these hole parameters are measured by different kind of devices such as roundness tester, cylinder gauge and so on. Using several measuring devices instead of one is very time consuming. This operation does not create any added value on the produced parts, therefore it is important to reduce the time duration.
The purpose of this research is to design a measurement probe which would allow us to determine the hole surface parameters accurately in a short time. This probe uses a laser system to scan the hole wall and can be controlled to correct the position and inclination of the probe. The aim of this research is to develop a system that can solve the problem in measuring unreachable holes such as long length and small diameter in mechanical components. The misalignment of main spindle, guide bush, workpiece and table (machining system) also could bring the hole deviation. The precise adjustment of this machining system could decrease the deviation although it is impossible to prevent perfectly this misalignment. At present condition, the possible depth of internal grinding finishing is very low. If the hole diameter is 110 mm, possible grinding depth will be just 350 mm, so to reach 1000 mm of depth is still facing with impossibility.
There is a high importance of online measurement in deep-hole boring. Nowadays, often lasers are used to keep machine on target and a precision of as good as 0.1 μm can be reached, as discussed by Hallum [1]. System applying lasers in combination with Position Sensitive Detector (PSD) are widely in use for measurement and adjustment
2
tasks. But their application to deep-hole boring is not known except for the actual case in the present research. Optical sensors like laser, CCD and PSD have been developed because of their immunity to harsh environment such as intense electromagnetic fields, high temperatures and corrosive environments [2]. Necessity of adjustment of the tool‟s course to reduce axial hole deviation has led to development of a deep-hole boring tool guided by laser, which builds the basis for the present research work. The detail system structure, specifications, and working process could be read deeply at the later chapter of this thesis. System works in general, but precision and depth of hole are limited by rigidity of connecting shafts.
1.2 Deep-hole
All boring operations count for approximately 30% of all metal cutting operations, whereas, solid boring alone stands for 22%. Conventional twist drills are applied without any problems up to length to diameter (L/D) ratio of about 3 to 5. Deep-hole boring operations find many wide fields of applications, as there are manufacturing of precision cylinders for extrusion machinery and injection molding machinery, weight reduction of rotating shafts, or even mass production in case of engine cylinders. A hole with a depth more than five times of diameter usually defined as a deep-hole. Deep-hole boring is one of the most difficult processes in cutting and grinding, specially when the ratio of L/D is bigger than the normal ratio. In comparison to small holes, deep-holes have special features that require specially designed tool for application.
At present, the deep-hole boring is done by the use of BTA (Boring and Trepanning Association)/ STS (Single Tube System), DTS (Double Tube System) or gun drill.
Although these tools have self-guiding action for keeping the straightness of forward movement as the excellent point of these tools, but when the ratio of hole length to diameter is increasing, the stiffness of boring bar is getting insufficient to support the tool and causes a hole deviation during process. The non-homogeneity of material and vibration during boring also cause this hole deviation which results in the degradation of product quality. Usually, boring is conducted by rotating the workpiece (stationary tool
3
and rotating workpiece together) to avoid hole deviation. Unfortunately, this process is limited to symmetric workpiece only. When the shape of workpiece is asymmetric, this process only could be done by rotating the tool (stationary workpiece and rotating tool system), but it could also causes deviation because the tool will move forward to thin or weak point of workpiece material. It also causes the degradation of hole precision.
1.3 Problem statement
The main problem of surface parameter measurement in unreachable hole or in another word we name it as deep-hole is that there is no conventional hole parameter measurement tools. One of the existing tools can measure open surface by using laser beam reflection technique on the surface area. Some other existing machines can measure inner hole shapes of larger diameter without the application of laser such as Talyrond. Traditional measurement systems do not support in measuring inner deep- hole‟s surface parameters. Another system is used for deep-hole roundness measurement purpose but that is applicable only for a minimum hole diameter of 70 mm. Thus a system is necessary to measure deep-hole having a range of target diameter between 17- 21 mm so that it can be applied for certain types of deep-holes and having a length between 0-800 mm. As the existing system is applicable for a minimum hole diameter of 70 mm; the downsizing of the deep-hole is very useful and will add a new technique in measuring surface roundness.
1.4 Research objectives
This dissertation presents experimental results of measuring hole parameters having small diameter and long length by a measurement unit fixed at the end of a cylindrical long measurement bar. The system consists of a measurement unit in order to scan hole wall; laser interferometer for detecting topography of the hole wall; and optical device at the back for detecting attitude of the measurement unit. As a result of experimental analysis, it is observed that deep-hole having less than 20 mm-diameter and long-length about 0-800 mm can be measured by the new developed measurement system.
Measurement in machining process is vital in order to acquire target outputs from the
4
manufactured machine parts. In addition, the measurement of hole surface parameters and its monitoring system during measurement is also very important. The monitoring system works as feed-back control system for the complete process. The system for this measurement consists of a laser interferometer, measurement head, laser diode, CCD cameras; and optical devices such as pentaprism, corner cube prism as well as display monitors for the CPU, CCD camera and data measured by the laser interferometer. The measurement performance is monitored by the display monitors and graphs plotted by the acquired experimental data as elaborated later in this research.
Currently, deep-hole in various mechanical parts has been made in the manufacturing industries. Among them, large rotational shaft; aircraft jet engine; the cylinder liners for large marine engines and Shinkansen; power generation turbine rotor;
the generator , and centrifugal casting mold where there exist deep-holes . For the measurement of the hole, the instrument such as cylinder gauge and roundness measuring machine is generally used, but application is very difficult as commercially available tools has restrictions on size, in case of deep-hole; problem such as thermal deformation, and the size of the instrument while maintaining high measurement accuracy is also difficult. Therefore, in case of drilling; deep hole actually measuring the thickness from the outer surface by using an ultrasonic instrument, and estimates that the shape of the hole. This method is simple; the measurement accuracy is not good because of the environmental disturbance compare to the new developed system by which it can be measured reasonably and accurately the shape of the deep-holes.
1.5 Research methodology
To solve this problem in deep-hole measurement, a combination of laser interferometer, optical components such as pentaprism, corner cube prism, PSD sensor; laser diode, CCD camera based integrated system is designed and developed. Optical components are used in order to keep the axis on its correct axis during measurement specially for rear probe attitude. PSD sensor is used in order to set the workpiece axis. Laser interferometer gives the data for roundness and 3D spiral shape of the inner holes. To scan the deep-hole‟s wall the probe‟s head must rotate during measurement to scan the
5
hole wall continuously. DC motor is used to control the measurement head‟s rotational speed. A hall element or rotation detection sensor is used to get the accurate sampling data by detecting and recording the data for each rotation in complete measurement. A servo motor is used to feed the workpeice which is set on the table.
1.6 Research scope
The dissertation also presents computational results of deep-holes evaluated by a measurement unit fixed at the end of a cylindrical long measurement bar. The measurement unit which is fixed at the end of the measurement bar and positioned along a hole center is supported by a pair of skids. As a result of computational analysis, it is found that deep-hole between 0 to 800 mm-length and 18 mm-diameter can be measured by the measurement unit with the cylindrical long measurement bar. The measuring depth can be increased by extending the long measurement bar.
1.7 Thesis organization
Chapter 2 discussed background studies of the similar system. New developed measurement system is described in Chapter 3. Chapter 4 elaborates experimental methods of roundness measurement. Finally, the result of this research is discussed in chapter 5. Chapter 6 summarizes the results of this research and suggests for future works.
6
CHAPTER 2
BACKGROUND STUDY 2.1 Introduction
Deep-holes are bored with the meter, millimeter, and micrometer level diameters in engineering. Their lengths can be as large as several tens of meters to as short as a few micrometers. Examples of holes with large 100 millimeter level diameters and meter level lengths are the rotation shafts of jet engines, generators, and high-speed trains; the large cylinder used in plastic injection molding; the cylindrical liners of ship engines and cannons. Holes with normal 10 millimeter level diameters and lengths of several hundred millimeters are used for the main spindles of machines, the small cylinder in plastic injection molding, the tube sheet for heat exchanger and guns. Accurate measurement of the diameter, roundness, cylindricity, and straightness of a deep-hole is essential for improving the performance of products. However, existing systems have drawbacks to precisely measure holes with large length to diameter ratios that require multiple measurement devices. In order to accurately evaluate the parameters of such deep-holes with 100-millimeter-level diameters and meter-level lengths, using a single device, a laser-guided deep-hole evaluation probe was developed [1-6].
It is very important to monitor the mechanical behavior of precision measurement system in manufacturing devices. The monitoring system has the advantages such as compare simple structure, high precision, low price and great expandability, which has huge application potentiality for the manufactured components. With the goal of developing more effective nuclear weapon, new instruments that brought greater accuracy to measurements of dimensions, shapes, densities, and surface finishes than the existing instruments is developed. A manufacturing process for machining and finishing which is more precise than anything commercially available is proposed [7]. The science of measurement (known as metrology) and precision engineering is necessary to produce new parts, because without the ability to measure a dimension or other quantity, one can never know whether a given level of precision has been achieved. As measuring
7
capabilities improved, components for industrial applications are designed to tighter tolerances, leading to an increased emphasis on precision manufacturing.
Metrology tools have varieties of applications. The most obvious is to measure shape errors in the part being produced. But they also can measure the errors arising in the equipment used to manufacture the part, a practice known as machine tool metrology.
And they are often used to measure a process such as characterization of a grinding wheel. Precision engineering requires, among other things, a systematic approach to determine dimensional errors. When measurements are made, precision engineering requires a quantitative assessment of the total uncertainty of the measurement. A few breakthrough technologies, such as the laser interferometer, optical devices, cameras and the personal computer have revolutionized the machine design procedure while most advances in precision engineering today are incremental [8].
Xpress probes are designed for high accuracy dimensional measurements on a wide range of components [9]. Whereas the Gannen XP probe is designed for ultimate precision, the Gannen XM and Heimen probes are designed for high precision measurements on miniaturized parts. These include micro holes with a diameter in the region of several tens of micrometers, micro trenches, e.g. for micro-fluidics, freeform surfaces, etc. [9]. Leading technology in ultra-precision metrology components, systems and machines are also designed [10]. Accuracy and precision can be defined as follows;
the accuracy of the measurement refers to how close the measured value is to the true or accepted value; on the other hand precision refers to how close together a group of measurement actually are to each other. Precision has nothing to do with the true or accepted value of a measurement, so it is quite possible to be very precise and totally inaccurate [11].
The application of laser in measurement is increasing day by day. Isara (IBS Precision Engineering) is an ultra-precision Coordinate Measuring Machine (CMM) that is now available in the market; it comprises a moving product table and a metrology frame with thermal shielding on which three laser sources are mounted [12]. Multi-probe measurement system also plays vital role in micro machining in recent years. The results from the pre-experiment verify that the multi-probe measurement method performs the
8
yaw and straightness motion error measurement extremely well. Comparisons with the simulation results demonstrate that the multi-probe measurement method can also measure the reference bar mirror profile with a small standard deviation of 10 nm [13].
The measurement and monitoring framework mainly has three purposes:
To provide evidence of how well the approved measurement system is meeting the requirements.
To improve measurement system by applying the most efficient method.
To determine how well the complete measurement system is being followed.
Automatic measurement system in order to measure a mechanical tool or workpiece is not widely used. It is essential to accurately measure the surface parameters of a hole for applications such as the rotation shafts of a jet engine, generator and high-speed train; the cylinder used in plastic injection molding; and the cylinder liner of a ship engine. Available system has disadvantages in precise measurement of the hole with large length to diameter ratio, in which different measurement devices are required separately. To evaluate the accuracies of such deep-holes using a single device, a laser- guided deep-hole evaluation probe is necessary. In some other studies, expensive piezoelectric actuators are used to control attitude of the measurement probe [14]. It is still difficult to measure the accuracy of holes with depths in the order of a few meters and with diameters varying in the order of a few millimeters.
Deep-hole with 3m-length and 63mm-diameter was measured by the measurement unit with the cylindrical long measurement bar [17]. In our past study [16], measurement unit which can measure holes with a diameter of 70 to 168 mm was developed and discussed. In the piezoelectric actuator stroke is 0.35mm, allowable load is 16kg and fast speed response. Piezoelectric actuator is also introduced in self-sensing measurement for micro manipulator and micro assembly context [15]. The improvement of control strategy in measuring high performance laser guided deep-hole tool has been elaborated in details. Control strategy for the attitude control is also discussed [18]. The objective of the current study is to design laser-guided probe to satisfy the following two conditions:
9
To downsize deep-hole measurement probe with the range of diameters between 17-21 mm and lengths between 0-800 mm.
Deep-hole‟s roundness, inner shape and rear probe‟s attitude measurement during experiment.
2.2 Surface roughness measurement system
Surface roughness measurement system has various techniques. Some are contact base and some are non-contact base. Some have larger hole-diameter and long-length and some are vice-versa.
2.2.1 Measurement probe with various measurement units
To evaluate the accuracies of such deep-holes using a single device, a laser-guided deep- hole evaluation probe is developed as in Fig. 2.1. The attitude (position and inclination) of the probe is controlled as if it is on the right measurement axes as shown in Fig. 2.2.
A measurement unit rotates and its stylus scans the hole wall. The movement of the stylus is detected by a laser interferometer located in front of the probe. It is still difficult to measure the accuracy of deep-holes in the order of a few meters and with diameters varying in the order of a few millimeters, such as the rotating shaft holes of jet engines and high-speed-trains. In this case, different measurement devices are required separately for measuring hole accuracy. An investigation on the correlation between surface topography and its mechanical properties measured by a novel multi-function Tribological Probe Microscope (TPM) at the micro/ nanometre level is discussed in this research [19]. A scanning multi-probe system for measuring straightness profiles of cylinder workpieces is discussed [20]. The system consists of two probe-units, each having three displacement probes. The two probe-units that are placed on the two sides of the test cylinder, are moved by a scanning stage to scan the two opposed straightness profiles of the cylinder simultaneously by this system.
10
Fig. 2. 1 Laser guided deep-hole measurement probe
2.2.2 Working principle of previous measurement system for larger holes
Fig. 2. 2 Fundamental structure of deep-hole measurement probe
Conventional lathe is used for the above experiment. One end of measurement bar is fixed by a collet chuck and the other end supported by a pair of skids behind the measurement unit [6]. In that measurement system, the laser diode is placed on measurement axis which is a center line of the spindle of headstock. Attitude of measurement unit can be accurately detected. On the other hand, in the measurement system described in [6, 19], a laser diode is fixed on the measurement probe apart from the measurement axis. Therefore rotational deviation of the laser diode due to the rolling of the measurement probe affected detection accuracy of the probe the probe attitude [22].
11
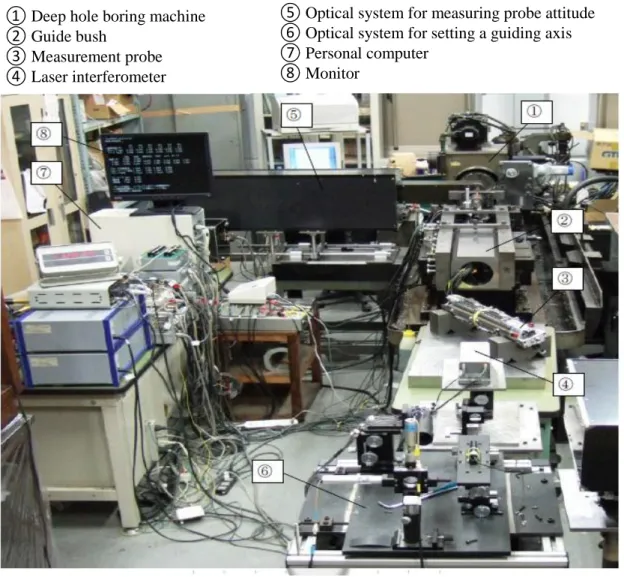
Fig. 2. 3 Overview of the measurement system
The integrated system`s working principles and the necessary commands for the programs are shown below in details. The flow charts are drawn to clarify the processes.
Figure 2.3 shows a complete experimental apparatus for measuring a larger hole profiles. The apparatus descriptions are given above Fig 2.3.
This dissertation also presents a distance measurement method based on pixel number variation of CCD images by referencing to two arbitrarily designated points in the image frames. By establishing a relationship between the displacement of the camera movement along the photographing direction and the difference in pixel count between reference points in the images, the distance from an object can be calculated via the
① Deep hole boring machine
② Guide bush
③ Measurement probe
④ Laser interferometer
⑤ Optical system for measuring probe attitude
⑥ Optical system for setting a guiding axis
⑦ Personal computer
⑧ Monitor
12
proposed method. To integrate the measuring functions into digital cameras, a circuit design implementing the proposed measuring system in selecting reference points, measuring distance, and displaying measurement results on CCD panel of the digital camera is proposed in this paper. In comparison to pattern recognition or image analysis methods, the proposed measuring approach is simple and straightforward for practical implementation into digital cameras. To validate the performance of the proposed method, measurement results using the proposed method and ultrasonic rangefinders are also presented in this paper [23].
2.3 Roundness error evaluation technique
Theoretical error was conducted for on-machine measurements of roundness profiles based on the assessment of radial variations in [21]. Another new method for roundness error evaluation using polar coordinate system, named as Polar Coordinate Transform Algorithm (PCTA), is presented in this paper. The algorithm first allocates a circular region around the least square circle center following certain rules, then calculates the polar radius for all measured points by translating polar coordinate system to each point in the region in turn, and finally obtains minimum circumscribed center point, maximum inscribed center point and minimum zone center point from comparing each polar radius relative to each polar coordinate system. With accurate center point, the algorithm could give more accurate roundness evaluation. In that paper, the process of PCTA is described in detail including geometrical dimensions. Theoretical calculation and testing results show that PCTA can evaluate roundness error effectively and accurately [24].
Another research work presents a new architecture of a roundness measuring system in which the roundness measuring accuracy is not dependent on motion accuracy of the rotary element. In this architecture, the influence of motion errors on roundness measurement is minimized by applying a new error separation technique, the Improved Reversal Method (IRM). A prototype that uses: a rotary table supported by ball bearings, non-contact gap sensors and a computer system that collects and process sensor readings has been developed. Experimental results have shown that even using a rotary table supported by ball bearings that has non-repetitive motion errors larger than 2mm, the
13
final measurement repeatability is better than 0.3mm of peak-to-peak value. In order to ensure the same levels of accuracy of the proposed system, a traditional roundness measuring system design must use a more precise and therefore more expensive type of bearing with a motion error no larger than 0.1mm [25].
2.4 Three point roundness measurement
This research [26] presents two enhancements to three-point method for roundness measurement. They enable measuring a larger bandwidth and also present a logical progression from two-point profile to three-point roundness measurement using the combined method. Simulated profiles with and without step variations are used to demonstrate these improvements [26]. A novel time-domain method, which can reconstruct straightness profile of workpiece exactly for on-machine measurement, has successfully been developed. The proposed method is based on difference measurement and can use two or three displacement probes [27].
2.5 Non-contact based roundness measurement
A new in-process and non-contact probe is proposed to measure the diameter and the roundness of turned workpieces as shown in [28]. The initial probe discussed in previous publications exhibited diameter measurements with good accuracy (uncertainty 5 µm over 100 mm). This paper discusses the implementation of roundness measurement into the initial probe and its performance. The principle of the roundness measurement is based on the relationship between the displacement and the light intensity. The probe delivers a maximum error of 0.5 µm with an uncertainty of 1 µm for roundness measurement over a range of 100 mm diameter [28].
A gear surface measurement system is highlighted by camera [33]. A simplified drawing of the optical stylus and its detection system is shown in [34]. It operates with an optical head incorporating a 780 nm wavelength semiconductor laser, yielding a measurement spot size of 1 µm diameter and a height sensitivity of 0.03 µm. A critical comparison between an optical laser stylus measurement system and a Talystep mechanical stylus profilometer is discussed. Sixteen surfaces having root mean square
14
roughness from 0.002 µm to 3 µm for cut-off lengths less than 0.8 mm have been used in that study. The quality of surfaces is obtained by the utilization of scattered laser light examined by a neural network and extracted features from the scattered angular spectrum that are then used as inputs to a hierarchical neural network as presented in [34].
2.6 Surface measurement applied optical instruments
In [35], the laser light is attenuated by a polarizer to ensure that the detector is not saturated. The concave mirror focuses the light to a spot approximately 0.5 mm in diameter. The scattered light is collected over an angle of approximately 25.6 degrees by the Plano -convex lens. The line array camera has 256 pixels [35].
2.7 Laser based macrostructure measurement
A laser based device for pavement macrotexture measurement is presented in [36]. In this study, a practical laser device was developed, which is lightweight and portable with low cost. Pavement surface macrotexture greatly contributes to tire-pavement skid resistance which has a direct effect on traffic operation and safety particularly at high speeds. Therefore, a strong motivation is necessary to develop effective and practical devices to measure macrotexture profile.
As described in [36], a system designed where a laser is projected onto a rough surface it will be scattered by its microscopic surface irregularities. The layer of the surface, caused by the direction of machining, determines the general light scattering pattern. A surface is perceived as changing from smooth or mirror-like to rough or diffuse when the surface roughness increases. A smooth surface scatters light mainly in a specular direction [37]. A novel method of profile measurement for reflective surface based on optical feedback is proposed in this paper [38]. With so-called self-mixing structure, a fraction of the light emitted from a laser diode (LD) is reflected back by the target under test and returns the laser cavity and changes the operation mode of this LD.
15
A laser-based measurement system for evaluation of the scraping workpiece quality that can eliminate contact-induced measurement errors and increase measurement accuracy is proposed [39]. The laser-based measurement system consists of a light- scattering-type triangulation laser, a Computer Numerical Control (CNC) machine tool, and an analog-to-digital (A/D) converter. The triangulation laser measures the depth of the scraping spots and the CNC machine tool locates their position [40].
2.8 Measurement system based on confocal laser scanning microscope
An experimental study of the roughness analyses for the flat and spherical surfaces of machined metal in order to compare the roughness data taken from the cloud data produced by the stylus type profilometer and two optical based measurement instruments, namely the infinite focus microscope and the confocal laser scanning microscope is presented [41]. The scattered light pattern reflected from a machined surface generally contains much information concerning the surface roughness. This study examines and proposes a surface roughness measurement technique for the on- machine measurement of the roughness of machined surfaces. The technique is based on the measurement of scattered light patterns and the statistical analysis of the light intensity distribution [43].Another study showed that the 3D point cloud data contains a wealth of information typically not available. The surface roughness measurements can be made across the entire image to generate a surface roughness map. Joint characteristics such as surface roughness anisotropy can be evaluated efficiently [44].
2.9 Summary
As a summary, it can be said that this chapter extensively discussed some important surface measurement techniques or methods that have been used in precision measurement. Mainly it highlights the implemented previous methods applying laser and optical instruments.
16
CHAPTER 3
MEASUREMENT SYSTEM COMPONENTS
3.1 Measurement system
The integrated measurement system consists of several individual parts. Some parts are complex in design in order it to be fixed with others. Some others are very small and thin; precise manufacturing is depends upon proper design of the parts.
3.2 Design of measurement unit
Design of measurement unit or measurement head is very crucial in conjunction with integrated measurement system. The important steps of the probe design and the system components are briefly discussed below.
3.3 Pentaprism
Figure 3.1 shows a pentaprism which has been designed in order to fix with the measurement head to work with laser beam and corner cube prism. Its working method is described later in this chapter.
Fig. 3. 1 Pentaprism for the measurement head
17
Figure 3.2 shows the complete assembly drawing of the measurement unit. Important components of this unit are shown in this figure. All components are very important for the system. In front of the measurement unit laser beam is radiated which reflects to the pentaprism and deflects to the corner cube-prism, finally the deflected beam returns to the interferometer through pentaprism and gives the reading of the beam in terms of distance in mm.
Fig. 3. 2 Combined assembly design of the measurement head
Fig. 3. 3 Measurement head checking
Pentaprism Corner cube prism
Probe‟s head
18
Figure 3.3 shows the probe with measurement unit attached to it where pentaprism, corner cube prism and stylus are connected together.
3.4 Integrated optical components
The working principles of the optical components are described below.
3.4.1 Pentaprism and its working principle
Fig. 3. 4 Pentaprim and its working principle
Figure 3.4 shows the pentaprism which is a five-sided reflecting prism. This is integrated with the measurement head so that it can divert the laser beam by a constant angle of 90° even if the entry beam is not at 90° to the prism. The beam reflects inside the prism twice, allowing the transmission of an image through a right angle without inverting it as a normal right-angle prism or mirror. The reflections inside the prism are not caused by total internal reflection, since the beams are incident at an angle less than the critical angle (the minimum angle for total internal reflection). Instead, the two faces are coated to provide mirror surfaces. The two opposite transmitting faces are often coated with an antireflection coating to reduce spurious reflections. The fifth face of the prism is not used optically but truncates that; otherwise it would be an awkward angle joining the two mirrored faces.
19
Fig. 3. 5 The reflection principle of pentaprism
Figure 3.5 explains geometrically that even if the light incidents at any angle; it has the property of emitting by bending the return beam exactly 90°. Table 3.1 shows the specifications of the integrated pentaprism.
Table 3. 1: Pentaprism specification (Sigma Koki.co.jp)
3.4.2 Corner-cube prism and its working principle
Figure 3.6 shows a corner cube prism which is used as a retroreflector consisting of three mutually perpendicular, intersecting flat surfaces, which reflects waves back directly towards the source, but shifted (translated). The three intersecting surfaces often have square shapes. For this reason, metal made radar corner reflectors are used to reflect radio waves from radar sets.
20
Fig. 3. 6 Corner cube prism and its working principle
Corner cubes, made of three-sided glass prisms are used in surveying and laser range finding purposes. The term is also used for a corner reflector antenna, consisting of two flat metal surfaces at a right angle, with a dipole antenna in front of them. In this research, we used this component for laser range finding purpose.
3.5 Laser system
Laser system mainly consists of two parts; laser interferometer and laser diode. Below the working method of laser system is described with figures.
3.5.1 Laser beam radiation and reflection
Fig. 3. 7 State of the working laser interferometer
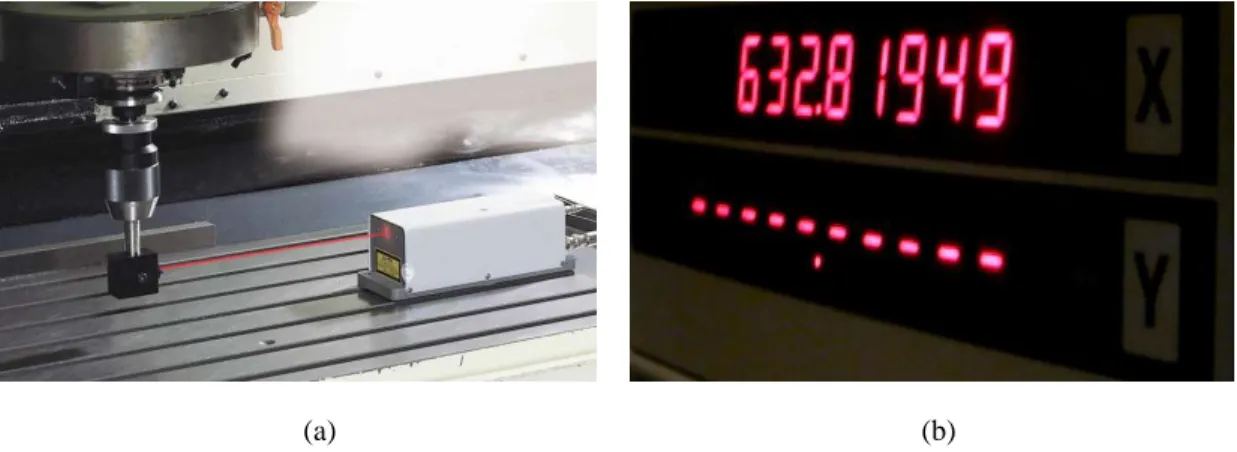
Figure 3.7 shows the correct state of the laser interferometer during experiments. The laser beam must return to the interferometer through the same path after reflecting at
21
pentaprism via corner cube prism in order to acquire correct measurement data from the laser interferometer.
Figure 3.8 (a) shows the correct state of the laser interferometer during measurement while possible error state is shown in Fig. 3.8 (b). Green spot is indicated as an error state in this experiment. Before proceeding with the experiment; the laser beam must be corrected to acquire correct measurement data.
(a) (b)
Fig. 3. 8 (a) A correct laser beam radiation; (b) an error occurred during laser beam radiation
3.5.2 Laser interferometer’s output
Figure 3.9 (a) is an example of application of laser beam in manufacturing industries.
(a) (b)
Fig. 3. 9 (a) An active laser interferometer during manufacturing process; (b) an example of correct laser beam radiation before measurement
22
The laser interferometer radiates laser beam to the target distance as shown in this figure. Figure 3.9 (b) shows an idle state of the laser interferometer where the laser beam is found to be stable. On the other hand, Fig 3.10 (a) shows the measurement value during experiment where „A‟ denotes generated alarm during measurement and the doted red bar denotes the stability of the data. During alarm generation in measurement; correct data is possible to acquire until the minimum 5 red doted bars are visible and stable. The data will generate errors if the doted bars go below 5 during experiment. Figure 3.10 (b) shows a resetting condition of the laser interferometer before the experiment started. Initial value denoting „-‟ and „+‟ do not affect the acquired results at all. Table 3.2 shows the specifications for laser interferometer below. This interferometer needs to warm-up about 30 minutes in order to acquire correct experimental data.
(a) (b)
Fig. 3. 10 (a) An example of active measurement while generates alarm in monitor; (b) Laser interferometer monitor after resetting the button
23
Table 3. 2 : Laser specification
3.5.3 Basic laser beam testing
Fig. 3. 11 Laser and optical error checking
Figure 3.11 shows the optical components for laser beam experiment which was set up in order to justify the workability of the 2 mm laser diode, small pentaprism, small corner cube prism and laser interferometer display monitor. The names of the components are shown top-left corner of this figure. Laser beam radiates from the laser
24
interferometer and it reflects to the pentaprism. Finally; the reflected beam from pentaprism and deflected beam from corner cube prism returns to laser interferometer through pentaprism.
3.6 Front axis setting by PSD sensor
In Fig. 3.12 a double-sided split-type two-dimensional PSD sensor is shown (manufactured by Hamamatsu Photonics, S1300). Table 3.3 shows the specifications for this PSD sensor.
Fig. 3. 12 PSD sensor for front axis setting
Laser optical axis adjustment is shown in Fig. 3.13. First the PSD sensor is set inside the fixture (1) on the workpiece table. Then the fixture is placed to the workpiece in order to keep the axis on correct alignment. The PSD sensor cable is connected to the A/D converter; and A/D converter is connected to the computer. When the optical axis program starts, PSD sensor‟s coordinate data from the laser beam is displayed in the computer monitor. Position (2) is the rear fixture position of the PSD sensor. Both the x
25
and y coordinate values of front side and rear side have to be very close to each other in order to make sure that the laser spot is always on the center of the workpeice.
Table 3. 3 : Specifications of PSD sensor
Fixture Fixture for PSD PSD Laser diode y z
x
(2) (1)
Table feed
Fig. 3. 13 Adjustment of the position and slope of laser optical axis
Laser interferometer‟s adjusting directions
26
The setting is time consuming but once if it is set then there is no problem to continue the experiment until the laser axis or workpiece axis is changed from its initial setting.
3.7 Setting main axis
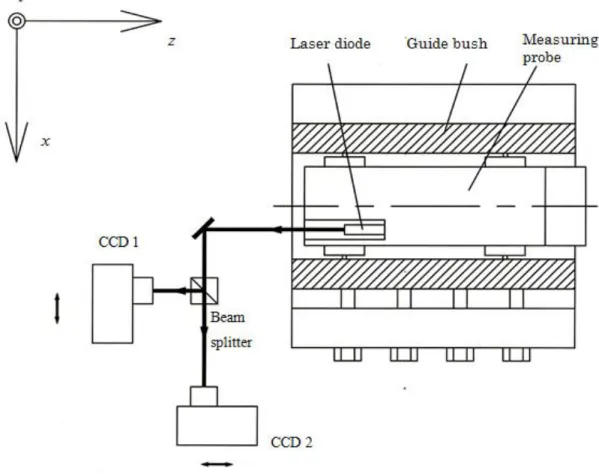
A semi conductor laser diode is positioned in front of the workpice in order to set the main axis of the measurement table as well as workpiece. The laser beam is radiated from the laser diode and it reflects from the mirror and travel back to the beam splitter where PSD1 and PSD2 are initially set. PSD1 and PSD2 are connected to the A/D converter and the data of the mirror position is displayed on the computer monitor in terms of (x, y) coordinate values. The PSD data acquiring program must be run at the same time when the laser interferometer switched is on and mirror is placed in front of the workpeice on the measurement table. If the primary data is not acceptable then the laser diode must be moved and inclined to the correct position and angle. By this method; the front and the rear side of the workpiece is set to the correct axis initially. Repeating this process, we will get the desire values of the coordinate data; thus based on the (x, y) values it can be decided whether the measurement should start or not.
27 3.8 Complete system setting
Fig. 3. 14 Overview of the measurement system
General overview of the optical instrument setting with other main components is shown in Fig. 3.14. Experimental apparatus setting is shown in details in this figure indicating internal components.
3.9 Rear axis setting
Rear CCD camera positioning is shown in Fig. 3.15. In order to set the position of the CCD posture for the optical system; laser beam from the rear side of the workpiece is
(1)Fixture (6) Laser interferometer (11) Mirror
(2) Guide bush (7) Beam splitter (12) CCD 1
(3) Measuring probe (8) Laser diode (13) CCD 2
(4) Measuring head (9) PSD 1
(5) Laser diode (10) PSD 2
The optical system for measuring probe attitude
The optical system for setting the guiding axis
z y
( 8 ) (7)
( 1 0 ) (10) (
1 2 ) ( 1 3 ) y
(6)
(7) (4)
(3) (5)
(1)
(9) (8)
(2) (12)
(13)
(11) (9)
y z z
(1) (2)
28
radiated. Two mirrors are installed in the optical system to adjust the position of the CCD cameras in order to know the positions of the cameras from the radiated laser beam spot to determine the center.
Fig. 3. 15 Positioning of the rear CCD camera
The positioning of the rear CCD cameras is shown in the figure above. First; it is necessary to run the attitude control program; then the displayed value is considered as the initial value of the CCD camera. If the center of the CCD camera deviates from its original axes then the camera is set by looking at the display spot of the laser beam in the computer monitor and compare with the values to confirm that the CCD cameras are on the right axes. The procedure should be repeated until the display spot and the shown numerical values are acceptable. The numerical acceptable values are in µm level.
Performing attitude control of the measurement probe on the basis of the initial value is
29
required in order to keep the rear attitude on its center axis at all times during measurement.
3.10 Rear CCD camera
Fig. 3. 16 CCD camera (Lu 125)
Table 3. 4 : CCD camera specification (Lu 125)
Figure 3.16 shows the integrated CCD camera and its model name is Lu125. Camera specifications are shown in Table 3.4. The camera has resolution in µm level.
3.11 Rear CCD camera spot detection
30
(a) (b)
Fig. 3. 17 Laser spots on computer monitor from (a) CCD1 and (b) CCD2 cameras
Figure 3.17 (a) and (b) show the spots of the laser beam from the rear laser diode to the CCD cameras.
(a) (b)
Fig. 3. 18 (a) CCD camera shows the spot position in terms of „X‟ and „Y‟ axes; (b) rear measurement deviation result recorded by CCD cameras
These spots can be viewed on the computer monitor and it is necessary to adjust the spots on the camera and the checking must be carried out before the measurement starts.
If the initial position deviates from the center; the center should be corrected first.
Figure 3.18 (a) shows CCD camera initial position in the direction of „X‟ and „Y‟ axes.
Final measurement data can be compared with the initial value which is shown on the monitor. Figure 3.18 (b) shows rear position of the long measurement bar during
31
experiment. The figures are drawn in terms of deviation and rotation angle of rear side of the measurement bar.
3.12 Summary
This chapter elaborates the experimental components and their applications in measuring small diameter based deep-holes. It gives an extensive explanation of the system components from very close view which clarifies and makes the system easy to understand and thus; easy to implement in industries.
32
CHAPTER 4
WORKING PRINCIPLES OF ROUNDNESS MEASUREMENT 4.1 Introduction
The principle of roundness measurement is based on the fact that the light intensity varies with respect to the displacement from the reflective object. The deviation between the actual radius at each point around its circumference and the measured radius is called out-of-roundness (OOR).The displacement between the probe and the rotating workpiece may change according to the OOR of the workpiece, the error of the rotational system, and the radial displacement of the workpiece. The variation of the displacement causes variation of the light intensities reflected from the rotating workpiece. The OOR of the rotating workpiece can be defined by analyzing the variation of the light intensities. The developed probe configured for diameter measurement can be easily reconfigured to measure the OOR of the rotating workpiece by blocking only one laser beam. All components in the probe configured for roundness measurement remain the same as those configured for radius measurement. In diameter measurement, two laser beams are produced. In roundness measurement, one laser beam is blocked before reaching the focusing lens. A blockage can be placed between the beam splitter and the focusing lens. The laser beam is directed to the workpiece surface. The receiving lens collects the scattered lights and focuses them to the photodiode. The intensities of the scattered lights are converted to an electrical signal by the photodiode. The electrical signal from the photodiode is sent to an amplifier circuit to eliminate unwanted noise and prepare the signal to match the input requirement of the Data Acquisition (DAQ) system. The signal from the amplifier circuit is sent to the computer with LabView environment and processed to extract the OOR of the rotating workpiece as in [28].
In another study [29], the combined method, which combines the generalized 2- point method with the inclination method, has been developed to measure profiles that include high-frequency components whose spatial wavelengths are shorter than the probe interval. It is suitable for measuring discontinuous profiles that include step-wise
33
variations and abrupt changes. In the above mentioned research, the influence of the setting error of the probe interval is discussed specially when it is used the combined method to measure a step-wise profile. Results of theoretical analyses show that these errors cause the same kind of evaluation errors in the profile measured with the combined method; and large profile evaluation errors are caused by the edge part of a step-wise profile. The value of the profile evaluation error is concerned with the aperture size of the displacement probe and the height of the step-wise profile. The influence of the gain errors of the probe is also investigated. An automatic selection method that can select the standard area properly and quickly is developed to improve the accuracy of the combined method. A machined surface with a stepwise profile is measured by using two capacitance-type displacement probes. Experimental results that confirm the effectiveness of the combined method are also presented [29].
In another article [30], the authors described a new differential method for on- machine roundness measurement of cylindrical workpieces, which is called the combined three-point method. This method combines the advantages of the generalized three-point method and the sequential three-point method and can accurately measure roundness profiles including step-wise variations. In the combined three point method, some data points in the roundness profile evaluated by the generalized three-point method are chosen as the reference points of the standard area and used to determine the relationships among the data groups of the sequential three-point method. An interpolation technique is employed in the data processing of the generalized three-point method to improve the accuracy of the standard area. Theoretical analyses and computer simulations confirming the feasibility of the combined three-point method are shown in this paper. A roundness measurement system using three capacitance-type displacement probe is constructed. The measurement system and the experimental results are also presented in [30].
Other researchers presented a novel algorithm for evaluating roundness from discrete coordinate data measured by a Coordinate Measuring Machine (CMM) [31].
The main feature of this algorithm is the concept and quantification of profile confidence
34
level, which is used to reduce the uncertainty associated with fitting the sampled data points in the determination of the roundness zone. This algorithm starts by characterizing the deterministic profile of a circular feature. After the deterministic profile is obtained, the normally distributed fitted residuals are available and regarded as random errors. With the established random errors, the roundness zone corresponding to a satisfactory profile confidence level can be determined. Extensive experimental data analysis has been carried out to validate the unique advantage of the present algorithm: if the circular deterministic profile is characterized correctly, the evaluated roundness values are consistent under different sample sizes and/or sampling locations. Also, these consistent roundness values are very close to the minimum-zone solution of a large sample size, which often provides a good approximation to the true roundness value.
The applied algorithm for the above mentioned research is thus very useful and able to reliably evaluate roundness with a relatively small number of data points [31].
A real time monitoring and diagnosis system to measure spindle center displacement (roundness error) during turning operation is introduced in this research [32]. The system was developed based on the three-point method. The error generated during cutting process was monitored and diagnosed by using a system equipped with a designed DSP Digital Signal Processor (DSP) board and Fast Fourier Transform (FFT) algorithm. The system could estimate cutting force and predict other cutting characteristics such as chattering and tool wear. Using the spindle center fluctuation, i.e.
a roundness error movement from the center, the relationship between the cutting force and the roundness error could also be investigated. The roundness error that eliminated geometric shape error and eccentric error from the measured signals in the frequency domain proved to be a dominating factor in determining cutting characteristics [32].
4.2 Working principle of laser interferometer
Figure 4.1 shows the flow chart of the front axis setting program. The front axis of the measurement probe setting is very important before the measurement is conducted. For
35
this axis setting; laser beam is radiated from the laser interferometer and reflects to the PSD sensor. The main notations that are used for the main program are q = quit; m = measurement; c = control attitude.
Fig. 4. 1 Axis setting for laser interferometer
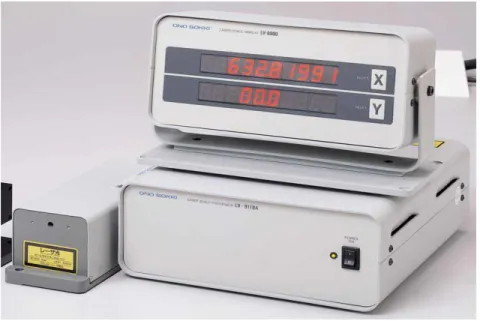
36 4.2.1 Laser interferometer and its function
Figure 4.2 shows the complete set of laser interferometer for measurement. This consists of a laser beam radiator, a display monitor and data converter from analog to digital (A/D). The measurement data usually need to reset before starting to record the data. Before recording data; reset is necessary for the laser interferometer in order to start with the initial value.
Fig. 4. 2 A set of complete laser interferometer
4.2.2 Experimental procedure using laser interferometer
Fig. 4. 3 Shape of the workpiece
Diameter = 18 mm