JAIST Repository
https://dspace.jaist.ac.jp/
Title
Cooperation and Coevolution : Analysis of ICT
industry between China and Japan
Author(s)
高, 昂; 渡辺, 千仭
Citation
年次学術大会講演要旨集, 18: 662-665
Issue Date
2003-11-07
Type
Conference Paper
Text version
publisher
URL
http://hdl.handle.net/10119/6977
Rights
本著作物は研究・技術計画学会の許可のもとに掲載す
るものです。This material is posted here with
permission of the Japan Society for Science
Policy and Research Management.
2E12
COOpera
は Onand COeVolUtlon
一 Anal ノ 3 ゴ・ So Ⅰ J 「 「 T 血 dlIff は y betWeee 丘 C 方伯 a れ Ⅱ d 血 P 丑丘
0 富 民,渡辺千個 ( 東工大社会理工学 )
Ⅰー
n s
lellc
︶
ee
Ⅱ
O1
eh
dnOpO
Ⅰ
,
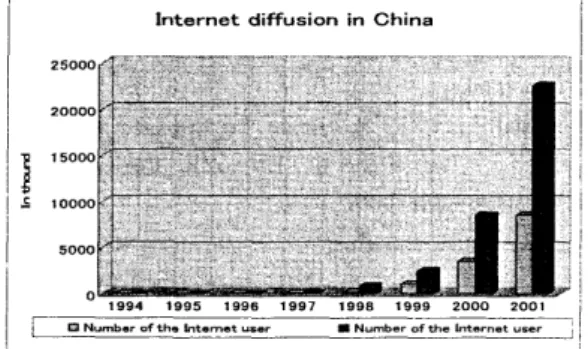
Fig , l ・ Internet@ diffusion@ in@ China
Source:@ CNNIC@ Report@ (2001)
country's@ New@ Economy@ as@ demonstrated@ i Fig.1.which@ shows@ China7S@ dramatc
Internet@ diffusion@ in@ China
Comparng@ the@ ICT@ i dustry@ of@ the@ two
co し ntrles (see table l ㍉ we can d ァ aw the
conclusion@ that@ measured@ by@ the@ share@ in total@ GDP,@ the@ sustainable@ power@ dl fers between@ the@ two@ countres@ depend@ on@ the
technology@ level ・ China , s@ ICT@ industry@ is
developing@ rapidly@ but@ its@ bottleneck@ is@ low level@ of@ technology , While@ Japan@ has@ high
l vo@ of@ ICT@ but@ @@ suffers@ economi
stagnaton@due@to@de Ⅰ aton ・ In@the@same@tme
C Ⅱ na@ has@ a@ l rge@ domestc@ market@ in@ a@ Cass
by@ i sel ・ From@ these@ facts,@ @@ @@ Cear@ to@ see
that@ there@ @@ strong@ l terdependence
between@ C Ⅱ na@ and@ Japan , Gi en@ the@ strong
interdependence@ there@ is@ a@ possibility@ of@ a
vi tuous@ cyCe@ between@ the@ two@ countres
Th@@ vi tuous@ cyCe@ leads@ a@ way@ to@ co-
evolution@ between@ China@ and@ Japan
Table Ⅰ Comparison セ o ICT indus も ry
between@ Japan@ and@ China
Yea 「 1995@ 1996@ 1997 1998 1999 2000
Growth rateJapan - 14.2 12.8 8.8 3.5 6.9
(%@ p , a . )@ China 21.2518.7722.01
%@ in@ GDP Japan 7.6 Ⅰ 8.36 9.34 Ⅰ 0.28 Ⅰ 0.71 1 Ⅰ. 42
China@ 0.77 0.78 0.87
Source:@ Japan , s@ Information@ and@ Communication White@ book@ (year@ 2000)
1.2@ Hypothet cal@ View
The@ foregong@ observaton@ prompts@ as@ the
folowi g@ hypotheti G@ Ⅴ ews
(@@ Vi tuous@ cyCe@ leads@ a@ way@ to
co-evo ut on@ between@ C Ⅱ na@ and
(ii) Imprnovemen 七 of Chlna,s ICT @eve@ ls
lnd@spensable for thls v@rtuous cycle. (iii) Effect@ve ut@lzatlon of splllover ICT from コ apan ls lm portant Ⅰ or th@s
lmprovement.
(iv) There Ⅰ ore, lm provlng Chlna's
asSmilaton@ capaci y@ for@ ma Ⅹ mum
utilizati n@ of@ s Ⅰ l@ ver@ ICT@ is
Sgni i ant ・
Ⅰ・ 3 FOCUS Ofthe anal Ⅴ SiS
Given@ the@ above@ hypothetcal@ Ⅴ ews@ are
proving@ China Ⅰ S@ strategic@ opton@ focused
constructng@ a@ vl tuous@ cyCe@ for@ ICT@ and naton's@ devel pment@ can@ be@ ill strated@ as
Fi ・ 2.@ This@ paper@ attempts@ to@ demonstrate
the foregolng hypotheses f0cus on the
asslm Ⅱ a Ⅲ 0n capaclty.
趣
か
Casv@alvtipn I Chma and Japan betwetnl I
Deregula ザ on
A 。 ト " 接 。 。 。 Ⅱ 甲 。 111lon
Fie.2.China,s strategic option
2 AnalytiCal F Ⅱ ameWo ァ k
2. Ⅰ The Dynamism ofTSo
Fig.3.@ shows@ the@ dynami m@ of@ Technol gy
Spillover@ (TSO)@ from@ Japan@ to@ China ・ It@ is
a@ o@ the@ process@ of@ vi tuous@ cyCe@ between
the 七 w o c0un 七 ries. コ口 he flow o テコⅡ SO starts
Ⅰ rom the deve@opment o テ コ apan,s ICT
industry@ by@ investment@ and@ trade@ @@ Ⅰ ows@ to
China,s ICT industry. After assimila 目 on TSO
affects@ China's@ econom@@ development ・ The
poStve@ effect@ not@ on@@ improves@ C Ⅱ na's
asSmilaton@ capaci y@ but@ also@ stmulate
econom@@ i teract on@ between@ the@ two
countLes , By@ exportng@ the@ technologies@ to
Chlna/ enterprlses ln Ⅰ apan also get prof@t
什 om Chlna,s large domestlc market. So
Japan , s@ GDP@ is@ stimulated@ by@ the@ process@ of
TSO@ too , Wi h@ the@ devCopment@of@economy,
enterprlses ln Japan wl@ allocate more Ⅰ unds
to@support@ R&D,@ so@ @@ @@ reasona5e@that@more
and@ more@ new@ technoogy@ will@ be@ invented
In@ th@@ way@ the@ vl tuous@ cyCe@ works
AC Assimilation…apacity
Fig ・ 3.@ Dynamism@ of@ technology@ spillover@ from
Japan@ to@ China
Source:@ Authors , elaboration@ base@ on@ Watanabe@ et@ al (2001)[1]
2.2 One Ⅰ aCto ア lnfIuenCeS aSSIm Ⅱ atIon
capacity ,
Now we focus on relat on of the
technology@ spillover@ faCli ated@ by@ the fo 「 elgn lnveStment and the 「 ate Of
prod し ct@vlty grow に h. Many economlsts
subsc Ⅰ be@ to@ the@ resu@@ that@ local@ fi ms@ may
@ncrease thelr productlvlty by observlng nearby forelgn f@rms or becomlng thelr
suppllers or c し stomers or thro し gh labor
七 urnover as d0mestlc employees move from
forelgn to local f@rms. 3
Empi7cal
analysis
3.1@ The@ effect@of@techno Ⅰ gy@spillover
Fi st let's see the structure of the total
technology@ stock@ of@ ICT@ industry@ in@ China facilitated@ by@ FDI , It@ can@ be@ divided@ in@ to@ two parts , T;@ @@ the@ technology@ stock@ assoCated
T he total も echnology stock faclllCated ・・ by F D I
r@,Z,
円 - 円 T,
wl h@ FDI@ in@one@ i dustry@@@ ICT,@ Ts@@@ the@ resul
of technology spll@over ln who@e ICT @ndustry based@ on@ the@ FDI ・ (see@ Fig.4.)
To@ examine@ the@ external@ effect@ of@ FDI,@ we
何 rst devel0p a pr0d り ctl0n 億 nctlon based on
externali y@ in@ whi h@ FDI@ @@ allowed@ to@ have@ an
impact@ on@ the@ productvi y@ of@ i s@ reC Ⅰ ents@ as
well@ as@ nonreCpients
We@ devel p@ the@ producton@ functon@ for@ the
industry@ i@ in@ the@ ICT@ industry@ based@ on@ the
Cobb-@ Doug@ s@ producti n@ functi n
9,
ニノ,工 ㌣ K ダ 「 , ( 上 )where@ O , denotes@ value-added , / , /and@ A/the servi es@ of@ labor@ and@ capi al@ inputs.@ A,@ scale factors,@ a@ the@ elastci y@ of@ l bor,@ and@ ft@ the elastci y@of@capl al , The@technology@factor@has
three@ possible@ factors@ (C , Watanabe@ and@ B
ASga 「 l, 2002)
(i)T=T , +ZT ,
("i)7 二 T +T 。 (2)
( 而 )7 Ⅰ B タ Ⅳ㍗ r,
In@ the@ (i T=Ti@ +@ ZTs,@ Z@ @@ the@ asSmi@ ti n
capaCty@ and@ can@ be@ measured@ as@ follows
(Watanabe@ et@ al ・ ,2001[l])
Ⅰ打カ o 二 m 宙亡 Ⅰ o 戸 Ke ヨ百め 0o ん and focused on the
@mpact o Ⅰ FDI 0n the rate 0f product@v@ty
9 ト owth by extend the mode@ as Ⅰ ollows:
Alng
二の十の生 lnZ, 十アれ In 托 + タ ln 年十グlnr
十ど Ⅱ 4)It ls dl 什 @cult to make whole naUon data comparlson, especla@ly lnthecaseo Ⅰ acountry
@lke Chlna that ls eXpe Ⅱ enclng rap@d economlc change. So we select the data overthe perl0d
from 1993 t0 1998 ln the 三力 e 戸 Z ん e た / 古ョ f75f/ Ⅰ 日 /
ヨリ ガよ戸 百 o 二 m 日 f/o 戸 He 』Ⅰ め 00 々, In thls case to see
Whether ト DI lnfluences the rate of
prod り ctlvlty he begln w@th the growth
reg Ⅰ ess@on model as speclfled ln Eq. (4) and
then extend the model t0 acc0un 仁 fo Ⅱ fact0rs
0 Ⅰ potentlal @mportance to pr0ductlvlty gr0wth
Here, ん ls deflned ヨ s the percentage of
reglstered cap@tal owned by fo Ⅰ elgn lnvestors
in@industry@/and@
T@is@defined@as@the@average
share off0relgn equlty partlclpat@on across al@ ICT@ i dustLes,@ wei hted@ by@ emp@ yment
share. Table 3 rep0rts the results Ta Ⅰ e@ 2@ Growth@ rate@ regressi ns@ (29@ ICT
Industries , 1993 -1998)
Z,
(3)
In 200l. professor C. Watanabe et al have found the( l ) @n (2) ls the most e 什 lclent mode@ セ o analyze the Japan,s machlnery
lndust Ⅱ y (See the references [2]). But what
ls the case of Chlna's ICT lndustry?
3.2@ Ana ys s@-@ A@ case@ of@ ICT@ industry@ in Shenzhen,@ China
This@case@was@ done@ by@ Zhiqiang@ Liu@ in@ State Un@vers@ty o Ⅰ New York at Bu 丘 a@o, wlth the
method@of@(2)-(M@@ T@=@B@@'T7@T ・ s ・ He@selected
the@ data@ over@the@ pe Ⅰ od@ from@ 1993@ to@ 1998@ i
the@ Shenzhen@ SpeCal@ Econom@@ Zone@ of@ China which@ @@ conSdered@ one@ the@ most@ important areas@of@FDI@and@ R&D@center@of@ICT@@@ C Ⅱ na@ by
uslng the 三ヵ e 戸 z ん e 柁 St 右 t/st7% ヨ 7 日 仰ピ Va 「 lableS 0.103 O.12 0.105 0.0926 0.128 0.523 0.537 0.517 0.506 0.535 Output@ 93 0.0812 O.106 G 「 Owth ダ ate O Ⅰ
nat onal@ sales 0.805 0.959
Public capital 0.156 0.00718
Source:@ Journal@ of@Comparative@ Econom cs@30 , 579-602
(2002)
3.3@ Interpretations
Col mn@ 1@ contai s@ the@ woghted least-square@ estmates@ of@ Eq ・ (4) , The@ effect
of@ FDI@ on@ the@ rate@ of@ productvi y@ growth@ of
the@ reCpient@ industry@ @@ negatve@ but
statisticC @@ i si nficant , In@ contrast , the
sP llover@effect@of@FDI@ @@ shown@to@be@@ rge@and statstcally@ Sgni i ant , The@ estmated
coef Ⅰ Cent@on,@
[email protected].@
whi h@ @@ statstcallslgnlficant at the Ⅰ % @evel, @m plles that a Ⅰ 叱 。
@ncrease l れ仁 heaverage shareo Ⅰ ケ orelgnequlty
partCpaton@ in@ the@ whole@ industry@ will@ rai e
the average rate of prodUctlv@ty growth o Ⅰ the
component@ industLes@ by@ about@ 0.523
percentage@ points
To@ test@ the@ factors@ of@ potenti3@ l portance@ to
productivity@ growth,@ he@ extend@ the@ model@ by introduCng@three@varables@ they@are@ output@93.
natonal@ sale@ growth@ rate@ and@ publ@@ capi al ,
The results sh0w Ⅰ rom colum n 2 t0 4. 丁 he
c0umn@ 5@ @@ the@ resu@@ of@ addi g@ the@ three
varl bl s@ @@ the@same@tme , The@ paper@found@ i
every@ case@ the@ estmated@ s Ⅰ ll ver@ effect@ of
FDI,@as@the@coef Ⅰ Cent@on@
H@
remains@posi iveand@ statstcally@ Sgni i ant
4@ Con Ⅰ us ons
4.1@ General@ Summary
Th@@ paper@ introduced@ the@ background@ and dynami m@ of@ vi tuous@ cyCe@ between@ Japan
and@ China , And@ Focused@ on@ the@ asS milat on
capaci y@ of@ China's@ ICT@ industry@ espeCally@ on
the@effect@faCli ated@ by@the@ FDI@ in@the@vi tuous cycle ・ Then@ as@ an@ example , introduced@ the
case@ in@ Shenzhen@ China@ by@ using@ model
(2 Ⅰ (@ iii@ )@ done@ by@ Z Ⅱ qi ng@ Ⅰ u@ in@ State
Univers け y o Ⅰ New York at Bu 什 a@ 。
4.2@ New@ Ⅰ ndings
The@ resu@@ of@the@case@of@Shenzhen@ suggests that FDI generates externnalltles @n the Ⅰ orm of
techno@ogy trlans Ⅰ er. The polnt est@mates of
the@ externG@ effect@ of@ FDI@ on@ productvi y
suggest@that@a@ 1%increase@ in@the@average@ level of Ⅰ DI ln the whole ICT lnd り stry could ralse
the rate 0f pr0d し ct@vlty growth among al@ IC コロ
lndustrles by as m uch as 0 ・ 5 percentage
po@nts. コロ he results are robust t0 a number of
alternat@ve speclflcatlons/ whlch c0ntro@ for varlables usua@ly consldered as lm p0rtant
de 七 ermlnan た s 0 Ⅰ product@vlty growth, and t0
a@ternatlve me 宕 sures f0r セ he presence 0 Ⅰ
fo 「 e@gn @nvestment.
4.3 The Futu 且 e WO ァレ S
Th@@ paper@ i troduced@ three@ posSb@@ model
of@TSo@facilitated@ by@ FDI@ and@ gave@the@case@of
Shenzhen analyzed by one model as an
exampl , The@ future@ work@ will@ be@ ana@ Ss@ on
China , s@ ICT@ industry@ by@ using@ the@ other@ two model .@ Wh@ h@ were@ proved@ most@ effi l nt@ on
anal Zng@ Japan's@ electri al@ mac Ⅱ nery
industry@ by@ C , Watanabe@ et@ al@ in2001.@ If@ @@ i possible@ to@ get@ enough@ data , the@ analysis@ of
whoe@ ICT@ industry@ @@ C Ⅱ na@ will@ be@ proceed
too
References
[l] Chih 叶 o Watanabe, Bing Zhu, Charla
G Ⅱ ffy-Brown, Behrooz Asga Ⅱ , "Global
technology@spillover@ and@ its@ Ⅰ pact@ on industry , s@ R&D@strategies"@Technovation
21 (2001)281-291
[2]@Zhiqiang@ Liu , "Foreign@ D rect@Investment
and@ Technology@ Spillover:@ Evidence
什 om China" Journa@ of Comparative Economics 30, 579 一 602 (2002).
[3] Q 巾 gxuan Meng and Mingzhi Li, "New Econom y and ICT Developm ent in China," 加乃 @ormatio 月比 0 戸 omi ㏄ a 戸イ月 , 0//cy
14 , No , 2@ (2002)@ 275-295.
Ⅰ ]@ Matti@ Po Ⅱ 0a,@ "The@ New@ Economy:@ Facts,
Impacts@ and@ Policies,"@ Information
Economcs@ and@ Policy@ 14 , No , 2@ (2002) 133-144.
[5] Carayannis, E.G. / Sagi, J" "EXplo 田 ng
opportuni ies@ of@ the@ new@ economy:
developing nations in suppo Ⅱ t of the
IC 丁 indus Ⅱ V" Ⅱ e 召 万戸 0 は沖 on, Aug (2002)
[6]@ Wong,@ P , -K ・ ,@ "ICT@ production@ and
diffusion@ in@ Asia@ Digital@ dividends@ or digita@ divide?" Ⅰ万月 o Ⅰ ma 打 o 戸 E 亡 o 月 om た /