Construction, validation and application of
reporter assay yeasts expressing human
estrogen receptors α and β , and a
coacitvator SRC-1
著者
Tyu Wairin
内容記述
学位授与大学: Osaka Prefecture University(大阪
府立大学), 学位の種類: 博士(理学), 学位記番号:
論理第82号, 学位授与年月日: 2009-09-30, 指導教
員: 八木 孝司.
Construction, validation and application of
reporter assay yeasts expressing human estrogen
receptors α and β, and a coactivator SRC-1
Chu Wai Ling
Osaka Prefecture University
2009
Abbreviations
3Chapter 1 General introduction
4Chapter 2 Construction and assays of yeasts
112-1 Construction of reporter yeast strains
112-1-1 Introduction
112-1-2 Materials and Methods
132-1-2-1 Construction of plasmids 13
2-1-2-1-1 Expression vector 14
2-1-2-1-2 Reporter vector 15
2-1-2-1-3 ERα expression plasmid 16
2-1-2-1-4 ERβ expression plasmid 17
2-1-2-1-5 SRC-1 expression plasmid 20
2-1-2-2 Yeast transformation 21
2-1-2-3 Assay method for determining estrogenic activity using ERα and ERβ reporter yeasts
23
2-1-3 Results
272-1-4 Discussion
312-2 Agonistic assay of various ligands
332-2-1 Introduction
332-2-2 Materials and Methods
342-2-3 Results
342-2-4 Discussion
372-3 Assay for estrogenic activity of pharmaceuticals 39
2-3-1 Introduction
392-3-2 Materials and Methods
412-3-3 Results
422-3-3-1 Measurement of antagonistic activity of SERMs and ICI in ER α and ERβ yeast assays
42
2-3-3-2 Measurement of agonistic activity of SERMs and ICI in ERα and ERβ assays
44
2-3-3-3 Measurement of agonistic and antagonistic activity of an ERα-selective agonist PPT in ERα and ERβ yeast assays
46
2-3-4 Discussion
482-4 River sample assay
532-4-1 Introduction
532-4-3 Results
552-4-4 Discussion
57Chapter 3 Conclusion
60Acknowledgements
63Abbreviations
BPA: Bisphenol A
cDNA: Complementary DNA CC: Clomiphene citrate salt
CPRG: Chlorophenol red-β-D-galactopyranoside DES: Diethylstilbestrol
DMSO: Dimethyl sulfoxide
DZ: Daidzein (4’,5,7-Trihydroxyisoflavone) E2: 17 β-estradiol
EB: Elution buffer EM: Emodin ER: Estrogen receptor
ERE: Estrogen responsive element
GS: Genistein (4’,7-Dihydroxyisoflavone) ICI: ICI 182,780
ONPG: o-nitrophenyl-β-D-galactopyranoside PCR: Polymerase chain reaction
PPT: Propylpyrazole Triol Ral: Raloxifene
SRC-1: Steroid receptor coactivator-1 Tam: Tamoxifen
Chapter 1
General Introduction
Endocrine disruptors (sometimes referred as hormonally active agents) are exogenous substances that act like hormones in the endocrine system and disrupt the physiologic function of endogenous hormones. Since the publication of Rachel Carson’s Silent Spring (1962), there has been great concern that the chemicals in the environment may threaten wildlife and also human health. The term “endocrine disruptors” was first introduced into scientific literature by Theo Colborn et al. (1993). In their paper, she stated that environmental chemicals may disrupt the development of the endocrine system, and that effects of exposure during development are irreversible.
Endocrine disrupting compounds encompass a variety of chemical classes, including hormones, plant constituents, pesticides, compounds used in the plastics industry and in consumer products, and other industrial by-products and pollutants. Health effects attributed to endocrine disrupting compounds include a range of reproductive problems (reduced fertility, male and female reproductive tract abnormalities, and skewed male/female sex ratios, loss of fetus, menstrual problems, changes in hormone levels; early puberty; brain and behavior problems; impaired
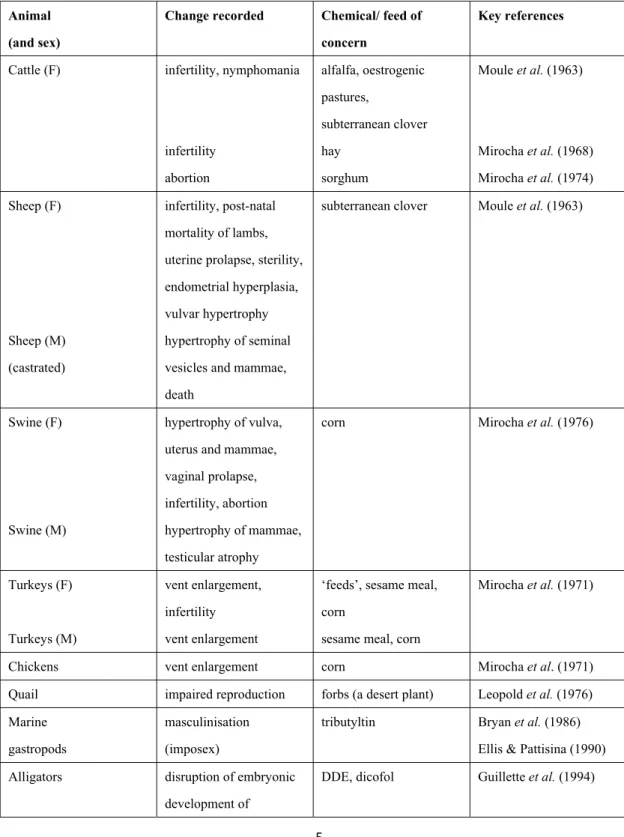
immune functions; and various cancers (Harrison et al., 1995). Harrison et al. summarized the suggested adverse effects owing to environmental estrogens (Table 1). It covers lots of wildlife and involves a wide range of chemicals and foods.
Table 1: Summary of suggested adverse effects owing to environmental estrogens Animal
(and sex)
Change recorded Chemical/ feed of
concern
Key references
Cattle (F) infertility, nymphomania
infertility abortion alfalfa, oestrogenic pastures, subterranean clover hay sorghum Moule et al. (1963) Mirocha et al. (1968) Mirocha et al. (1974) Sheep (F) Sheep (M) (castrated) infertility, post-natal mortality of lambs, uterine prolapse, sterility, endometrial hyperplasia, vulvar hypertrophy hypertrophy of seminal vesicles and mammae, death
subterranean clover Moule et al. (1963)
Swine (F)
Swine (M)
hypertrophy of vulva, uterus and mammae, vaginal prolapse, infertility, abortion hypertrophy of mammae, testicular atrophy
corn Mirocha et al. (1976)
Turkeys (F)
Turkeys (M)
vent enlargement, infertility vent enlargement
‘feeds’, sesame meal, corn
sesame meal, corn
Mirocha et al. (1971)
Chickens vent enlargement corn Mirocha et al. (1971)
Quail impaired reproduction forbs (a desert plant) Leopold et al. (1976) Marine
gastropods
masculinisation (imposex)
tributyltin Bryan et al. (1986) Ellis & Pattisina (1990) Alligators disruption of embryonic
development of
reproductive system Fish
Fish (F)
induction of vitellogenin masculinisation
pulp mill effluent Harries et al., (1995) Purdom et al. (1994) Davies & Bortone (1992)
Gulls (M) feminisation
(super-normal clutches)
organochlorines Fry & Toone (1981) Fox (1992)
(Harrison et al., 1995)
Estrogens play an important role in the control of growth, development, and metabolic homeostasis in a number of tissues. These effects are mediated by estrogen receptor (ER) (Ciocca and Roig, 1995). ER is a ligand-activated transcription factor, and a member of the steroid/nuclear receptor superfamily. Nuclear receptors share a highly conserved structure and have similar mechanisms to mediate gene transcription (Mangelsdorf et al., 1995). Malfunction of nuclear steroid and thyroid hormone receptors has been associated with various disorders, including cancers, cardiovascular diseases, osteoporosis and metabolic disorders.
Estrogenic disruptor is one of the common endocrine disruptors. For example, natural hormones, E2 (17 β-estradiol) and E1 (estron) are excreted in urine, naturally and it has been reported that they are converted to more free estrogen in wastewater treatment plants (Reddy et al., 2005). Besides the natural hormone, some other estrogenic chemicals such as bisphenol A and nonylphenol are also widely present in daily life. Some reports show that bisphenol A may be related to the consumption of
tea and coffee, and it is detected in urine of most Japanese people (Matsumoto et al., 2003). Similarly, genistein that may be related to the consumption of food containing phytoestrogen is also found in river water in Japan (Kawanishi et al., 2004). If people take some synthetic estrogen and contraceptive pills for medical purpose, estrogen-like chemicals are also excreted in urine.
One more example of the adverse consequences of the exposure of animals including humans to hormonally active agents is the case of the drug diethylstilbestrol (DES), a non-steroidal estrogen and not an environmental pollutant. Prior to its ban in the early 1970s, doctors prescribed DES to as many as five million pregnant women to block spontaneous abortion. It was discovered after the children went through puberty that DES affects the development of the reproductive system and causes vaginal cancer. The relevance of DES to the risks of exposure to environmental endocrine disruptors is questionable, as the doses involved in these individuals are much higher than the doses of environmental exposures (Golden et al., 1998)
Other studies have also suggested that even low-level exposure to endocrine disruptors might cause adverse biological effects in animals including humans (Norgil Damgaard et al., 2002; Tsutsumi, 2005). Some environmental samples even contain unknown hormonal properties, e.g. growth-promoting properties in animals (Bovee et al., 2004), and therefore, a convenient and quick bioassay system for first screening of
estrogenic activity in environmental samples is required. This assay would be very valuable and beneficial for both wildlife and humans.
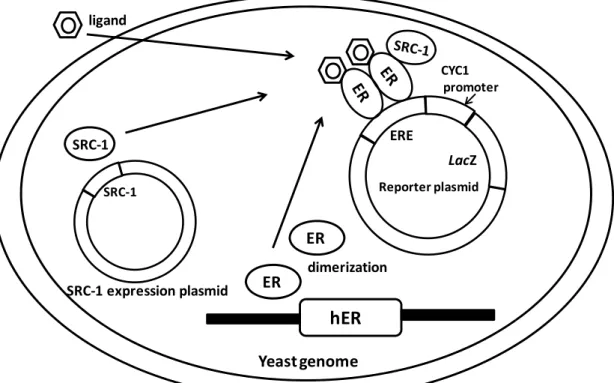
Since first developed by Routledge and Sumpter (1996), a recombinant yeast strain expressing human ER has been widely applied for in vitro assays to detect estrogenic activities. Modified recombinant yeast strains have also been shown to be effective and reliable to evaluate estrogen-like activity in environmental samples (Kawanishi et al., 2004; Takahashi et al., 2003). In the current study, yeast strains expressing both subtypes of ER (α and β) together with coactivator, SRC-1, have been constructed (Fig. 1). In addition, to improve the sensitivity of these yeast screens, modification of the site upstream to translational start codon (initiator consensus sequence) of ERs and addition of the polyadenylation signal as a termination sequence were carried out. Finally, sensitive, quick, convenient and cost-effective yeast assay systems for screening environmental estrogen-like pollutants were established.
SRC‐1 SRC‐1 expression plasmid SRC‐1 Yeast genome hER ligand ER dimerization ERE LacZ Reporter plasmid CYC1 promoter ER
Figure 1. Features of recombinant yeast strains of ERα and ERβ. Human cDNA of ERα or ERβ was integrated into the yeast genome. Estrogen response element (ERE) and steroid receptor coactivator-1 (SRC-1) were co-expressed. CYC1 promoter was inserted upstream of the LacZ gene. In response to the ligand, ER will undergo conformational change and then form a dimer followed by the recruitment of SRC-1. This complex will bind to ERE, activating the expression of the LacZ reporter gene.
Using these ERα and ERβ yeast reporter assays, dose-dependent transcriptional activities of different categories of agonistic ligands, a natural hormone, 17 β-estradiol E2; a synthetic drug, diethylstilbestrol (DES); phytoestrogens including genistein (GS), daidzein (DZ) and emodin (EM); and an environmental endocrine disrupter, bisphenol A (BPA), were measured. Besides, these yeasts were applied to examine the estrogenic activity of the following three categories of pharmaceuticals, including
selective estrogen receptor modulators (SERM), tamoxifen (Tam), raloxifene (Ral) and clomiphene citrate (CC); a “pure” ER antagonist, ICI 182,780 (ICI); and a subtype (ERα) selective agonist, propyl pyrazole triol (PPT). Furthermore, these yeast strains were applied to evaluate the estrogenic activity of water samples collected in the Yamoto River, one of the biggest watersheds in the western part of Japan.
Chapter 2
Construction and assays of yeasts
2-1 Construction of reporter yeast strains
2-1-1 Introduction
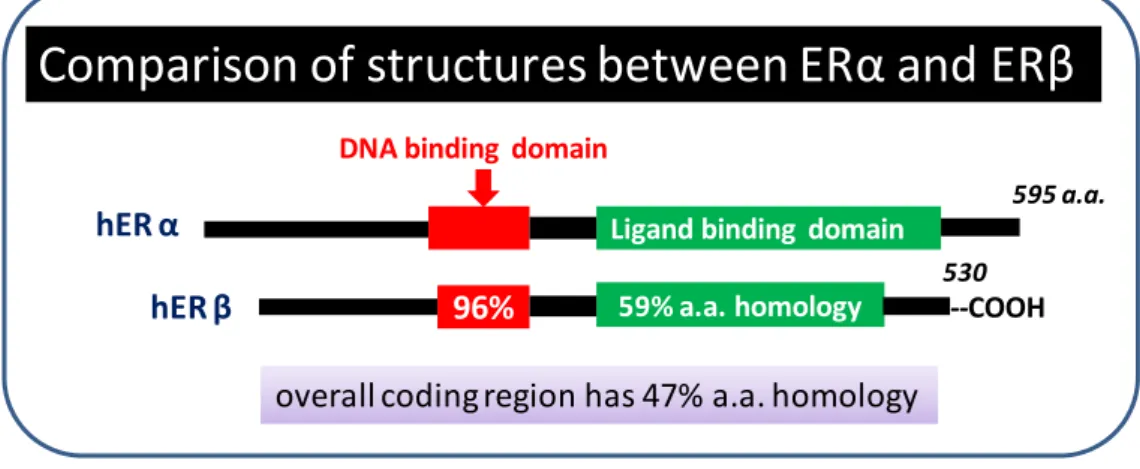
The humanER was first cloned and sequenced fromMCF-7 human breast cancer cells in 1986 (Green et al.) The ER protein consists of 595 amino acids. In 1996, a novel member of the nuclear hormone receptor superfamily was cloned from a rat prostate complementary DNA (cDNA) library (Kuiper et al., 1996). This novel sequence encodes a protein of 485 amino acid residues and was designated as ERβ, and then the former one was designated as ERα. Both ERs contain an activation domain 1 (AF1) at the N-terminus, a central DNA binding domain (DBD) and a ligand binding domain (LBD) at the C-terminal. The DNA binding domain of two ER subtypes is highly conserved (96% homology of amino acid sequence), while the homology of the ligand binding domain and of overall length between two subtypes is about 59% and 47%, respectively (Enmark et al., 1997) (Fig. 2-1).
Kling, 2001
Comparison of structures between ERα and ERβ
96% 59% a.a. homology DNA binding domain Ligand binding domain 530 595 a.a. ‐‐COOH hER α hER β overall coding region has 47% a.a. homologyFigure 2-1. Structures of ERα and ERβ.
These 2 subtypes are expressed in different tissues (Kuiper et al., 1997), and have different transcriptional activities (Delaunay et al., 2000) and ligand binding affinity (Jisa et al., 2001; Morito et al., 2002; Nikov et al., 2001) as well as the ability to recruit coactivators in various cell lines (Barkhem et al., 1998; Kraichely et al., 2000). As a result, ERα and ERβ have different responses to estrogens (Schreurs et al., 2002), it is necessary to establish a bioassay system which is capable of comparing the estrogenic activity between the two subtypes.
Steroid receptor coactivator-1 (SRC1) was the first identified member of the p160 coactivator family. All p160 coactivators contain the LXXLL motif that mediates the interaction between coactivator and nuclear receptor. The ERα-SRC-1 complex appears to be much stronger to potentiate ERα-mediated gene activation than other nuclear receptor-coactivator complexes (Ellison et al., 2003; Sheppard et al.,
2003).
In order to establish a convenient and quick bioassay system for first screening of estrogenic activity in environmental samples, yeast strains expressing both subtypes of ER (α and β) together with coactivator SRC-1 were constructed. In addition, sensitivity of our yeast screens has been improved by modifying the site upstream to translational start codon (initiator consensus sequence) of ERs and adding the polyadenylation signal as a termination sequence. These yeasts were applied to the following assays in this study.
2-1-2 Materials and Methods
2-1-2-1 Construction of plasmidsChemicals, essentially analytical grade, were purchased from Nacalai Tesque (Kyoto, Japan), Sigma-Aldrich Japan (Tokyo, Japan) or Tokyo Chemical Industries (Japan). The DH5α strain of Escherichia coli was used for subcloning plasmids. All PCR reactions were done with high fidelity PCR polymerase KOD-plus (TOYOBO Co. Ltd., Osaka, Japan). Oligonucleotides for PCR primers and DNA sequencing primers were synthesized by Sigma-Aldrich Japan (Tokyo, Japan). Restriction enzymes and DNA ligase were obtained from New England BioLabs (Beverly, MA, U.S.A.) and TOYOBO, respectively. DNA sequences were determined with an ABI
PRISMTM BigDye Terminator Cycle Sequencing Ready Reaction Kit (Perkin-Elmer
Co., Foster City, CA, U.S.A.) using an ABI3730 automatic DNA sequencer (Perkin-Elmer Co.). The amount of RNA and DNA was measured by an ND-1000 UV/VIS Spectrophotometer (NanoDrop Techonology, Wilmington, DE, U.S.A.). The yeast strain W303a and plasmid YEplac181 were kindly supplied by Dr. Charles A. Miller III (Tulane University, LA, U.S.A.).
2-1-2-1-1 Expression vector
Yeast expression vector, pUCura3 was constructed as follows. Yeast ura3-1 gene was amplified by PCR from pESC-URA vector (Stratagene, La Jolla, CA, U.S.A.) and then digested by EcoRI and MfeI, and finally inserted into the EcoRI site of pUC19 (TaKaRa Biochemical Inc., Shiga, Japan). The inducible Gal1/Gal10 dual directional promoter was cut out from YEplac181 and then inserted into the BamHI-SmaI site of the constructed vector. Finally, the yeast CYC1 terminator sequence containing a polyadenylation signal (Russo et al., 1993) was amplified from yeast genomic DNA by PCR with the following primers: 5'-TATGTCAAGCTTACATTCACGCCCTC-3' and 5'-CTTCTCAAGCTAGGTCTTCAGTATAATG-3', and then inserted into the HindIII site of the constructed vector. The final construct was designated as pUCura3.
2-1-2-1-2 Reporter vector
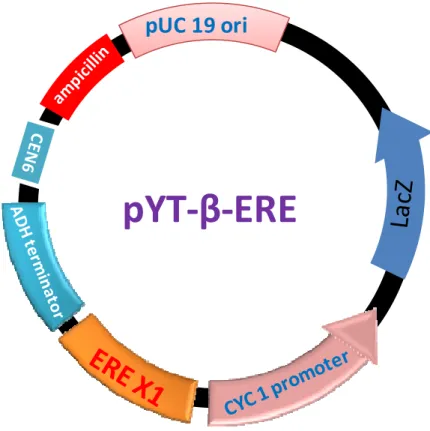
The reporter vector, pYT-β-ERE was constructed by inserting one copy of estrogen responsive element (ERE)-containing oligonucleotides (i.e. ERE=5'-AGGTCAnnnTGACCT-3', n=any nucleotide) into pRW95-3 (Wolf et al., 1996). The oligonucleotides 5'-GATCCCAGGTCAACATGACCTAGAA-3' and 5'-GATCTTCTAGGTCATGTTGACCTGG-3' (ERE sequences are underlined) were phosphorylated by T4 polynucleotide kinase, annealed and inserted into the BglII site of pRW95-3. The reporter vector, pRW95-3 contains a TRP-1 selection marker, yeast CEN6 origin for episomal replication, and a lacZ reporter gene located just downstream of a yeast CYC1 minimal promoter. This plasmid has a CEN6 origin, thus only 1-2 copies of the plasmid were stably maintained in a cell. A single copy and correct orientation of ERE (same as the former oligonucleotide mentioned above) in pYT-β-ERE were confirmed by sequencing (Fig. 2-2).
pYT‐β‐ERE
pUC 19 ori
Figure 2-2. Details of reporter plasmid containing one copy of ERE.
2-1-2-1-3 ERα expression plasmid
Since the cutting sites of SpeI and SalI in the pUCura3 vector are too close, 27 oligonucleotides were introduced between these 2 cutting sites. The following oligonucleotides, 5'-CTAGCAGGTCAGGAAAGGTCAGATGCT-3' and 5'-CTAGAGCATCTGACCTTTCCTGACCTG-3' were phosphorylated by T4 polynucleotide kinase, annealed and inserted into the xbaI site in the vector. The resultant vector was designated as 2MpUCura3.
A fragment of the open reading frame of ERα was amplified by PCR from ERα-expressing yeast (Routledge and Sumpter, 1996) which was kindly provided by
Professor J. P. Sumpter (Brunel University, Uxbridege, U.K.). The primers used were
5'-CCGAAGAGGAGGGAGAATGTTG-3' and 5'-CAGTAAGCCCATCATCGAAGCT-3'. The resulting PCR product, 10 ng, was
used as a DNA template for further PCR amplification with primers which contain
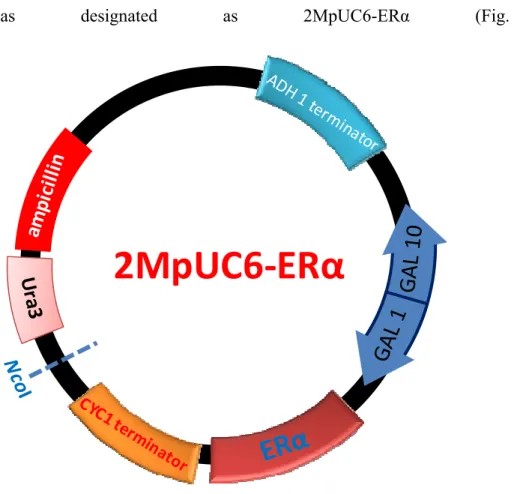
SpeI and SalI restriction cutting sites, 5'-CCACACTAGTCTAAAAACATGATGACCATGACCCTCCACAC-3' and 5'-GGAAGTCGACTCAGACCGTGGCAGGGAAACCCTC-3', respectively. The resultant PCR fragments were inserted into a vector, 2MpUCura3. The final construct
was designated as 2MpUC6-ERα (Fig. 2-3).
2MpUC6‐ERα
2-1-2-1-4 ERβ expression plasmid
A DNA fragment of the open reading frame of ERβ cDNA (Mosselman et al., 1996) was amplified by PCR from commercially provided total cDNA of the human testis (product number: 7117-1, Clontech, Mountain View, CA, U.S.A.). Two pairs of primers were used for amplification of the target DNA:
5'-TGACCTTTGTGCCTCTTCTTGC-3' and 5'-CTCCATCCAACAGCTCTCCAAG-3’;
5'-CCGGAGAGAGAGATGTGGGTAC-3' and 5'-ACACAGCAGAAAGATGAAGCCC-3'. Two amplified cDNA fragments
overlapped and were combined into one fragment by further PCR amplification. PCR products were separated by agarose gel electrophoresis and fragments of appropriate size were extracted from the gel and purified by a Minute Elute Gel Extraction Kit (Qiagen, Maryland, U.S.A.). The purified DNA fragment, 10 ng, was used as a DNA template for further amplification with a pair of primers containing restriction sites, XbaI and HindIII, i.e. 5'-GCCTCTTCTAGAAAGGTGTTTTCTCAGC-3' and 5'-ACGCTTAAGCTTGTGACCTCTGTGGGCC-3'. The resultant fragments were digested by XbaI and HindIII and then ligated into the XbaI-HindIII site of the vector, pUCura3. The sequence just upstream of the initiation codon in the ERβ gene was
modified by Quick change XL site-directed mutagenesis kit (Stratagene, La Jolla, CA,
U.S.A.) with the following primers 5'-GCTGTTATCTAAAAACATGGATATAAAAAACTCAC-3' and 5'-GGCTAGATGGTGAGTTTTTTATATCCATGTTTTTA-3'. This modification is
effective to increase the translation efficiency of some human genes in yeasts (Hamilton et al., 1987; Russo et al., 1993). This final constructed plasmid was
designated as pUCura3ERβ (Fig. 2-4).
pUCura3ERβ
2-1-2-1-5 SRC-1 expression plasmid
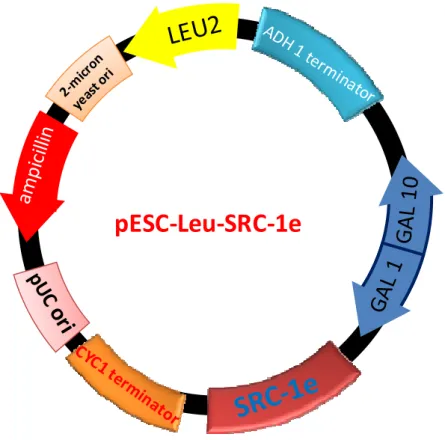
The expression vector for human SRC-1, pESC-Leu-SRC-1e was constructed by inserting PCR-amplified human full-length SRC-1e cDNA fragment into the vector, pESC-Leu (Stratagene, La Jolla, CA, U.S.A.). The primers used for PCR were as follows: 5'-CAAAGAAGATCTCCCAGGTGTGAAG-3' and 5'- AGGGCCCTCGAGACTCTAGTCTGTAG-3' (Fig. 2-5). The resulting PCR fragments were cut by BglII and XhoI, and inserted into the BamHI-XhoI site of the vector.
All constructed plasmids were sequenced by an ABI3730 automatic DNA sequencer to confirm that no mutations were introduced during the construction process.
pESC‐Leu‐SRC‐1e
Figure 2-5. The details of SRC-1e expression plasmid.
2-1-2-2 Yeast transformation
The yeast strain used in this study was Saccharomyces cerevisiae, W303a (MATa, ura3-1, ade2-1, trp1-1, leu2-3, his3-11, 15). Transformations were performed by the lithium acetate method. Firstly, the circular reporter plasmid pYT-β-ERE was introduced into the yeast. A single colony was isolated and cultured in growing medium (Table 2-1) without tryptophan. Secondly, circular plasmids containing ERα or ERβ were linearized by NcoI and integrated into ura3-1 gene in the yeast genome by homologous recombination. Transformed cells were selected and cultured in growing medium without uracil and tryptophan. Finally, circular plasmid
pESC-Leu-SRC-1e was introduced into the yeast. Transformed cells were selected by agar plates (same components as growing medium) without uracil, tryptophan and leucin.
Table 2-1. Components of medium used in pre-culturing of yeast and as selective medium for yeast transformation.
Growing medium in 1 Liter.
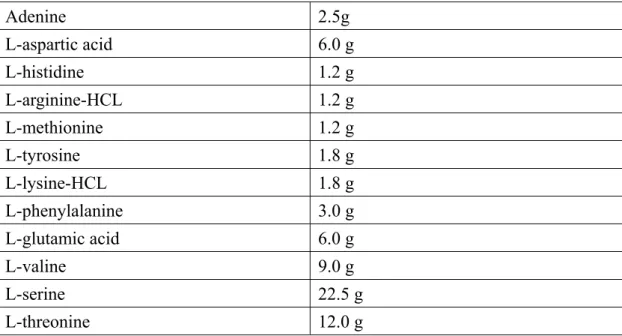
Dropout powders** 1.3 g
Yeast Nitrogen Base w/o Amino Acid and Ammonium Sulfate (Difco) 1.7 g
(NH4)2SO4 5.0 g
1 M glucose solution 5 ml
**Dropout powder (without L-Tryptophan, Uracil and L-Leusine)
Adenine 2.5g L-aspartic acid 6.0 g L-histidine 1.2 g L-arginine-HCL 1.2 g L-methionine 1.2 g L-tyrosine 1.8 g L-lysine-HCL 1.8 g L-phenylalanine 3.0 g L-glutamic acid 6.0 g L-valine 9.0 g L-serine 22.5 g L-threonine 12.0 g
2-1-2-3 Assay method for determining estrogenic activity using ERα
and ERβ reporter yeasts
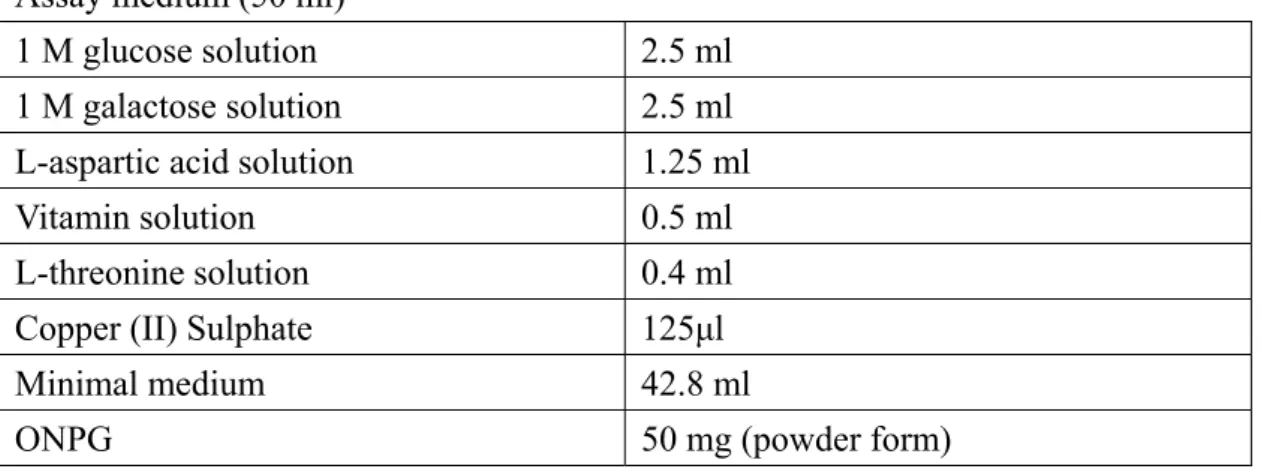
The assays were conducted using a previously described 96-well microtiter plate method (Routledge and Sumpter, 1996) with minor modifications. Since cDNAs of ERα/ERβ were inserted downstream of gal10 promoters, the expression of these genes is induced by galactose; therefore, when yeast was exposed to ligands, the assay medium contained 50 mM glucose and 50 mM galactose (Table 2-2).
Table 2-2 Components of medium used in living yeast assay.
Assay medium (50 ml)
1 M glucose solution 2.5 ml
1 M galactose solution 2.5 ml
L-aspartic acid solution 1.25 ml
Vitamin solution 0.5 ml
L-threonine solution 0.4 ml
Copper (II) Sulphate 125μl
Minimal medium 42.8 ml
Minimal medium in 1 liter
KH2PO4 13.61 g
KOH 4.2 g
(NH4)2SO4 1.98 g
MgSO4 0.2 g (if MgSO4.7H2O is used, 0.42 g)
Fe2(SO4)3 solution (0.8mg/ml water,
filtered)
Add 1 ml after the medium is autoclaved
L-leucine 50 mg L-histidine 50 mg Adenine 50 mg L-arginine-HCL 20 mg L-methionine 20 mg L-tyrosine 30 mg L-isoleucine 30 mg L-lysine-HCL 30 mg L-phenylalanine 25 mg L-glutamic acid 100 mg L-valine 150 mg L-serine 375 mg Vitamin Solution Thiamine 8 mg Pyridoxine 8 mg Pantothenic acid 8 mg Inositol 40 mg
Biotin solution (1mg/100ml water) 20ml
Pre-culture of both strains was carried out in selective growth medium containing 50 mM glucose (but without galactose) (Table 2-1). The OD595 was measured to monitor
cell growth, yeasts at growing phase were used in assay. A 400 μl aliquot of yeast culture within 1-2 of OD595 was added to 50 ml growth medium with 50 mg
was distributed into each well containing a 2 μl ligand of various concentrations. All ligands were dissolved in DMSO, and the DMSO concentration in assay medium was always maintained at less than 1% in all assays. DMSO without any ligands was regarded as blank (Fig. 2-6). The plates were incubated at 30 ˚C, and OD405 and OD595
of the medium were measured on the third day after incubation.
200 μl Conc. Assay medium containing 50 mM glucose + 50 mM galactose ONPG yeast blank (DMSO without ligands) Ligands in DMSO
Figure 2-6. The diagram showing the details of yeast assay in this study.
The β-galactosidase activity was estimated from absorbance on a spectrophotometer at OD405 while cell density was measured at OD595. All doses were assayed in
triplicate in a single experiment, and all experiments were repeated independently at least 3 times. In each experiment, various concentrations of E2 were assayed to generate a standard curve of E2 in order to calculate the E2 equivalent concentration of river samples and other ligands. Increase of induction was calculated by the
following equation: {OD405(sample)÷OD595(sample)}-{OD405(blank)÷OD595(blank)}.
The background activity found in control wells was eliminated in calculation by the above equation.
2-1-3 Results
The features and mechanisms in response to ligands of the established yeast strains of ERα and ERβ are shown in Figure 2-7.
Yeast genome
ligand dimerization CYC1 promoter β‐galactosidase o‐nitrophenyl‐β‐D‐ galactopyranoside (ONPG ) (transparent) ortho‐nitrophenol (yellow) ER ER SRC‐1e SRC‐1ehER
Reporter plasmid SRC‐1eFigure 2-7. Features of recombinant yeast strains (Saccharomyces cerevisiae) of ERα and ERβ. Human cDNA of ERα or ERβ was integrated into the yeast genome. Estrogen response element (ERE) and steroid receptor coactivator-1 (SRC-1) were co-expressed. CYC1 promoter was inserted upstream of the LacZ gene. In response to the ligand, ER will undergo conformational change and then form a dimer followed by the recruitment of SRC-1. This complex will bind to ERE, activating the expression of the LacZ reporter gene. ONPG will be catalyzed by β-galactosidase from transparent to yellow in color. This color change which represents the transcriptional activity will be determined by spectrophotometer. *ERE stands for estrogen response element.
Human ERα or ERβ cDNA was inserted into the yeast genome. An episomal SRC-1 expression plasmid and an episomal reporter plasmid containing ERE, CYC1 promoter and LacZ in order were introduced into the yeasts. ERs undergo
conformational change in response to ligands and then form dimers. This activated ER-ligand complex further recruits a coactivator SRC-1. This preinitiation complex binds to ERE to activate the transcription of the LacZ gene under the control of the CYC1 promoter. Expressed β-galactosidase cleaves ONPG to ortho-nitrophenol in the medium, and thus, changes the color of the medium from transparent to yellow. The transcriptional level represented by color change is determined by spectrophotometer, and regarded as estrogenic activity (Fig. 2-7).
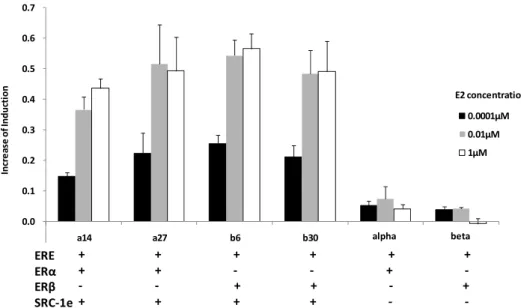
Yeast strains expressing ERα or ERβ but not SRC-1e had almost no transcriptional activity, less than 0.1 increase of induction, in response to E2. After introduction of the plasmid expressing SRC-1e, transcriptional activity was increased significantly in both strains (Fig. 2-8). Strains with a desirable increase of induction and growth rate were chosen (α14 for ERα and β6 for ERβ) for following studies and assays.
( 0.0 0.1 0.2 0.3 0.4 0.5 0.6 0.7 a14 a27 b6 b30 In cr e as e of In duc ti on E2 concentration 0.0001μM 0.01μM 1μM 0.1) ERE + + + + + + + + ‐ ‐ + ‐ ‐ ‐ + + ‐ + + + + + ‐ ‐ alpha beta E ERα ERβ SRC‐1e ER
Figure 2-8. Transcriptional activity of representative colonies of ERα and ERβ with or without SRC-1e with 0.0001 μM, 0.01 μM and 1 μM E2. Data are shown as the mean with S.D. from triplicate experiments.
In order to achieve the highest sensitivity and stability of the assay system, we had optimized the assay conditions. For example, the PH of growth and assay media, incubation time, percentage of DMSO and so on. In case of the DMSO percentage in assay medium, when it was higher than 2%, the cell density (OD595) decreased (Fig.
2-9a) and the calculated induction did not appear in a dose-dependent manner (Fig. 2-9b). Then in all our assays, DMSO percentage were strictly keep less than 2%.
a) 0 0.1 0.2 0.3 0.4 0.5 0.6 0.7 1% 2% 3% 4% 5% (A bs or ba nc e) O D 59 5 Percentage of DMSO b) ‐1 ‐0.5 0 0.5 1 1.5 2 2.5
1E‐12 1E‐11 1E‐10 1E‐09 1E‐08 1E‐07 1E‐06 1E‐05
In cr ea se of in duc ti on E2 concentration (M) E2 (DMSO 1%) E2 (DMSO 2%) E2 (DMSO 3%) E2 (DMSO 4%) E2 (DMSO 5%) ; EC50=3.01E‐10 ; EC50=2.29E‐10
Figure 2-9. a) Cell density (represented by OD595) in ER-β assay in response to E2 in
different percentage of DMSO (1-5%). Data are shown as the mean with S.D. from triplicate determinations. b)Dose-dependent estrogenic activity of ER-β assay in response to E2 in different percentage of DMSO (1-5%). EC50 of 1% and 2% DMSO
{OD405(sample)÷OD595(sample)}-{OD405(blank)÷OD595(blank)}. Data are shown as
the mean with S.D. from triplicate determinations.
2-1-4 Discussion
In the current study, lacZ reporter assay yeast strains that express a subtype of human ER, ERα or ERβ, together with transcriptional coactivator SRC-1e were established. The yeast strains had eminent capability for measuring estrogenic activity after several modifications of expression vector and plasmids. These yeast strains could detect as low as 1 x 10-11 M of E2 (Figure 2-10), and the EC
50 value of E2 was
approximately 5 x 10⁻¹⁰ M, indicating its high sensitivity in response to ligands.
In order to establish estrogenic reporter yeasts that can efficiently respond to ligands, two important modifications were introduced. Since the copy number and origin of ERE affect the binding affinity and the transcriptional activity of ER (Ellison et al., 2003; Klinge, 2001; Kulakosky et al., 2002; Loven et al., 2001), the effect of different copies of ERE, 1-5 and 10, on β-galactosidase activity were examined. The result showed that the copy number of ERE higher than 1 had very high background activity, i.e. in DMSO without any ligands (data not shown). Therefore, one copy of ERE was inserted upstream of lacZ in these assay yeasts. The third base just upstream of the start codon (initiator consensus sequence) of ERα and ERβ was assigned as adenine, and addition of the polyadenylation signal as a termination sequence were key modifications for establishment of the assay yeasts. Before these modifications,
the yeasts had a too low ER translation level to induce β-galactosidase in response to E2. Some other studies also show a remarkable increase in reporter activity when the translation efficiency of the nuclear receptor gene has been improved (Hamilton et al., 1987; Russo et al., 1993).
ERα and ERβ have different performances in the recruitment of different coactivators in response to ligands (Bramlett et al., 2001), and the posttranslational modification of coactivators is tissue-specific for both ER subtypes (Ko et al., 2002). The presence of SRC-1 has been reported to increase β-galactosidase activity significantly in yeast and mammalian assays (Ellison et al., 2003; Heery et al., 1997; McKenna and O'Malley, 2002; Spencer et al., 1997). The nuclear receptor (NR) box motif of SRC-1 can recognize the ligand-binding domain of the nuclear receptor. The affinity of several NR boxes is specified by the ligand, and the NR boxes have significant ER isoform preference (Bramlett et al., 2001). In the present study, several SRC-1 variants including naturally splicing variant SRC-1e and artificially truncated ones were examined. The truncated SRC-1 had negative results i.e. no color change in the assay (data not shown). In contrast, SRC-1e, the prevalent variant (Hayashi et al., 1997), was effective for the induction of transcriptional activity. The induction of β-galactosidase activity by estrogen was barely detected without the introduction of SRC-1 into the yeast in the present study (Fig. 2-8). These results indicate that the
coexpression of coactivators improves the efficiency of ligand-dependent reporter gene expression in yeasts expressing other nuclear receptors as well as ERs (McKenna and O'Malley, 2002).
2-2 Agonistic assay of various ligands
2-2-1 Introduction
The estrogenic activities of the following categories of agonistic ligands were investigated, including a natural hormone, 17β-estradiol (E2); a synthetic drug, diethylstilbestrol (DES); phytoestrogens, genistein, daidzein and emodin; and an environmental endocrine disrupter, bisphenol A. E2 was used as a standard curve for comparison with other ligands. Phytoestrogens are sometimes called “dietary estrogens”, and are a diverse group of naturally occurring non-steroidal plant compounds. They have similar structure with E2 and have ability to cause estrogenic effects (Yildiz, 2005). Three phytoestrogens were examined in this study mainly because they are widely found in nature and as excretion by humans and wildlife. DES is an orally active synthetic non-steroidal estrogen that was first synthesized in 1938 by Leon Golberg. It was commonly used medication for hormone replacement therapy. Bisphonel A is an important monomer in the production of polycarbonate and is commonly found in plastic products in our life. In order to validate the capability of
the constructed reporter yeasts, responses of three different categories of agonists were examined in this part of the experiment.
2-2-2 Materials and Methods
The estrogenic activities of the following agonistic ligands were investigated (Fig. 2-10). The suppliers of these chemicals are as follows: E2, Nacalai tesque (Kyoto, Japan); DES, Sigma-Aldrich (Tokyo, Japan); GS and DZ, Fujicco (Hyogo, Japan); EM, Fluka (Tokyo, Japan) and BPA, Tokyo Chemical Industries (Tokyo, Japan). The details of assay method were mentioned in Section 2-1-2-3.
17 β‐estradiol (E2) Diethylstilbestrol (DES)
Genistein (GS) Daidzein (DZ) Emodin (EM)
Bisphenol A (BPA)
Figure 2-10. Chemical structures of the ligands tested in this part of experiment.
Both ERα and ERβ assay yeasts responded dose-dependently to all tested ligands. (Fig. 2-11).
The synthetic drug, DES, was the most potent ligand in the present study. DES and E2 had comparably the highest estrogenic activity among the tested substances. Ranking of the estrogenic potency of ligands in the ERα assay was DES>E2>emodin>genistein>daidzein>BPA. In ERβ assay, the ranking was DES>E2>genistein>emodin>daidzein>BPA.
a) 0 0.1 0.2 0.3 0.4 0.5 0.6 0.7 0.8 0.9 0.000001 0.0001 0.01 1 100 In cr e as e of In d u ct io n Concentration (μM) ERalpha E2 GS DZ EM BPA DES b) 0 0.1 0.2 0.3 0.4 0.5 0.6 0.7 0.8 0.9 1 0.000001 0.0001 0.01 1 100 In cr ea se of In d u ct io n Concentration (μM) ERbeta E2 GS DZ EM BPA DES
expression in response to different ligands. (a): ERα; (b) ERβ. Data are shown as the mean with S.D. from triplicate determinations. 17β-estradiol (E2); genistein (GS); daidzein (DZ), emodin (EM); bisphenol A (BPA) and diethylstilbestrol (DES).
All assays were conducted independently at least 3 times, and similar EC50
values of both ER subtypes were obtained. The EC50 values of E2 for ERα and ERβ
are 5.31 x 10⁻¹⁰ M and 5.85 x 10⁻¹⁰ M, respectively (Table 2-3).
Table 2-3. EC50 value of ligands in ERα and ERβ yeast bioassay
Ligands ERα (M) ERβ (M)
17β-estradiol (E2) 5.31 x 10⁻¹⁰ 5.85 x 10⁻¹⁰ Genistein (GS) 3.56 x 10⁻⁷ 1.13 x 10⁻⁸ Daidzein (DZ) 5.45 x 10⁻⁷ 1.45 x 10⁻⁷ Emodin (EM) 8.95 x 10⁻⁸ 1.44 x 10⁻⁸ Bisphenol A (BPA) 1.64 x 10⁻⁶ 2.50 x 10⁻⁷ Diethylstilbestrol (DES) 3.60 x 10⁻¹⁰ 1.73 x 10⁻¹¹
2-2-4 Discussion
Since first developed by Routledge and Sumpter (1996), a recombinant yeast strain expressing human ER has been widely applied for in vitro assays to detect estrogenic activities. Modified recombinant yeast strains have also been shown to be effective and reliable to evaluate estrogen-like activity in environmental samples (Kawanishi et al., 2004; Takahashi et al., 2003). In the current study, lacZ reporter
assay yeast strains that express a subtype of human ER, ERα or ERβ together with transcriptional coactivator SRC-1e were established. The yeast strains had eminent capability for measuring estrogenic activity after several modifications of expression vector and plasmids. These yeast strains can detect as low as 1 x 10-11 M of E2 (Fig.
2-10), and the EC50 value of E2 is approximately 5 x 10⁻¹⁰ M, indicating their higher
sensitivity in response to ligands when compared with the commonly used YES yeast (Routledge and Sumpter, 1997).
Both ER subtypes with similar EC50 of E2 were chosen for the bioassay in order
to compare the transcriptional activity in response to different ligands. Ranking of the estrogenic potency of ligands in the ERα assay was DES>E2>emodin>genistein>daidzein>BPA. In the ERβ assay, the ranking was DES>E2>genistein>emodin>daidzein>BPA. A similar ranking has been reported previously in a green fluorescent protein yeast assay (Bovee et al., 2004) and an in vitro binding experiment (Morito et al., 2001). In the current study, except for E2, which had lower EC50 in the ERα assay than in the ERβ assay, all ligands showed
lower EC50 in the ERβ assay. These results are consistent with some previous studies
but contrary to others. For example, ERβ has been reported to bind BPA stronger than ERα (Morito et al., 2001). Additionally, ERβ showed higher ability to recruit SRC-1 than ERα after ligand binding, and thus increases the transcriptional activity in
mammalian assays (Routledge et al., 2000). These properties of ERβ are consistent with the results of this study. On the other hand, in a mammalian assay, emodin has higher affinity to ERα than ERβ (Matsuda et al., 2001; Shiizaki et al., 2000). This result is contrary to that of the present study, which may be due to the different organisms or cells used. It also may be affected by the presence or absence of coactivators, and by the modification of base upstream of the start codon (initiator consensus sequence) as well as by the assay methods.
2-3 Assay for estrogenic activity of pharmaceuticals
2-3-1 Introduction
The agonistic and antagonistic activities of the following three categories of pharmaceuticals were examined, including selective estrogen receptor modulators (SERM), tamoxifen (Tam), raloxifene (Ral) and clomiphene citrate (CC); a “pure” ER antagonist, ICI 182,780 (ICI); and a subtype (ERα) selective agonist, propyl pyrazole triol (PPT) (Fig. 2-12). A human hormone, E2 was used as a standard curve for comparison with other ligands. SERMs are a class of medication that acts on the estrogen receptor. A characteristic that distinguishes these substances from pure receptor agonists and antagonists is that their action is different in various tissues, thereby granting the possibility to selectively inhibit or stimulate estrogen-like action
in various tissues. CC, Ral and Tam were examined in the present studies, and are the most common SERMs used for hormonal therapy; CC is used for treating anovulation, while Ral is used for reducing risk of breast cancer, and Tam is commonly used for treating breast cancer (Riggs and Hartmann, 2003). PPT represents the first ERα-selective agonist, it has higher binding affinity and potency to ERα than to ERβ due to their differences in structure (Harris et al., 2002, Stauffer et al., 2000). The purpose of examining PPT in this study is to validate the ligand-specific capability of these reporter yeasts. ICI is commonly used for a treatment of hormone receptor-positive metastatic breast cancer in postmenopausal women with disease progression following anti-estrogen therapy. ICI works by both down-regulating and degrading the estrogen receptor (Kansra et al., 2005).
Thus, 3 categories of synthetic pharmaceuticals were examined in order to validate the capability (agonistic or antagonistic response) of these reporter yeasts.
Clomiphene
ICI 182,780
Propyl pyrazole triol Raloxifene
Tamoxifen
Figure 2-12. Chemical structures of 5 pharmaceuticals tested in this study
2-3-2 Materials and Methods
The agonistic and antagonistic activities of the following pharmaceuticals were examined. The suppliers of these pharmaceuticals are as follows: CC and Tam, Sigma-Aldrich Japan (Tokyo, Japan); Ral, LKT Laboratories (Minnesota, USA); PPT, Cayman Chemical Company (Michigan, USA); and ICI, Tocris Cookson Ltd (Bristol, UK). The details of assay method were mentioned in Section 2-1-2-3. In antagonistic assays, fixed concentrations of the above pharmaceuticals were added into various concentrations of E2.
2-3-3 Results
2-3-3-1 Measurement of antagonistic activity of SERMs and ICI in ERα and ERβ yeast assays
Estrogenic activities of a mixture of pharmaceuticals with various concentrations of E2 were measured in ERα (Fig. 2-13) and ERβ yeast assays (Fig. 2-14) with respect to SERMs, including Tam, CC and Ral and one “pure” ER antagonist, ICI.
a.
b.
c.
d.
0 1 2 3 4 5 In cr ea se of I nduc ti on log E2 concentration (M) E2 E2+ICI(10‐10) E2+ICI(10‐8) E2+ICI(10‐6) ‐11 ‐9 ‐7 ‐5 E2+ICI(10‐10) E2+ICI(10‐8) E2+ICI(10‐6) E2 log E2 concentration (M) In cr ea se of In duct ion 0 2 1 3 4 5 ‐0.5 0.5 1.5 2.5 3.5 4.5 5.5 In cr ea se of Induc tion log E2 concentration (M) E2 E2+CC(10‐10) E2+CC(10‐8) E2+CC(10‐6) ‐11 ‐9 ‐7 ‐5 E2+CC(10‐10) E2+CC(10‐8) E2+CC(10‐6) E2 log E2 concentration (M) In cr ea se of In du ct ion ‐0.5 0.5 4.5 2.5 0 1 2 3 4 5 In cr e as e of In d u ct io n log E2 concentration (M) E2 E2+Ral(10‐10) E2+Ral(10‐8) E2+Ral(10‐6) ‐11 ‐9 ‐7 ‐5 E2+Ral(10‐10) E2+Ral(10‐8) E2+Ral(10‐6) E2 log E2 concentration (M) In cr ea se of In duc ti on 1 2 3 5 4 0 0 1 2 3 4 5 In cr ea se of I nduc ti on log E2 concentration (M) E2 E2+Tam(10‐10) E2+Tam(10‐8) E2+Tam(10‐6) ‐11 ‐9 ‐7 ‐5 E2+Tam(10‐10) E2+Tam(10‐8) E2+Tam(10‐6) E2 log E2 concentration (M) In cr ea se of Induc ti on 5 4 3 2 1 0b.
c.
d.
Figure 2-13. Dose-dependent estrogenic activity in response to mixtures of E2 (17β-estradiol) (various concentrations) and pharmaceuticals (fixed concentrations, 1×10⁻⁶ M, 1×10⁻⁸ M and 1×10⁻¹⁰ M) in the ERα yeast assay. Pharmaceuticals include a) Tam (Tamoxifen), b) CC (Clomiphene), c) Ral (Raloxifene) and d) ICI (ICI 182,780). Data are shown as the mean with S.D. from triplicate determinations.
In the ERα yeast assay, no pharmaceuticals showed antagonistic activity at any concentrations examined; however, various extents of agonistic activity were observed when mixing 1×10⁻⁶ M of the pharmaceuticals with E2 at concentrations of
1×10-12 M to 1×10⁻⁹ M (Fig. 2-13). The maximal activity of the mixture of
pharmaceuticals and E2 remained the same as that of E2.
‐0.2 0 0.2 0.4 0.6 0.8 1 1.2 1.4 1.6 In cr ea se of I nduc ti on log E2 concentration (M) E2 E2+Tam(10‐10) E2+Tam(10‐8) E2+Tam(10‐6) ‐11 ‐9 ‐7 ‐5 E2+Tam(10‐10) E2+Tam(10‐8) E2+Tam(10‐6) E2 log E2 concentration (M) 0 0.2 0.4 0.6 0.8 1 1.2 1.4 1.6
1E‐12 1E‐11 1E‐10 1E‐09 1E‐08 1E‐07 1E‐06 1E‐05
E2 E2+CC(1E‐10) E2+CC(1E‐8) E2+CC(1E‐6) 0 0.2 0.4 0.6 0.8 1 1.2 1.4 1.6 In cr ea se of Indu ct io n log E2 concentration (M) E2 E2+Ral(10‐10) E2+Ral(10‐8) E2+Ral(10‐6) ‐11 ‐9 ‐7 ‐5 E2+Ral(10‐10) E2+Ral(10‐8) E2+Ral(10‐6) E2 In cr ea se of Indu ct io n log E2 concentration (M) 0 1.6 0.4 1.2 0.8 0 0.2 0.4 0.6 0.8 1 1.2 1.4 1.6 In cr ea se of In du ct io n log E2 concentration (M) E2 E2+ICI(10‐10) E2+ICI(10‐8) E2+ICI(10‐6) ‐11 ‐9 ‐7 ‐5 E2+ICI(10‐10) E2+ICI(10‐8) E2+ICI(10‐6) E2 In cr e a se of In d u ct io n In cr e as e of In d u ct io n In cr ea se of In d u ct io n log E2 concentration (M) log E2 concentration (M) 0 0.4 0.8 1.2 1.6 0 0.4 0.8 1.2 1.6 a. b. c. d. E2 E2+CC(10‐10) E2+CC(10‐8) E2+CC(10‐6) ‐11 ‐9 ‐7 ‐5 0 0.4 0.8 1.2 1.6
Figure 2-14. Dose-dependent estrogenic activity in response to mixtures of E2 (17β-estradiol) (various concentrations) and pharmaceuticals (fixed concentrations, (1×10⁻⁶ M, 1×10⁻⁸ M and 1×10⁻¹⁰ M) in the ERβ yeast assay. Pharmaceuticals include a) Tam (Tamoxifen), b) CC (Clomiphene), c) Ral (Raloxifene) and d) ICI (ICI 182,780). Data are shown as the mean with S.D. from triplicate determinations.
In the ERβ yeast assay, among the tested pharmaceuticals, Tam, CC and ICI showed antagonistic activity to E2 at 1×10⁻⁶ M (Fig. 2-14a, b, d). When 1×10⁻⁶ M Tam
maximal activity was decreased from 1.29 to 1.10, which was approximately 14% reduction (Fig. 2-14a). Similarly, when 1×10⁻⁶ M CC was added to E2, EC
50 was
shifted to 3.30 ×10⁻⁹ M (Fig. 2-14b). Furthermore, the pure anti-estrogen, ICI 182,780,
showed weak antagonistic activity in the current study (Fig. 2-14d), EC50 was shifted
to 1.36 ×10⁻⁹ M when 1×10⁻⁶ M ICI was added to E2. Another SERM, Ral, did not
show any antagonistic activity; however, 1×10⁻⁶ M of Ral exhibited some agonistic
activity (Figs. 2-14c, 2-15b). When 1×10⁻⁶ M Ral was added to 1×10-12 M E2, which
is an ineffective concentration, activity increased from 0.21 to 0.69, about a 3-fold increment.
2-3-3-2 Measurement of agonistic activity of SERMs and ICI in ERα and ERβ assays
As the antagonistic assays (Figs. 2-13 and 2-14) apparently indicated that most pharmaceuticals are ER agonists at high concentration, agonistic activity was measured by ERα and ERβ assay yeasts (Fig. 2-15).
In the ERα assay, all pharmaceuticals showed agonistic activity to various extents when the concentrations reached 1×10⁻⁶ M (Fig. 2-15a). Table 2-4 shows the
EC50 values of the pharmaceuticals calculated from Fig. 2-15a. The ranking of the
relative to E2 (100%) is also shown in Table 2-4. The ranking of the values was Ral>ICI>CC>Tam. Figure 2-15. Dose-dependent s to (T C 1 as m d
the ERβ assay, only Ral exhibited agonistic activity when its concentration was
e trogenic activity in response E2 (17β-estradiol), Tam
amoxifen), Ral (Raloxifene), C (Clomiphene) and ICI (ICI 82,780) in a) ERα and b) ERβ says. Data are shown as the ean with S.D. from triplicate
eterminations.
In
higher than 1×10⁻⁸ M (Fig. 2-15b). Its EC
50 value was 4.37×10⁻⁷ M, 1,000 times
less potent than E2, while its maximal activity was 75.2% of E2 (Table 2-4). Other pharmaceuticals had no obvious agonistic activity in the ERβ assay. These results are consistent with the findings shown in Fig. 2-14.
‐0.5 0 0.5 1 1.5 2 2.5 In cr ea se of In du ct io n log concentration (M) ER β 0 0.5 1 1.5 2 2.5 3 3.5 In cr ea se of In du ct io n log concentration (M) ER α E2 Tam Ral CC ICI E2 Tam Ral CC ICI ‐11 ‐9 ‐7 ‐5 In cr ea se of Induc ti on ‐11 ‐9 ‐7 ‐5 log concentration (M) log concentration (M) In cr ea se of Induc ti on 1 In cr ea se of Induc ti on 0 2 3 E2 Tam Ral CC ICI
a.
b.
Table 2-4. EC50 value and maximal activity of pharmaceuticals in ERα and yeast ERβ agonistic assays. ERα ERβ Ligands EC50 (M) Maximal activity (% of E2) EC50 (M) Maximal activity (% of E2) 17β-estradiol (E2) 5.61×10⁻¹⁰ 100.0 3.50×10⁻¹⁰ 100.0 Raloxifene (Ral) 1.29×10⁻⁷ 73.0 4.37×10⁻⁷ 75.2
Tamoxifen (Tam) 1.39×10⁻⁷ 43.3 N.A. N.A.
Clomiphene (CC) 2.56×10⁻⁷ 49.3 N.A. N.A.
ICI 182,780 (ICI) 1.47×10⁻⁶ 66.7 N.A. N.A.
Propyl pyrazole triol (PPT) 4.86×10⁻⁷ 69.1 N.A. N.A.
2-3-3-3 Measurement of agonistic and antagonistic activity of an ERα-selective agonist PPT in ERα and ERβ yeast assays
As PPT is known as an ERα-selective agonist in mammalian cells, its agonistic and antagonistic activities were examined in ERα and ERβ yeast assays in the current study.
Agonistic activity of PPT was found in the ERα assay (Fig. 2-16a), but not in the ERβ assay (Fig. 2-16b). The EC50 value of PPT was 4.86×10⁻⁷ M, that is, about 1,000
activity of PPT was 1.97 induction, while that of E2 was 2.85 induction, that is, approximately 30% lower than that of E2 in the ERα assay.
Antagonistic activity of PPT was measured by mixing the fixed concentrations of PPT (1×10⁻⁶ M and 1×10⁻¹⁰ M) with various concentrations of E2. No antagonistic
activity was observed in either ERα (Fig. 2-16c) or ERβ (Fig. 2-16d) assays.
0 0.5 1 1.5 2 2.5 3 3.5 In cr e as e of I nduc ti on log concentration (M) ER α E2 PPT ‐11 ‐9 ‐7 ‐5 E2 PPT 0 0.5 1 1.5 2 2.5 3 In cr e a se of In d u cti o n log concentration (M)
ER β
E2 PPT ‐11 ‐9 ‐7 ‐5 ‐0.5 0.5 1.5 2.5 3.5 4.5 5.5 In cr e as e of I nduc ti on log E2 concentration (M) E2 E2+PPT(10‐10) E2+PPT(10‐6) E2+PPT(10‐10) E2+PPT(10‐6) E2 ‐11 ‐9 ‐7 ‐5 ER α 0 0.2 0.4 0.6 0.8 1 1.2 1.4 1.6 In cr ea se of I ndu ct io n log E2 concentraion (M) ERβ E2 E2+PPT(10‐10) E2+PPT(10‐6) ‐11 ‐9 ‐7 ‐5 E2+PPT(10‐10) E2+PPT(10‐6) E2 log E2 concentration (M) In cr ea se of Indu ct ion In cr ea se of Induc ti on In cr e as e of Induc ti on In cr ea se of Induc ti on log concentration (M) log concentration (M) log E2 concentration (M) 0 1 2 3 0 1 2 3 0 1.5 3.5 5.5 0 0.4 0.8 1.2 1.6 a. b. c. d.Figure 2-16. Dose-dependent estrogenic activity of an ERα-selective agonist, PPT (propyl pyrazole triol), in comparison with E2 (17β-estradiol) in a) ERα and b) ERβ assays. Estrogenic activity in response to mixtures of PPT (fixed concentrations, 1×10⁻⁶ M and 1×10⁻¹⁰ M) and E2 (various concentrations) in c) ERα and d) ERβ assays. Data are shown as the mean with S.D. from triplicate determinations.
2-3-4 Discussion
SERMs have been reported to have cell- and tissue-specific estrogenic effects in mammalian assays. In the present study, previously constructed yeasts (Chu et al., 2009) were applied to investigate the agonistic and antagonistic effects of 5 pharmaceuticals, including three SERMs (Tam, CC and Ral), one “pure” ER antagonist (ICI) and one ERα selective agonist (PPT).
In the ERα assay, none of the tested pharmaceuticals demonstrated antagonistic activity, whereas all showed weak agonistic activity at concentrations higher than 1×10⁻⁷ M (Figs. 2-13, 2-15). EC
50 values of these pharmaceuticals showed that they
are about 1,000 times less potent than E2 (Table 2-4). Tam was found to have agonistic activity in the YES assay (yeast without coactivator) (Li et al., 2004; Fent et al., 2006), consistent with the current study.
In the ERβ assay, Tam, CC and ICI showed antagonistic activity (Fig. 2-14), whereas only Ral showed agonistic activity at concentrations higher than 1×10⁻⁸ M
(Figs. 2-14, 2-15b). Tam, CC and ICI did not show any agonistic activity in the ERβ assay, in contrast with the results of the ERα assay. A 3-dimenstional structure shows that interactions of Ral with ERα and ERβ are similar (Pike et al., 1999), which could be one possible explanation why ERα and ERβ had similar estrogenic response to Ral. On the other hand, different responses of Tam, CC and ICI (1×10⁻⁶ M) in the ERα and
ERβ assay yeasts (Figs. 2-13, 2-14) may be due to the different interaction of the complex consisting of a ligand (e.g., pharmaceutical), ER and SRC-1, but were unsolved systematically in the present study.
Since ERα and ERβ have different biological functions (Zhao et al., 2008), the development of ER subtype-selective pharmaceuticals is increasingly important for clinical exploration. As propyl pyrazole triol (PPT) represents the first ERα-selective agonist, its estrogenic response was examined in our yeast assays. PPT showed an agonistic effect in the ERα assay, but not in the ERβ assay (Fig. 2-16). No antagonistic activity was detected in either ERα or ERβ assays, as expected. This result is consistent with the mammalian assay (Harris et al., 2002). Structure analysis of the interaction of PPT with ERs indicates that PPT has higher binding affinity and potency selectively to ERα than to ERβ due to their different binding pocket structure (Stauffer et al., 2000). These findings explain the specificity of ER subtypes in response to PPT in our yeast assays.
The details of mechanism of activation of gene transcription by ER remains unclear. Generally speaking, three main components have been reported to interact with ER (Fig. 2-17). The activation of DNA transcription is ligand-specific, it also depends on the subtypes and splicing variants of receptors as well as the interaction with coregulators and contents of responsive elements. The details of the signaling
pathway were unsolved systematically in the present study though the results may give some insights to the interaction of the molecules.
Receptors
•Subtypes •Splice variantsLigands
•Natural •syntheticDNA Transcription
Effectors
•DNA: response element •Coregulators •Other TFsFigure 2-17. Interaction of different factors which contribute to the activation of DNA transcription.
In mammalian cells, ERα and ERβ cause distinct conformational change in response to ligands (Pike et al., 1999) and thus have different abilities to recruit coactivators (Barkhem et al., 1998; Kraichely et al., 2000). Interaction with coactivators and corepressors plays a critical role in agonistic and antagonistic effects. If ligand-bound ERs induce coactivator recruitment, the agonistic effect would be exhibited (Pike, 2006). If the conformational change of ligand-bound ERs induces the recruitment of corepressors or blocking of coactivators, an antagonistic effect would be exerted (Shiau et al., 1998; Brzozowski et al. 1997; Shang and Brown, 2002). The
crystal structure of the ligand-bound ER hormone-binding domain (HBD) shows that both Tam and Ral exert their antagonistic effect by competing with E2 binding and blocking the interaction with coactivators (Shiau et al., 1998; Brzozowski et al. 1997). In contrast, their antagonistic effects are exerted if the conformational change of ERs induces the recruitment of corepressors (Pike, 2006; Shang and Brown, 2002). If the ligands can induce the binding of ERs to both coactivator and corepressor, the overall balance of the relative expression of coactivators and corepressors would become a critical determinant of their tissue-specific action. For example, Tam induces the recruitment of coactivators in endometrial adenocarcinoma (Ishikawa) cells, whereas it induces the recruitment of corepressors in breast cancer cells (Shang and Brown, 2002). In such a case, the agonistic effect of Tam is exhibited when a coactivator, SRC-1, is highly expressed (Shang and Brown, 2002). These studies provide a possible explanation for the different results in this study in comparison with other assays without coactivators or with other coregulators (Klinge, 2001; Ellison et al., 2003; Heery et al., 1997).
Promoter context has been proved to be another determinant of tissue-specific responses when hydroxy-Tam and Tam act on ERs (Shang and Brown, 2002). Ligand-bound ER can bind to the promoter of a target gene indirectly through a mechanism involving other transcriptional factors, resulting in the exertion of a
different estrogenic activity (Shang and Brown, 2002). Since our yeasts do not express other human transcriptional factors, this possibility would be eliminated. The agonistic and antagonistic activities shown in the current study inevitably resulted from the interaction of a given ER subtype interacting with ERE (one copy).
This study showed that the ERα and ERβ reporter yeasts have different responses to the test pharmaceuticals and are able to distinguish subtype-selective ligands. The EC50 of E2 in ERα and ERβ assay are 5.61×10⁻¹⁰ M and 3.50×10⁻¹⁰ M, respectively,
indicating their high sensitivity in response to ligands. These reporter yeasts are applicable for exploring ER subtype-specific therapeutic agents and for detecting pharmaceuticals which are leaked to environment and may act as endocrine disruptors.
2-4 River sample assay
2-4-1 Introduction
Yamoto River was chosen to examine whether the ERα and ERβ assay yeasts are applicable for detecting estrogenic activity of environmental samples. The river is one of the biggest watersheds in the western part of Japan, being 1070 km2, 68 km long
and is populated with about 2.15 million residents. It covers lots of area in Osaka and Nara Prefectures. In Fig. 2-18, points 1-3 locate in Osaka Prefecture while points 4 to 11 locate in Nara Prefecture. In points 5-7, there are some tributaries joined to the Yamato River. Along the Yamoto River, water samples were collected for investigating their estrogenic activities.
2-4-2 Materials and Methods
Water samples were collected from 11 localities along the Yamato River (Fig. 2-18) on December 5, 2007, and stored at 4˚C. Within one day after collection, each water sample (1 L) was filtered with a Whatman GF/C filter (Whatman International Ltd., Maidstone, U.K.), and passed through a Waters Sep-Pak Plus C18 Environmental
Ishi River Tatsuta River Saho River Yamato River Tera River Hatsuse Reservoir 1 5 3 2 4 6 7 8 9 10 11 Osaka Prefecture Nara Prefecture Hatsuse River (Yamato River) N Osaka Bay
Figure 2-18. The map showing the locations of water sampling. 1, Asakayama-Kouen, Asakayama 2-choume, Sakai-ku, Sakai City, Osaka; 2, Uriwari-oohasi, Uriwariminami 1-choume, Hiranoku, Osaka; 3, Kawachi Bridge, Houjouchou, Fujiidera City, Osaka; 4, Fujii Bridge, Oujichou, Kitakaturagi-gun, Nara; 5, Jinnan, Ikaruga-cho, Ikoma-gun, Nara (joined by Tatuta River); 6, Miyukio-ohasi, Kawai-cho, Kitakaturagi-gun, Nara (joined by Tomio River); 7, Itayagase Bridge, Nukatabeminami-cho, Yamatokooriyama City, Nara (joined by Saho River); 8, Umedo Bridge, Ooaza, Kawanisi-cho, Isobegun, Nara; 9, Hatta, Ooaza, Tawaramoto-cho, Siki-gun, Nara; 10, ZoudouJoufukuji, Ooaza, Tawaramoto-cho, Siki-gun, Nara; 11, Hatuse Dam, Ooaza, Sakurai City, Nara.
The cartridge was washed with 10 ml of pure water and the bound substances were eluted from the cartridges with 2 ml of dimethylsulfoxide (DMSO) at a flow rate of 1 ml/min, and then dried in a vacuum concentrator. The extract was redissolved in 200 μl of DMSO and stored at -80˚C. The concentration factor of this stock was 5,000 times and the stock was further diluted (10 times, 100 times and 1000 times respectively) for yeast reporter assays. The details of the assay were described in
Section 2-1-2-3. The E2 equivalent concentration (pmol/l) of river samples was calculated by the E2 standard curves of the ERα and ERβ yeast bioassay respectively. OD595 was measured everyday to check if there was any toxicity of the pollutants
which might affect the cell growth.
2-4-3 Results
The locations of river sample collection are shown in Fig. 2-18. Some estrogenic activity was detected at sampling points 1-6 in the ERα assay and points 1-5 in the ERβ assay (Fig. 2-19). The estrogenic activity of other upstream sampling points was under the detection limit (i.e. less than 0.04 pmol/L).
0 0.2 0.4 0.6 0.8 1 1.2 1 2 3 4 5 6 7 8 9 10 11 E2 e qui va le nt co n ce n trati o n (p m o l/ l) ERα ERβ Under detection limit
E2 dose‐dependent curve of ERalpha E2 dose‐dependent curve of ERbeta
0 0.1 0.2 0.3 0.4 0.5 0.6 ‐13 ‐12 ‐11 ‐10 ‐9 ‐8 ‐7 ‐6 ‐5 ‐4 Inc re as e of Indu ct ion E2 concentration (log) 0 0.1 0.2 0.3 0.4 0.5 0.6 ‐13 ‐12 ‐11 ‐10 ‐9 ‐8 ‐7 ‐6 ‐5 ‐4 Inc re as e of Indu ct ion E2 concentrarion (log)
Figure 2-19. The estrogenic activity of river samples was represented by the E2 equivalent concentration in pmol/l by ERα and ERβ yeast bioassay. The small graphs show the dose-dependent E2 curve of ERα and ERβ, respectively, for calculating the E2 equivalent concentration of river sample. Data are shown as the mean with S.D. from triplicate determinations.
The order of the estrogenic activity in the ERβ assay was: point 2> point 4>point 5>point 3>point 1, ranging from 0.12 to 1.05 pmol/L E2 equivalent concentration. Point 2 had the highest E2 equivalent concentration, about 1 pmol/L. Points 1-5 showed similar estrogenic activity in ERα assay, ranging from 0.16 to 0.35 pmol/L E2 equivalent concentration, while point 6 had the lowest activity detected, 0.04 pmol/l. Except for point 2 where ERβ had much higher activity than ERα, comparable activity was detected among both subtypes at other sampling points. The OD595 was