DISCUSSION PAPER No.104
日本の新規開業企業における
研究開発・イノベーション・パフォーマンス:
成熟企業との比較分析
R&D, innovation, and business performance of
Japanese start-ups:
A comparison with established firms
2013 年 12 月
文部科学省 科学技術・学術政策研究所
第1研究グループ
本 DISCUSSION PAPER は、所内での討論に用いるとともに、関係の方々からのご意見をい ただくことを目的に作成したものである。
また、本 DISCUSSION PAPER の内容は、執筆者の見解に基づいてまとめられたものであり、 機関の公式の見解を示すものではないことに留意されたい。
本報告書の引用を行う際には、出典を明記願います。 DISCUSSION PAPER No.104
R&D, innovation, and business performance of Japanese start -ups: A comparison with established firms
Kenta Ikeuchi and Hiroyuki Okamuro December 2013
1s t Theory-Oriented Research Grou p
National Institute of Science and Technology Policy (NISTEP) Ministry of Education, Culture, Sports, Science and Technology (MEXT)
日本の新規開業企業における研究開発・イノベーション・パフォーマンス : 成熟企業との比較分析 文部科学省 科学技術・学術政策研究所 第 1 研究グループ 池内 健太 岡室 博之 要旨 新規開業企業におけるイノベーション活動の重要性が認識されているにも関わらず、 これまで 成熟企業との比較の観点から分析を行った研究はほとんどない。そこで、本研究では、 3段階モ デルを用いて、研究開発集約度、イノベーション、企業パフォーマンスの決定要因について 、日 本の新規開業企業と成 熟企業の間で比較分析 を行った 。 その結果 、1) 公的資金助成には、研 究開発集約度を高める効果が見られるが、その効果は成熟企業に比べて新規開業企業では小 さいこと、2)大学や取引先企業との共同研究には、プロダクト・イノベーションやプロセス・イノベ ーションの生起確率を高める効果があり、その効果は成熟企業と比較して新規開業企業におい てより顕著であること 、3) プロダクト・ イノベーショ ン とプロセス・ イノベーショ ンには、 新規開業 企 業と成熟企業のいずれにおいても、労働生産性(の水準及び上昇率)を高める効果があること等 がわかった。
R&D, innovation, and business performance of Japanese start -ups: A comparison with established firms
Kenta Ikeuchi and Hiroyuki Okamuro, First Theory-Oriented Research Group, National Institute of Science and Technology Policy (NISTEP), MEXT ABSTRACT
Despite the importance of innovation activities in business start-ups, few studies have comprehensively compared these undertakings to equivalent ones in established firms. Therefore, we compare the determinants of R&D intensity, innovation, and firm performance in start-ups and established firms with a three-stage model, using comparable datasets in Japan. Estimation results suggest that 1) the effects of public financial support on R&D intensity are positive but smaller for start -ups; 2) the effects of research cooperation with business partners and universities on innovation are positive and larger for start -up; and 3) the effects of product and process innovation on labor productivity (level and growth) are positive both for start-ups and established firms.
i
‐概 要‐
背景・目的
ジョセフ・A・シュムペータ(Joseph A. Schumpeter)教授の先駆的な研究以降、起業家活動と イノベーションが経済成長の主要な源泉であると考えられてきた。しかしながら、新規開業企業 におけるイノベーション活動の特徴を包括的に分析した研究はほとんどない。そこで本研究では、 2009 年に科学技術政策研究所が実施した「全国イノベーション調査1」と2008 年から 2010 年に一 橋大学経済学研究科岡室研究室が実施した「新規開業企業アンケート調査2」の企業レベルの個票 データを用いて、イノベーション活動におけるインプットとアウトプットの決定要因、さらには イノベーションが企業のパフォーマンスに与える効果について、新規開業企業と成熟企業の間の 違いに注目して多面的な実証分析を行う。データ・分析方法
本研究の分析対象は、製造業またはソフトウェア業に属し、開業から2 年未満の企業(start-up firms、以下「新規開業企業」と呼ぶ)とその比較対象としての開業から 2 年以上経過している企 業(established firms、以下「成熟企業」と呼ぶ)である。新規開業企業については、2007 年 1 月 から2008 年 8 月までに新規に法人登録された全企業3に対して、アンケート調査を実施し(有効 回答率は10.6%)、2007 年 1 月以前に開業したと回答した企業を除いた約 900 社を分析対象とし た。次に、成熟企業については、「全国イノベーション調査」の2009 年の調査回答企業から開業 から2 年未満(調査対象年度の初期時点である 2006 年時点)の企業を除いた約 1500 社を分析対 象とした(有効回答率は約30%)。 本研究では、企業におけるイノベーション活動を包括的に分析するのに標準的に用いられる Crépon- Duguet- Mairesse(1998)の3段階モデルを採用する。このモデルでは、まず第1段階で イノベーション活動の主要なインプットとして研究開発支出の水準が決定され、次に第2段階で 研究開発の結果としてのイノベーションが創出される。さらに、第3段階としてイノベーション が企業のパフォーマンス(生産性や収益性等)に与える効果を分析する。この3段階モデルを用 いて、各段階の決定要因について、新規開業企業と成熟企業の間の違いを統計的に検証する(モ 1「全国イノベーション」は2003 年から始まった一般統計調査であり、文部科学省科学技術政策 研究所(現在の科学技術・学術政策研究所)が実施している。なお、本研究が分析に用いた2009 年の調査は第2 回目の調査結果である(科学技術政策研究所、2010)。 2本調査は日本学術振興会の助成を受けた研究プロジェクト「研究開発型企業のライフサイクルと イノベーションに関する定量的・定性的研究」(科学研究費補助金・基盤研究A、課題番号 20243018) の一環として実施された(岡室・池内、2009)。 3 株式会社東京商工リサーチの「TSR 新設法人情報ファイル」から抽出した。ii デルの概要を図1に示す)。特に、本研究において注目するのは、第1段階では公的資金助成(主 に、補助金の受け入れの有無4)と地域の研究開発人材が研究開発集約度に与える効果、第2段階 では研究開発集約度と大学や取引先企業との共同研究開発(イノベーション活動の外部連携)が プロダクト・イノベーション及びプロセス・イノベーションの生起確率に与える効果、第3段階 ではプロダクト・イノベーション/プロセス・イノベーションが労働生産性に与える効果の違い である。 概要図表 1:分析モデルの概要
本研究の分析結果とその政策的含意
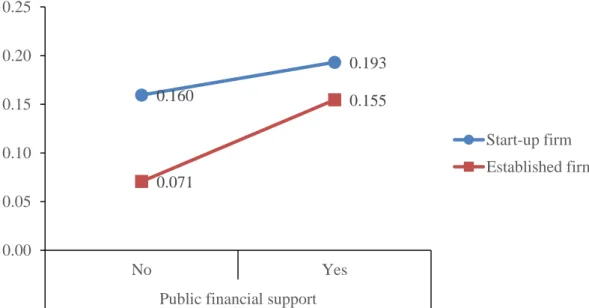
本研究で得られた主な分析結果は次の3点である。 1.公的資金助成には、研究開発集約度を高める効果が見られるが、その効果は成熟企業に比 べて新規開業企業では小さい(概要図表 2)。また、研究開発集約度が高い企業ほど、イ ノベーションの生起確率が高くなることも確認された。 2.取引先企業や大学との外部連携(共同研究)には、プロダクト・イノベーションやプロセ ス・イノベーションの生起確率を高める効果があり、それらの効果は成熟企業と比較して 新規開業企業においてより顕著である(概要図表 3 及び概要図表 4)。 4 「新規開業企業アンケート」では補助金のみ含まれ、「全国イノベーション調査」ではその他に も税控除や借入保証が含まれており、厳密な比較になっていないことは本研究の限界の1つであ る。 第1段階 第2段階 第3段階 プロダクト・イノベーション プロセス・イノベーション 労働生産性 研究開発集約度 公的資金助成 地域の研究開発人材 大学との共同研究 取引先企業との共同研究iii 3.プロダクト・イノベーションとプロセス・イノベーションには、新規開業企業と成熟企業 のいずれにおいても、労働生産性を高める効果がある(概要図表 5)。 これらの結果より、公的資金助成には研究開発集約度を高め、イノベーションを促進して、生 産性を高める効果があると期待される。一方、企業内部の研究開発活動のみならず、大学や取 引先企業との共同研究への取り組み(外部連携)もイノベーション創出を促進し、生産性を高 める効果を持つことがわかった。特に、新規開業企業では、成熟企業と比較して、公的資金助 成が研究開発集約度に与える効果が小さく、外部連携がイノベーション創出に与える効果は大 きいことから、新規開業企業のイノベーションを促進するためには、公的資金助成のみならず、 大学や取引先企業との共同研究を推進することが有効であると考えられる。 概要図表 2:公的資金助成の R&D 集約度に対する効果 出典)本文の Figure 1。
注)グラフの縦軸は R&D 集約度(従業者1人あたり R&D 投資額:百万円)であり、公的資金助成(Public financial support;税 控除、補助金、借入保証等)を受けているか、否か、各々の場合の予測値を、回帰分析の結果(本編 Table 3 の[4])に基づき、 新規開業企業(Start-up firm)と成熟企業(Established firm)のそれぞれについて示している。
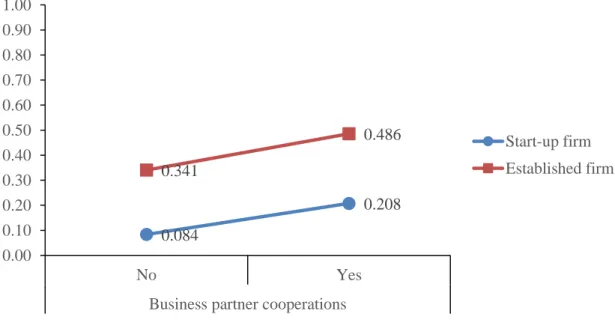
概要図表 3:取引先企業との外部連携がプロダクト・イノベーションに与える効果
出典)本文の Figure 5。
注)グラフの縦軸は3年間に1つ以上のプロダクト・イノベーションを導入する確率であり、取引先企業との外部連携(Business partner cooperation)を行っているか、否か、各々の場合の予測値を、回帰分析の結果(本編 Table 4 の[3])に基づき、新規開業 企業(Start-up firm)と成熟企業(Established firm)のそれぞれについて示している。
0.160 0.193 0.071 0.155 0.00 0.05 0.10 0.15 0.20 0.25 No Yes
Public financial support
Start-up firm Established firm 0.264 0.615 0.628 0.752 0.00 0.10 0.20 0.30 0.40 0.50 0.60 0.70 0.80 0.90 1.00 No Yes
Business partner cooperations
Start-up firm Established firm
iv
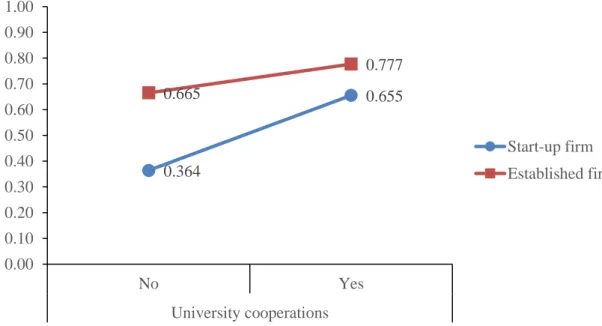
概要図表 4:大学との外部連携がプロダクト・イノベーションに与える効果
出典)本編の Figure 7。
注)グラフの縦軸は3年間に1つ以上のプロダクト・イノベーションを導入する確率であり、大学との外部連携(University cooperation)を行っているか、否か、各々の場合の予測値を、回帰分析の結果(本編 Table 4 の[3])に基づき、新規開業企業(Start-up firm)と成熟企業(Established firm)に分けて、それぞれ示している。
概要図表 5:イノベーションが労働生産性上昇率に与える効果
出典)本編の Figure 11。
注)グラフの縦軸は3年間の労働生産性上昇率であり、3年間にプロダクト・イノベーションまたはプロセス・イノベーショ ン(Product or process innovation)を1つ以上導入したか、否か、それぞれの場合における予測値を、回帰分析の結果(本編 Table 6 の[6])に基づき、新規開業企業(Start-up firm)と成熟企業(Established firm)に分けて示している。
参考文献
科学技術政策研究所(2010)『第2回全国イノベーション調査報告』NISTEP REPORT No.144。
岡室博之・池内健太(2009)『「第1回 新規開業企業アンケート調査」の集計結果報告書』
http://www.econ.hit-u.ac.jp/~hokamuro/hokoku20090413.pdf。
Crépon, Bruno, Emmanuel Duguet, and Jacques Mairesse. 1998. “Research, Innovation and Productivity: An Econometric Analysis at the Firm Level.” NBER Working Papers No.6696. 0.364 0.655 0.665 0.777 0.00 0.10 0.20 0.30 0.40 0.50 0.60 0.70 0.80 0.90 1.00 No Yes University cooperations Start-up firm Established firm -0.119 0.359 -0.248 0.081 -0.30 -0.20 -0.10 0.00 0.10 0.20 0.30 0.40 No Yes
Product or process innovation
Start-up firm Established firm
1
R&D, innovation, and business performance of Japanese
start-ups: A comparison with established firms
Kenta Ikeuchi
National Institute of Science and Technology Policy
Hiroyuki Okamuro Hitotsubashi University
National Institute of Science and Technology Policy
Keywords: R&D; innovation; productivity; start-up; established firms
1. Introduction
Since J. A. Schumpeter, entrepreneurship and innovation have been regarded as major sources of economic growth. Several empirical studies confirm the contribution of innovation to productivity growth (e.g., Crépon et al. 1998; Griffith et al. 2006; OECD 2009) and to employment growth (Hall et al. 2008; Lachenmaier and Rottmann 2011) at the firm level. Moreover, Acs and Armington (2004) and Audretsch and Keilbach (2005) demonstrate that entrepreneurial activities measured as the start-up ratio are a key factor for regional economic growth and productivity.
Despite the importance of innovation activities in business start-ups, few studies have comprehensively compared these undertakings to equivalent ones in established firms. Several empirical studies estimate the determinants of R&D input and outcomes by focusing on start-ups (Kato et al. 2013) or SMEs (Hall et al. 2009). Okamuro et al. (2011) analyze the determinants of R&D cooperation of business start-ups with business partners or universities. Okamuro (2009) compares the determinants of the propensity to conduct R&D and the R&D intensity of start-ups and all SMEs in the manufacturing sector. Huergo and Jaumandreu (2004a) find a nonlinear relationship between firm age and the probability of introducing an innovation. However, to the best of our knowledge, few studies comprehensively compare the determinants of R&D intensity, innovation, and firm performance of start-ups and established firms. In order to understand the characteristics and impact of innovation activities in start-ups, we should focus not only
2
on R&D input but also on innovation and its impact on firm performance in both start-ups and established firms.
Moreover, especially in Japan, despite the growing policy interests in innovation1,
there is little empirical research that employs the national innovation surveys, except for a few studies, such as Kwon et al. (2008) and Isogawa et al. (2012). Thus, this paper bridges these gaps by using comparable datasets from different surveys.
In sum, our empirical results suggest that 1) the effects of public financial support on R&D intensity are smaller for start-ups; 2) the effects of research cooperation with business partners or universities on innovation are larger for start-ups; and 3) the effects of product and process innovation on labor productivity (level and growth) are positive both for start-ups and established firms. These results imply that, in order to promote the innovation and growth of start-ups, we should provide them with more or better support to engage in research cooperation.
The remainder of this paper is organized as follows: We explain our data and estimation models in Sections 2 and 3. Subsequently, we present our empirical results in Section 4. We conclude the paper in Section 5.
2. Data
Based on the data sources, we distinguish start-ups from established firms as follows: The former are firms within two years of operation and the latter those with more than two years of operation.
We obtained data on start-ups from our original questionnaire survey series for Japanese start-ups that were carried out annually from 2008 to 2011. The first wave of this survey targeted 14,401 start-ups in the manufacturing and the software industry in Japan incorporated between January 2007 and August 2008; it was compiled by Tokyo Shoko Research (TSR), a major credit investigation company in Japan and based on the Corporation Register. Since our sample may also include the firms that were established earlier but incorporated after January 2007, we extracted the “real” start-ups, that is, those that were established during 2007 and 2008, using the survey response. We conducted the first postal survey in 2008 and received 1,514 responses, of which 1,060
1 Since the mid-1990s, the Japanese government has intensively promoted R&D and innovation with the “Science and Technology Basic Plans.” Implementation of the science-based science and technology policy is a new and important agenda in the fourth plan starting in 2011.
3 were “real” start-ups2.
We then carried out follow-up surveys in the successive years for the respondents of the previous year’s survey until 2011. For the empirical analysis of this paper, we extracted the respondent firms of the third survey in 2010 and excluded incomplete responses and some outliers. Thus, our final dataset of start-ups comprises 894 firms less than 2 years of age at time of the initial survey in 2008. We use the data from the third survey wave (and not the first one) to obtain sufficient information on innovation and firm performance and to secure comparability with the dataset of established firms. Comparable data of established firms (that comprises approximately 2,000 firms) were obtained from the Japanese National Innovation Survey 2009 (J-NIS 2009) conducted in 2009 by the National Institute of Science and Technology Policy (NISTEP), as official statistics carried out according to the Oslo Manual and the Community Innovation Survey 2010 (CIS2010) in the EU. The sample of the survey comprises the firms with more than ten employees and covers the entire manufacturing sector and most non-manufacturing sectors, including the software industry. In all, 15,871 firms were selected as our sample from the 331,037 firms in the list of the Establishment and Enterprise Census conducted in 2006 by the Statistics Bureau of the Ministry of Internal Affairs and Communications. Of 4,579 respondents, 1,993 firms could be classified as belonging to the manufacturing or the software industry. Excluding incomplete responses and some outliers in addition to young firms less than 2 years of age, our final dataset of established firms comprises 1,517 firms that had at least 2 years of operation at time of the initial survey year, 2006.
Table 1 shows the simple comparison between start-ups and established firms in our datasets: The former are 1) less likely to conduct R&D, but more R&D intensive on average; 2) less likely to cooperate with business partners, universities, or public research institutes, but more dependent on the information from competitors; 3) less likely to innovate; and 4) more likely to grow faster, but less productive and profitable.
(Insert Table 1)
Table 2 shows the correlation matrix of the variables. It reveals that, while labor
4
productivity is positively associated with product and process innovation, the correlation of the growth rate of labor productivity with product and process innovation is negligible. Productivity and profitability are positively correlated each other. Profitability is positively correlated with product innovation but negatively correlated with process innovation. R&D input is positively associated with productivity, profitability and product, and process innovation. Geographic factors, such as the expert ratio (the ratio of professionals in the workforce) and the density of industry and university, are also positively correlated with R&D intensity.
(Insert Table 2)
3. Model
We simultaneously examine the differences between start-up firms and established firms in the determinants of innovation input (R&D intensity) and output (introduction of new products and processes) and firm performance (productivity and profitability). For this purpose, we employ a three-stage model proposed by Crepon et al. 1998 (see also OECD 2009) in order to consider the selectivity and endogeneity issues. In the first stage, R&D intensity measured as the ratio of R&D expenditures per person (in natural logarithm) is determined. In the second stage, we investigate the relationship between innovation input (R&D intensity) and output, distinguishing between product and process innovation and considering the effect of R&D cooperation. In the third and final stage, we examine the effects of innovation output on firm performance, measured as the level and growth rate of labor productivity and the positive profit dummy.
3.1. First stage: R&D intensity model
We assume that the R&D intensity of firms, defined as R&D expenditures per employee, is determined by two equations: the generalized Tobit model (Heckman, 1976, 1979). Firms decide at first whether or not they engage in R&D activity (the first equation) and then determine the relative level of R&D expenditures (the second equation). We use the same set of factors as explanatory variables for both equations, but estimate different sets of coefficients for each equation. We focus on the differences between start-up and established firms with respect to the effects of public financial support and
5
local accessibility to research personnel. In addition, we control for the effects of firm size and age, the differences between affiliated and independent firms, industry-specific effects, and the density of businesses and universities in the municipality and prefecture where the firms’ headquarters are located.
3.2. Second stage: Innovation model
Firms generate new products and processes as innovation outputs. In this regard, we distinguish between product innovation (the generation of new or significantly improved products) and process innovation (the implementation of new or significantly
improved production method)3. As the determinants of innovations, the predicted values
of R&D intensity in the first stage are a main variable. In addition, Robin and Schubert (2013) have recently found a positive effect of cooperation with public research institutes on the probability of introducing product innovation but no effect on process innovation. As shown in Belderbos et al. (2004), supplier and customer firms and competitors might be also important as collaboration partners and external knowledge sources. Therefore, we first distinguish the cooperation with universities and firms with supplier/customer relationships. Second, we examine the effects of external knowledge from competitors by utilizing a survey question on the importance of competitors as information sources in R&D (innovation) activity. We then examine the difference in the magnitude of effects of those cooperation and external knowledge from competitors on innovation between start-ups and established firms.
3.3. Third stage: Performance model
Finally, to validate the measurement of our indicators for innovations and to access the differences in an economic impact of innovations between start-ups and established firms, we estimate the effects of product and process innovation on firm economic performance, such as the levels or growth rates of labor productivity and profitability. As the proxy for productivity, we employ labor productivity. Since our dataset of
3 According to Oslo Manual (OECD 2005), process innovation covers not only the
implementation of a new or significantly improved production methods but also that of new or significantly improved delivery methods and techniques, equipment, and software in ancillary support activities. Since the survey for start-ups did not consider the latter two types of process innovation, we regard only the implementation of a new production method as process innovation.
6
startups does not consist of physical capital accumulation and the input of materials, we cannot measure the total factor productivity and also not control for capital intensity or intermediate inputs. Instead, we include several control variables: initial employment size, age, affiliated firm dummy, and initial labor productivity level. Our choice of the proxy for profitability is also limited because of a lack of detailed financial information. We use a dummy variable that takes the value of one, if the firm’s (operating) profit is positive4.
Product and process innovation may be complimentary. However, a marginally strong correlation between these two types of innovations (0.306 as shown in Table 2) might make it difficult to identify the effects of these two types of innovations. To explore the relevant specification, we examine several approaches: First, we inspect the predicted probability that the firm introduces either the product or process innovation as an explanatory variable. Second, we include the predicted probabilities of product innovation and process innovation, alternately or independently, as explanatory variables. Third, we include the predicted probability of product innovation only, process innovation only, and product and process innovations together as explanatory variables.
4. Results
Table 3 shows the estimation results of the generalized Tobit model for R&D intensity. For each specification, the first column shows the coefficients of the probit model in which the dependent variable is a dummy variable for R&D conducting firms, and the second column reports the coefficients of linear model of the level of R&D intensity. In addition, in the last row, the correlation coefficients of the residuals of two equations are reported for each specification. The results show the positive effects of initial labor productivity on both the selection equation and R&D intensity and the positive effects of employment size and firm age on only R&D intensity. Affiliated firms conduct R&D investment at a higher probability, but their R&D intensity is lower than that of independent firms. Public financial support and the expert ratio in local labor market increase the probability of R&D investment and the R&D intensity of firms (see Figure
4 For the startups, we cannot identify the firms’ answers to the profitability question
7
1 and 2). The geographic agglomeration of industry and university have no effects on either the selection or the intensity of R&D. Interestingly, the effects of public support on both the selection and intensity of R&D are significantly smaller for start-ups than established firms, while we do not find significant difference of the effects of the expert ratio between these groups.
(Insert Table 3) (Insert Figure 1 and 2)
Table 4 shows the second stage results of the bivariate probit model for product and process innovation. For each specification, we report the coefficients of the product innovation equation and those of the process innovation equation in the first column and the second column, respectively. The effects of predicted R&D intensity are significantly positive on product innovation (see Figure 3) but not on process innovation (see Figure 4). We find the positive effects of collaboration with business partners (see Figure 5 and 6) and universities (see Figure 7 and 8) both on product and process innovation while the information from competitors affect only product innovation (Figure 9 and 10). Firm size has positive effects, but firm age has no effect. Affiliated firms have a lower probability of product innovation but there is no significant difference in the probability of process innovation between affiliated and independent firms. We find several significant differences in the effects of collaboration with partner firms and universities and in information from competitors on innovation between start-ups and established firms: the positive effects of collaboration with business partners (supplier and client) and universities on product innovation are greater in start-ups than in established firms, while the effect of information from competitors on product innovation is lower in start-ups than in established firms. Collaborations with universities also increase the probability of process innovation more in start-ups than in established firms. As the same as in the first stage of the R&D intensity model, we do not find any significant effects of geographic agglomeration factors on innovations.
(Insert Table 4) (Insert Figure 3-10)
8
Table 5-7 reports the third stage results of the firm performance model with three different dependent variables: the level of labor productivity in Table 5, the growth rate of labor productivity in Table 6, and profitability in Table 7. While the models shown in first five columns of Table 5 and Table 6 estimate the common coefficients for start-ups and established firms, the models in the successive five columns (6-10), include the interaction terms of these innovation indicators with start-up firm dummy. In those tables, the last two columns examine the direct effects of R&D intensity on productivity.
The results in column [1] to [3] in Table 5 show that positive effects of product and process innovation on the level of labor productivity, controlling for effects of scale economy and affiliated firms. When we jointly include product and process innovation in the specification [4] and [5] of Table 5, however, the coefficient of process innovation turn negative. The effects of process innovation on productivity are also controversial in the literature. On the one hand, OECD (2009) consistently reports the significantly negative coefficients of process innovation on productivity of 18 countries, while the coefficients of product innovation are jointly estimated as positive. On the other hand, Griffith et al. (2006) report the significantly positive effects of process innovation and product innovation, using capital investment intensity only as an instrumental variable for process innovation5.
(Insert Table 5)
We also find the negative coefficients of the interaction terms between the start-up firm dummy and product and process innovations. These imply that the effects of product or process innovation are smaller in start-ups than in established firms. In column [11] and [12], we also see the significant effects of predicted R&D intensity on productivity. These imply that our innovation indicators might not capture the whole effects of R&D.
Table 6 shows the estimation results for the growth rate of labor productivity rather than the level of labor productivity, as in Table 5. In general, there are not large
5 Hall et al. (2009) confirms that the effect of process innovation on productivity is
estimated as significantly positive only when they instrument it by capital investment intensity and do not include capital investment intensity in the productivity equation; otherwise, it is estimated as negative or positive but not as significant.
9
differences in the results on the effects of process innovation and interaction terms between start-ups and product and/or process innovations. The results in column [1] to [3] in Table 6 show the positive effects of product and process innovation on the labor productivity growth. We also find no significant coefficients of the interaction terms between the start-up firm dummy and product and process innovations in column [6] to [8] in Table 6. These imply that the effects of product or process innovation are positive and not significantly different in start-ups and in established firms (Figure 11 illustrates these relationships).
(Insert Table 6) (Insert Figure 11)
But in column [4] we find no significant coefficient when we jointly include product and process innovation, and in column [5] we find a significant positive coefficient only on joint introduction of product and process innovations. These results indicate the strong complementarity of product and process innovation. Moreover, the results in column [10] indicate that this complementarity works more in start-ups than in established firms. In particular, the result indicates that, for start-ups, labor productivity growth rate falls when they introduce process innovation but not product innovation.
The first six columns in Table 7 show the estimation results of profitability equation without control variables, and the last four columns of this table display the results with control variables. The results without control variables have almost the same implications as the results for labor productivity growth: the positive and significant effects of product and process innovation, when they are not distinguished (column [1]) or included independently (column [2] and [3]); but no significant coefficients when they are jointly included (column [4]) and when they complement each other (column [5]). We find no significant difference between start-ups and established firms in the effects of innovation on profitability (column [6]). However, these significant results disappear when we add one of the control variables (column [7] to [10]): firm age, size, or initial labor productivity. Since we use a dummy and not a continuous variable for profitability, the data may not have sufficient variation to identify these effects.
10
5. Conclusion
In this paper, we empirically examined the differences between start-ups and established firms with respect to determinants of R&D and innovation and the relationship between innovation and firm performance using a comprehensive datasets derived from two surveys on innovation activities in Japanese private firms in the last years of the first decade of the new century; one is the survey of start-ups and another is the Japanese national innovation survey. Our empirical results suggest that 1) the effects of public financial support on R&D intensity are generally positive but smaller for start-ups, 2) the effects of research cooperation with business partners or universities on innovation are generally positive but larger for start-ups, and 3) the effects of product and process innovation on labor productivity (level and growth) are positive both for start-ups and established firms.
However, our research has several limitations: First, an appropriate correction for the reported standard errors is needed. Second, we should examine the correction for endogeneity in public subsidies and R&D cooperation. Third, we ignore differences in the intensity, magnitude, or quality of innovations between firms.
Despite these limitations, our empirical results imply that in order to promote innovation and growth of start-ups, we should provide more or better support for start-ups to engage in research cooperation with both business partners and universities, rather than the financial support. In general, start-up firms have scarce internal knowledge and R&D stock compared to established or mature firms, despite their greater incentives for innovation; and they rely heavily on external knowledge and research collaboration with others. Our findings indicate that governments can accelerate innovation and productivity growth more efficiently by promoting research collaborations between start-up firms and universities and between start-ups and their business partners, rather than by increasing public financial supports for start-ups.
11
References
Acs, Zoltan J, and Catherine Armington. 2004. “Employment Growth and Entrepreneurial Activity in Cities.” Regional Studies 38: 911–927.
Audretsch, David B, and Max Keilbach. 2005. “Entrepreneurship Capital and Regional Growth.” Annals of Regional Science 39 (3): 457–469.
Belderbos, Rene, Martin Carree, and Boris Lokshin. 2004. “Cooperative R&D and Firm Performance.” Research Policy 33 (10): 1477–1492.
Carree, Martin, Boris Lokshin, and Rene Belderbos. 2006. “Complementarity in R&D Cooperation Strategies.” Review of Industrial Organization 28 (4): 401–426.
Cefis, Elena, and Orietta Marsili. 2006. “Survivor: The Role of Innovation in Firms’ Survival.” Research Policy 35 (5): 626–641.
Crépon, Bruno, Emmanuel Duguet, and Jacques Mairesse. 1998. “Research, Innovation and Productivity: An Econometric Analysis at the Firm Level.” NBER Working Papers No.6696.
Griffith, Rachel, Elena Huergo, Jacques Mairesse, and Bettina Peters. 2006. “Innovation and Productivity Across Four European Countries.” Oxford Review of Economic Policy 22 (4): 483–498.
Hall, Bronwyn H, Francesca Lotti, and Jacques Mairesse. 2008. “Employment, Innovation, and Productivity: Evidence from Italian Microdata.” Industrial and Corporate Change 17 (4): 813– 839.
———. 2009. “Innovation and Productivity in SMEs: Empirical Evidence for Italy.” Small Business Economics 33 (1): 13–33.
Haneda, Shoko, and Keiko Ito. 2013. “Modes of International Activities and the Innovativeness of Firms : An Empirical Analysis Based on the Japanese National Innovation Surveys for 2003 and 2009.” NISTEP Discussion Paper No. 94.
Harrison, Rupert, Jordi Jaumandreu, Jacques Mairesse, and Bettina Peters. 2008. “Does Innovation Stimulate Employment? A Firm-Level Analysis Using Comparable Micro-Data from Four European Countries.” NBER Working Papers No. 14216.
Haskel, Jonathan E, Matthew J Slaughter, Chand Jones, Wolfgang Keller, James Markusen, Steve Nickell, Amil Petrin, and John Van Reenen. 2005. “Global Engagement and the Innovation Activities of Firms.” NBER Working Papers No. 11479.
Heckman, James J. 1976. “The Common Structure of Statistical Models of Truncation, Sample Selection and Limited Dependent Variables and a Simple Estimator for Such Models.” Annals of Economic and Social Measurement 5 (4): 475–492.
12
Huergo, Elena, and Jordi Jaumandreu. 2004a. “How Does Probability of Innovation Change with Firm Age ?” Small Business Economics 22: 193–207.
———. 2004b. “Firms’ Age, Process Innovation and Productivity Growth.” International Journal of Industrial Organization 22 (4): 541–559.
Isogawa, Daiya, Kohei Nishikawa, and Hiroshi Ohashi. 2012. “New-to-Market Product Innovation and Firm Performance: Evidence from a Firm-Level Innovation Survey in Japan.” RIETI Discussion Paper Series No. 12-E-077.
Kato, Masatoshi, Hiroyuki Okamuro, and Yuji Honjo. 2013. “Does Founders’ Human Capital Matter for Innovation? Evidence from Japanese Start-Ups,” forthcoming in the Journal of Small Business Management.
Kwon, Hyeog Ug, Kyoji Fukao, and YoungGak Kim. 2008. “Innovation and Productivity Growth: An Empirical Analysis Based on Micro Data of the Basic Survey of Business Structure and Activity and the Japanese National Innovation Survey.” Global COE Hi-Stat Discussion Paper Series No. gd08-002.
Lachenmaier, Stefan, and Horst Rottmann. 2011. “Effects of Innovation on Employment: A Dynamic Panel Analysis.” International Journal of Industrial Organization 29 (2): 210–220.
Mairesse, Jacques, and Pierre Mohnen. 2002. “Accounting for Innovation and Measuring Innovativeness: An Illustrative Framework and an Application.” American Economic Review 92 (2): 226–230. ———. 2010. “Using Innovations Surveys for Econometric Analysis.” NBER Working Papers No.
15857.
Mohnen, Pierre, Jacques Mairesse, and Marcel Dagenais. 2006. “Innovativity: A Comparison Across Seven European Countries.” Economics of Innovation and New Technology 15 (4-5): 391–413. OECD. 2005. Oslo Manual: Guidelines for Collecting and Interpreting Innovation Data. 3rd ed. OECD
Publishing.
———. 2009. Innovation in Firms: A Microeconomic Perspective. OECD Publishing.
Okamuro, Hiroyuki. 2009. “Determinants of R&D Activities by Start-up Firms: Evidence from Japan.” In Small Business: Innovation, Problems and Strategy, edited by J. E. Michaels and L. F. Piraro, 27– 44. New York: Nova Science Publishers.
Okamuro, Hiroyuki, Masatoshi Kato, and Yuji Honjo. 2011. “Determinants of R&D Cooperation in Japanese Start-Ups.” Research Policy 40 (5): 728–738.
Ornaghi, Carmine. 2006. “Spillovers in Product and Process Innovation: Evidence from Manufacturing Firms.” International Journal of Industrial Organization 24: 349–380.
13
Robin, Stéphane, and Torben Schubert. 2013. “Cooperation with Public Research Institutions and Success in Innovation: Evidence from France and Germany.” Research Policy 42 (1) (July): 149– 166.
16
Notes: Robust standard errors are in brackets. ***, ** and * indicate significance at the 1%, 5% and 10% levels, respectively.
Table 3. First stage results for R&D intensity (Generalized tobit model - ML estimation) Dependent variable: positive R&D dummy and log of R&D per employee
Dependent variable R&D>0 R&D int. R&D>0 R&D int. R&D>0 R&D int. R&D>0 R&D int. R&D>0 R&D int. Initial labor productivity 0.405*** 0.121*** 0.428*** 0.125*** 0.429*** 0.127*** 0.435*** 0.128*** 0.439*** 0.128*** [0.081] [0.034] [0.080] [0.034] [0.079] [0.034] [0.080] [0.034] [0.080] [0.034] Initial employment size -0.072 0.188*** -0.077 0.190*** -0.073 0.197*** -0.078 0.196*** -0.073 0.196***
[0.053] [0.024] [0.053] [0.024] [0.053] [0.024] [0.053] [0.024] [0.053] [0.024] Age -0.137** 0.010 0.143 0.108*** 0.143 0.114*** 0.149* 0.117*** 0.154* 0.113***
[0.058] [0.026] [0.088] [0.041] [0.088] [0.041] [0.088] [0.041] [0.089] [0.042] Affiliated (dummy) 0.523*** -0.152** 0.548*** -0.154** 0.542*** -0.160** 0.535*** -0.161** 0.526*** -0.163**
[0.150] [0.071] [0.147] [0.071] [0.147] [0.071] [0.148] [0.071] [0.148] [0.071] Public financial support (dummy) 0.504*** 0.203*** 0.498*** 0.208*** 0.695*** 0.404*** 0.685*** 0.404*** 0.694*** 0.407***
[0.136] [0.067] [0.135] [0.067] [0.161] [0.092] [0.160] [0.093] [0.161] [0.093] Expert ratio – city 5.414** 3.429*** 5.235** 3.390*** 4.987** 3.226*** 7.009** 3.860** 7.575*** 3.882** [2.441] [1.201] [2.427] [1.208] [2.407] [1.210] [2.823] [1.541] [2.883] [1.600] Expert ratio – prefecture 1.477 7.886** 1.641 7.947*** 1.901 8.007*** -0.455 8.028** 0.537 3.637
[5.963] [3.069] [5.916] [3.083] [5.919] [3.090] [6.597] [3.497] [7.248] [3.998] Industry density – city 0.000 0.000 0.000 0.000 0.000 0.000 0.001 0.000 0.002 -0.001 [0.004] [0.002] [0.004] [0.002] [0.004] [0.002] [0.004] [0.002] [0.005] [0.002] Industry density – prefecture -0.080 -0.038 -0.088 -0.039 -0.084 -0.037 -0.089 -0.036 -0.135 -0.059 [0.077] [0.037] [0.076] [0.037] [0.076] [0.037] [0.076] [0.038] [0.091] [0.051] Univ. density – city 0.126 0.559 0.281 0.594 0.269 0.609 0.340 0.629 0.119 0.579
[0.929] [0.433] [0.941] [0.437] [0.933] [0.440] [0.919] [0.441] [1.028] [0.619] Univ. density – prefecture 26.206* -7.254 23.433* -8.149 22.781 -8.113 22.114 -8.223 22.364 5.084
[14.033] [6.940] [13.923] [6.984] [13.891] [6.996] [13.828] [7.010] [16.087] [8.937] Start-up (dummy) 1.219*** 0.402*** 1.388*** 0.549*** 1.291 0.796* 1.819 -0.642 [0.271] [0.125] [0.286] [0.137] [0.965] [0.456] [1.585] [0.774] Start-up x Public financial support -0.505* -0.401*** -0.510* -0.402*** -0.512* -0.404***
[0.291] [0.136] [0.293] [0.136] [0.294] [0.136] Start-up x Expert ratio – city -5.823 -1.519 -6.541 -1.604 [4.542] [2.159] [4.976] [2.408] Start-up x Expert ratio – prefecture 6.816 -0.106 3.418 11.498* [7.860] [3.849] [12.400] [6.269]
Start-up x Industry density – city -0.004 0.002
[0.007] [0.003]
Start-up x Industry density – prefecture 0.093 0.072
[0.141] [0.068]
Start-up x Univ. density – city 0.544 0.053
[2.039] [0.880]
Start-up x Univ. density – prefecture 1.272 -34.268**
[27.853] [13.965] Constant -4.999*** -2.773*** -5.958*** -3.105*** -6.002*** -3.194*** -5.961*** -3.293*** -6.236*** -2.736***
[0.933] [0.408] [0.977] [0.421] [0.983] [0.424] [1.020] [0.458] [1.093] [0.517] Industry dummies (2 digit) Yes Yes Yes Yes Yes Yes Yes Yes Yes Yes
# of observations 2,163 2,163 2,163 2,163 2,163
# of firms no R&D 1301 1301 1301 1301 1301
Chi-squared (statistics) 328.2231 347.5391 356.9189 355.8323 357.3385 Chi-squared (p-value) 0.000 0.000 0.000 0.000 0.000 Correlation between errors 0.543 0.533 0.528 0.526 0.551
17
Figure 1: Marginal effects of public financial support on R&D intensity
Notes: The vertical axis is the predicted value of R&D expenditure (in 1 million yen) per person. The predicted values are calculated from the estimation results of column [4] in Table 3 at the mean values of the remaining covariates.
Figure 2: Marginal effects of expert ratio in city on R&D intensity
Notes: The vertical axis is the predicted value of R&D expenditure (in 1 million yen) per person. The predicted values are calculated from the estimation result of column [4] in Table 3 at the mean values of the remaining covariates.
0.160 0.193 0.071 0.155 0.00 0.05 0.10 0.15 0.20 0.25 No Yes
Public financial support
Start-up firm Established firm 0.119 0.167 0.230 0.066 0.089 0.118 0.00 0.05 0.10 0.15 0.20 0.25 10% 15% 20% Expert ratio (city)
Start-up firm Established firm
18
Notes: Robust standard errors are in brackets. ***, ** and * indicate significance at the 1%, 5% and 10% levels, respectively.
Table 4. Second stage results for product and process innovation (bivariate probit model - ML estimation)
Dependent variables: Dummy variables indicating the introduction of product innovation and process innovation
Dependent variable Product Process Product Process Product Process
Predicted R&D intensity 0.169*** -0.057 0.186** -0.001 0.283*** 0.039
[0.065] [0.067] [0.082] [0.086] [0.091] [0.089] Collaboration with business partners (dummy) 0.565*** 0.443*** 0.567*** 0.433*** 0.355*** 0.375***
[0.076] [0.079] [0.076] [0.079] [0.098] [0.095] Collaboration with universities (dummy) 0.467*** 0.236** 0.467*** 0.231** 0.336*** 0.109
[0.105] [0.095] [0.105] [0.095] [0.124] [0.111] Information from competitors (dummy) 0.213*** 0.024 0.207*** 0.023 0.344*** 0.086
[0.077] [0.078] [0.077] [0.078] [0.101] [0.093]
Initial employment size 0.150*** 0.081*** 0.153*** 0.089*** 0.167*** 0.097***
[0.029] [0.028] [0.029] [0.029] [0.030] [0.030] Age 0.074 0.062 0.066 0.052 0.065 0.054 [0.050] [0.048] [0.051] [0.050] [0.051] [0.052] Affiliated (dummy) -0.198** -0.104 -0.206** -0.141 -0.235** -0.164 [0.098] [0.098] [0.102] [0.103] [0.106] [0.106] Start-up (dummy) -0.069 -0.200 -0.104 -0.253 -0.635** -0.460 [0.163] [0.174] [0.172] [0.184] [0.289] [0.308]
Start-up x Predicted R&D intensity -0.178* -0.050
[0.094] [0.101]
Start-up x Collaboration with business partners 0.568*** 0.192
[0.157] [0.175]
Start-up x Collaboration with universities 0.412* 0.473**
[0.229] [0.224]
Start-up x Information from competitors -0.277* -0.137
[0.160] [0.177]
Industry density – city -0.001 -0.004* -0.001 -0.004
[0.002] [0.002] [0.002] [0.003]
Industry density – prefecture 0.016 0.075 0.020 0.074
[0.044] [0.048] [0.045] [0.048]
Univ. density – city -0.754 0.315 -0.795 0.320
[0.486] [0.461] [0.506] [0.540]
Univ. density – prefecture 2.538 -9.868 2.825 -9.821
[6.380] [6.329] [6.571] [6.581]
Constant -0.342 -1.287*** -0.271 -1.074*** 0.039 -0.940**
[0.324] [0.335] [0.391] [0.406] [0.400] [0.407]
Industry dummies (2 digit) Yes Yes Yes Yes Yes Yes
# of observations 1,382 1,382 1,382
Chi-squared (statistics) 446.021 456.576 470.224
Chi-squared (p-value) 0.000 0.000 0.000
Correlation between errors 0.367 0.366 0.360
19
Figure 3: Marginal effects of R&D intensity on product innovation
Notes: The vertical axis is the predicted probability to have a product innovation. The predicted values are calculated from the estimation result of column [3] in Table 4 at the mean values of the remaining covariates.
Figure 4: Marginal effects of R&D intensity on process innovation
Notes: Vertical axis is the predicted probability to have a process innovation. Predicted values are calculated from the estimation result of column [3] in Table 4 at the mean values of the remaining covariates. 0.346 0.467 0.592 0.621 0.877 0.978 0.00 0.10 0.20 0.30 0.40 0.50 0.60 0.70 0.80 0.90 1.00 -3 0 3
R&D intensity in log.
Start-up firm Established firm 0.128 0.121 0.115 0.407 0.453 0.499 0.00 0.10 0.20 0.30 0.40 0.50 0.60 0.70 0.80 0.90 1.00 -3 0 3
R&D intensity in log.
Start-up firm Established firm
20
Figure 5: Marginal effects of business partner cooperation on product innovation
Notes: The vertical axis is the predicted probability to have a product innovation. The predicted values are calculated from the estimation result of column [3] in Table 4 at the mean values of the remaining covariates.
Figure 6: Marginal effects of business partner cooperation on process innovation
Notes: The vertical axis is the predicted probability to have a process innovation. The predicted values are calculated from the estimation result of column [3] in Table 4 at the mean values of the remaining covariates. 0.264 0.615 0.628 0.752 0.00 0.10 0.20 0.30 0.40 0.50 0.60 0.70 0.80 0.90 1.00 No Yes
Business partner cooperations
Start-up firm Established firm 0.084 0.208 0.341 0.486 0.00 0.10 0.20 0.30 0.40 0.50 0.60 0.70 0.80 0.90 1.00 No Yes
Business partner cooperations
Start-up firm Established firm
21
Figure 7: Marginal effects of university cooperation on product innovation
Notes: the vertical axis is the predicted probability to have a product innovation. The predicted values are calculated from the estimation result of column [3] in Table 4 at the mean values of the remaining covariates.
Figure 8: Marginal effects of university cooperation on process innovation
Notes: The vertical axis is the predicted probability to have a process innovation. The predicted values are calculated from the estimation result of column [3] in Table 4 at the mean values of the remaining covariates. 0.364 0.655 0.665 0.777 0.00 0.10 0.20 0.30 0.40 0.50 0.60 0.70 0.80 0.90 1.00 No Yes University cooperations Start-up firm Established firm 0.111 0.261 0.407 0.449 0.00 0.10 0.20 0.30 0.40 0.50 0.60 0.70 0.80 0.90 1.00 No Yes University cooperations Start-up firm Established firm
22
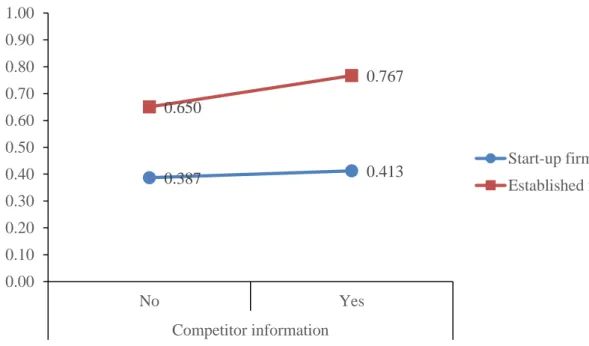
Figure 9: Marginal effects of competitor information on product innovation
Notes: The vertical axis is the predicted probability to have a product innovation. The predicted values are calculated from the estimation result of column [3] in Table 4 at the mean values of the remaining covariates.
Figure 10: Marginal effects of competitor information on process innovation
Notes: The vertical axis is the predicted probability to have a process innovation. The predicted values are calculated from the estimation result of column [3] in Table 4 at the mean values of the remaining covariates. 0.387 0.413 0.650 0.767 0.00 0.10 0.20 0.30 0.40 0.50 0.60 0.70 0.80 0.90 1.00 No Yes Competitor information Start-up firm Established firm 0.130 0.120 0.405 0.439 0.00 0.10 0.20 0.30 0.40 0.50 0.60 0.70 0.80 0.90 1.00 No Yes Competitor information Start-up firm Established firm
23 Notes: Robust standard errors are in brackets. ***, ** and * indicate significance at the 1%, 5% and 10% levels, respectively.
Table 5. Third stage results for performance (1) : Level of labor productivity (linear model - OLS estimation) Dependent variable: Log. of labor produtivity
[1] [2] [3] [4] [5] [6] [7] [8] [9] [10] [11] [12] Product or process innovation (predicted probability) 1.088*** 1.670*** 0.447** 0.284
[0.221] [0.309] [0.201] [0.287]
Product innovation (predicted probability) 1.119*** 1.560*** 1.510*** 2.263*** [0.193] [0.285] [0.254] [0.359] Process innovation (predicted probability) 0.865*** -0.927** 0.956*** -1.340***
[0.292] [0.421] [0.301] [0.438] Product innovation only (predicted probability) 1.224*** 2.077***
[0.354] [0.552]
Process innovation only (predicted probability) -2.426*** -3.108***
[0.931] [1.179]
Product and process innovation (predicted probability) 0.560* 0.502
[0.294] [0.365]
Start-up (dummy) 0.214 -0.054 -0.096 -0.111 0.200 -1.078*** -1.248*** [0.242] [0.204] [0.161] [0.203] [0.382] [0.133] [0.299]
Start-up x Product or process innovation -0.891** 0.242
[0.397] [0.346]
Start-up x Product innovation -0.606* 0.123
[0.360] [0.477]
Start-up x Process innovation -0.430 -2.006***
[0.487] [0.694]
Start-up x Product innovation only -0.779
[0.788]
Start-up x Process innovation only -8.436***
[2.448]
Start-up x Product and process innovation -0.409
[0.600]
Predicted R&D intensity 0.707*** 0.720***
[0.051] [0.054]
Start-up x Predicted R&D intensity -0.021
[0.078] Initial employment size 0.091*** 0.081*** 0.120*** 0.088*** 0.086*** 0.067** 0.058** 0.117*** 0.065** 0.072*** 0.114*** 0.120***
[0.028] [0.028] [0.028] [0.028] [0.028] [0.028] [0.028] [0.028] [0.028] [0.027] [0.024] [0.024] Age 0.011 0.019 0.011 0.038 0.050* -0.063 -0.062 -0.032 -0.067* -0.067* -0.129*** -0.124*** [0.029] [0.029] [0.029] [0.029] [0.030] [0.038] [0.038] [0.038] [0.038] [0.038] [0.035] [0.037] Affiliated (dummy) 0.363*** 0.362*** 0.363*** 0.339*** 0.337*** 0.359*** 0.357*** 0.357*** 0.309*** 0.278*** -0.077 -0.085 [0.067] [0.067] [0.068] [0.067] [0.067] [0.067] [0.067] [0.068] [0.066] [0.067] [0.066] [0.064] Constant 1.379*** 1.462*** 1.694*** 1.457*** 1.676*** 1.302*** 1.576*** 1.812*** 1.603*** 1.912*** 4.692*** 4.808*** [0.165] [0.151] [0.153] [0.150] [0.208] [0.209] [0.184] [0.188] [0.182] [0.329] [0.306] [0.337] Industry dummies (2 digit) Yes Yes Yes Yes Yes Yes Yes Yes Yes Yes Yes Yes # of observations 897 897 897 897 897 897 897 897 897 897 897 897 F-test (statistics) 16.5 17.3 16.1 16.8 18.4 17.3 18.0 15.6 17.6 18.1 29.9 28.2 F-test (p-value) 0.000 0.000 0.000 0.000 0.000 0.000 0.000 0.000 0.000 0.000 0.000 0.000 R-squared 0.387 0.392 0.374 0.396 0.398 0.393 0.399 0.376 0.413 0.422 0.524 0.525
24 Notes: Robust standard errors are in brackets. ***, ** and * indicate significance at the 1%, 5% and 10% levels, respectively.
Table 6. Third stage results for performance (2): Growth rate of labor productivity (linear model - OLS estimation) Dependent variable: Growth rate of labor produtivity
[1] [2] [3] [4] [5] [6] [7] [8] [9] [10] [11] [12] Product or process innovation (predicted probability) 0.417** 0.329* 0.421** 0.099
[0.172] [0.178] [0.174] [0.184]
Product innovation (predicted probability) 0.369** 0.210 0.261* 0.060 [0.153] [0.220] [0.142] [0.208] Process innovation (predicted probability) 0.567*** 0.328 0.426** 0.335
[0.193] [0.270] [0.175] [0.270] Product innovation only (predicted probability) 0.252 0.277
[0.270] [0.326]
Process innovation only (predicted probability) 0.522 0.080
[0.570] [0.726]
Product and process innovation (predicted probability) 0.547*** 0.266
[0.191] [0.229]
Start-up (dummy) -0.150 -0.204 -0.159 -0.196 0.151 -0.738***
[0.163] [0.141] [0.111] [0.142] [0.260] [0.234]
Start-up x Product or process innovation 0.149 0.414
[0.276] [0.283]
Start-up x Product innovation 0.251 0.157
[0.255] [0.349]
Start-up x Process innovation 0.556 0.328
[0.416] [0.579]
Start-up x Product innovation only -0.670
[0.590]
Start-up x Process innovation only -3.885**
[1.941]
Start-up x Product and process innovation 1.221*
[0.626]
Predicted R&D intensity -0.006 0.078**
[0.032] [0.035]
Start-up x Predicted R&D intensity -0.213***
[0.071] Initial employment size -0.001 -0.001 0.000 -0.003 -0.003 0.001 0.002 0.000 0.000 0.003 -0.001 0.011
[0.018] [0.018] [0.017] [0.018] [0.018] [0.017] [0.017] [0.017] [0.017] [0.017] [0.018] [0.018] Age -0.021 -0.017 -0.027 -0.024 -0.025 -0.032 -0.031 -0.030 -0.030 -0.033 -0.022 -0.036 [0.022] [0.022] [0.023] [0.022] [0.022] [0.025] [0.025] [0.024] [0.025] [0.025] [0.022] [0.025] Affiliated (dummy) 0.087** 0.086** 0.094** 0.093** 0.093** 0.086** 0.084** 0.094** 0.093** 0.075* 0.090* 0.044
[0.043] [0.043] [0.043] [0.043] [0.043] [0.043] [0.043] [0.044] [0.044] [0.044] [0.046] [0.044] Initial labor productivity -0.212*** -0.214*** -0.206*** -0.211*** -0.210*** -0.212*** -0.214*** -0.202*** -0.206*** -0.211*** -0.210*** -0.207***
[0.034] [0.034] [0.034] [0.034] [0.034] [0.034] [0.034] [0.034] [0.034] [0.034] [0.035] [0.035] Constant 0.384*** 0.438*** 0.460*** 0.436*** 0.407*** 0.481*** 0.549*** 0.525*** 0.534*** 0.535** 0.361** 0.816***
[0.108] [0.098] [0.096] [0.099] [0.134] [0.141] [0.127] [0.126] [0.130] [0.216] [0.169] [0.261] Industry dummies (2 digit) Yes Yes Yes Yes Yes Yes Yes Yes Yes Yes Yes Yes # of observations 897 897 897 897 897 897 897 897 897 897 897 897 F-test (statistics) 2.9 2.9 2.9 2.9 2.8 2.8 2.8 2.8 2.7 2.6 2.8 2.7 F-test (p-value) 0.000 0.000 0.000 0.000 0.000 0.000 0.000 0.000 0.000 0.000 0.000 0.000 R-squared 0.131 0.131 0.131 0.132 0.132 0.133 0.134 0.135 0.136 0.146 0.131 0.150
25
Figure 11: Marginal effects of product/process innovation on labor productivity growth
Notes: The vertical axis is the predicted growth rate of labor productivity. The predicted values are calculated from the estimation result of column [6] in Table 6 at the mean values of the remaining covariates.
-0.119 0.359 -0.248 0.081 -0.30 -0.20 -0.10 0.00 0.10 0.20 0.30 0.40 No Yes
Product or process innovation
Start-up firm Established firm
26
Notes: Robust standard errors are in brackets. ***, ** and * indicate significance at the 1%, 5% and 10% levels, respectively.
Table 7. Third stage results for performance (3): Profitability (probit model - ML estimation)
Dependent variable: Positive profit dummy
[1] [2] [3] [4] [5] [6] [7] [8] [9] [10]
Product or process innovation (predicted probability) 0.824*** 0.584* 0.398 0.248 -0.127 0.258
[0.229] [0.355] [0.283] [0.246] [0.330] [0.249]
Product innovation (predicted probability) 0.731*** 0.461
[0.214] [0.430]
Process innovation (predicted probability) 1.004*** 0.441
[0.304] [0.609]
Product innovation only (predicted probability) 0.774
[0.515]
Process innovation only (predicted probability) 1.751
[1.298]
Product and process innovation (predicted probability) 0.916***
[0.318]
Start-up (dummy) -0.150
[0.328]
Start-up x Predicted product or process innovation -0.433
[0.502]
Affiliated (dummy) 0.143 0.143 0.168* 0.148 0.150 0.097 0.127 0.095 -0.033 -0.012
[0.092] [0.092] [0.090] [0.093] [0.093] [0.094] [0.092] [0.095] [0.103] [0.096]
Age 0.089**
[0.035]
Initial profitability (positive profit dummy) 1.000***
[0.112]
Initial employment size 0.136***
[0.034]
Initial labor productivity 0.308***
[0.054]
Constant -0.365* -0.252 -0.171 -0.244 -0.443* -0.088 -0.259 -0.613*** -0.204 -0.676***
[0.215] [0.200] [0.189] [0.200] [0.266] [0.303] [0.220] [0.219] [0.219] [0.224]
Industry dummies (2 digit) Yes Yes Yes Yes Yes Yes Yes Yes Yes Yes
# of observations 990 990 990 990 990 990 990 979 990 990
F-test (statistics) 52.2 51.0 49.8 51.3 52.7 63.6 56.8 124.5 67.3 81.3
【執筆者】
池内 健太 文部科学省科学技術・学術政策研究所 第 1 研究グループ研究員
岡室 博之 一橋大学大学院経済学研究科 教授
文部科学省科学技術・学術政策研究所 客員研究官
DISCUSSION PAPER No.104
R&D, innovation, and business performance of Japanese start -ups: A comparison with established firms
2013 年 12 月 文部科学省 科学技術・学術政策研究所 第 1 研究グループ 〒100-0013 東京都千代田区霞が関 3-2-2 中央合同庁舎第 7 号館 東館 16 階 TEL:03-3581-2396 FAX:03-3503-3996