Fukushima Medical University
福島県立医科大学 学術機関リポジトリ
This document is downloaded at: 2021-11-07T23:48:59Z
Title Flow-mediated dilatation identifies impaired endothelial function in patients with sleep apnea syndrome
Author(s)
Yoshihisa, Akiomi; Owada, Takashi; Hoshino, Yasuto; Miyata, Makiko; Misaka, Tomofumi; Sato, Takamasa; Suzuki, Satoshi;
Sakamoto, Nobuo; Sugimoto, Koichi; Kunii, Hiroyuki;
Nakazato, Kazuhiko; Suzuki, Hitoshi; Saitoh, Shu-Ichi;
Ishibashi, Toshiyuki; Takeishi, Yasuchika
Citation Fukushima Journal of Medical Science. 56(2): 115-120
Issue Date 2010-12
URL http://ir.fmu.ac.jp/dspace/handle/123456789/269
Rights © 2010 The Fukushima Society of Medical Science
DOI 10.5387/fms.56.115
Text Version publisher
115
義久精臣,大和田卓史,宮田真希子,星野寧人,三阪智史,佐藤崇匡,鈴木 聡,坂本信雄,杉本浩一,國 井浩行,中里和彦,鈴木 均,斎藤修一,石橋敏幸,竹石恭知
Corresponding author : Akiomi Yoshihisa, M.D., Ph.D. E
-mail address : [email protected] http://www.jstage.jst.go.jp/browse/fms http://fmu.ac.jp/home/lib/F
-igaku/
[Original Article]
FLOW
-MEDIATED DILATATION IDENTIFIES IMPAIRED ENDOTHELIAL FUNCTION IN PATIENTS WITH SLEEP APNEA SYNDROME
AKIOMI YOSHIHISA, TAKASHI OWADA, YASUTO HOSHINO, MAKIKO MIYATA, TOMOFUMI MISAKA, TAKAMASA SATO, SATOSHI SUZUKI, NOBUO SAKAMOTO,
KOICHI SUGIMOTO, HIROYUKI KUNII, KAZUHIKO NAKAZATO, HITOSHI SUZUKI, SHU
-ICHI SAITOH, TOSHIYUKI ISHIBASHI
and YASUCHIKA TAKEISHI
Department of Cardiology and Hematology, Fukushima Medical University (Received September 24, 2010, accepted November 9, 2010)
Abstract : [Background] Non
-invasive detection of vascular dysfunction in the early stage is clini- cally important in patients with sleep apnea syndrome (SAS). Flow
-mediated dilatation (FMD) is a novel clinical marker of endothelial function. However, it is not clear whether this is useful in the SAS patient. [Methods] Echocardiographic parameters and FMD were measured in 129 patients with SAS. Apnea
-hypopnea index (AHI) was defined by polygraphy, and patients were divided into the two Groups : Group A (moderate
-severe SAS : AHI≥15 times/hr, n=93) and Group B (mild SAS : AHI 5
-15 times/hr, n=36). [Results] There were no significant differences in echocardio- graphic parameters between the two groups. However, FMD was significantly lower in Group A than in Group B (3.5±1.6 vs. 7.8±3.1, P<0.01). [Conclusions] Although cardiac function was not different, vascular dysfunction was evident in patients with moderate
-severe SAS. FMD is a useful tool to identify impaired endothelial function non
-invasively in patients with SAS.
Key words : sleep apnea syndrome, vascular function, endothelial function, flow
-mediated dilata- tion
INTRODUCTION
Sleep apnea syndrome (SAS) has a critical asso- ciation with cardiovascular mortality and morbidity.
It has been recently recognized that SAS plays a role in the pathogenesis of systemic hypertension, isch- emic heart disease, heart failure, and arrhythmia
1). Since an arteriosclerotic initial change to cause car- diovascular events is vascular endothelial dysfunc- tion, the evaluation of endothelial function is clini- cally important. The assessment of flow
-mediated dilatation (FMD) of the brachial artery has been recently used as a non
-invasive method for evaluat- ing endothelial function
2).
Therefore, the aim of this study was to examine whether endothelial function assessed by FMD is impaired in patients with SAS. We compared the FMD data between patients with mild SAS and those with moderate
-severe SAS.
METHODS
Subjects and study protocol
In the present study, 129 patients with SAS
were enrolled. SAS was diagnosed by polygraphic
data. Apnea was defined as an absence of airflow
for >10 s. Hypopnea was defined as a >30% reduc-
116 A. YOSHIHISA et al.
tion in monitored airflow accompanied by a decrease in SaO
2of ≧ 4%. The apnea
-hypopnea index (AHI) was defined as the number of apnea and hypopnea episodes per hour of sleep. Patients with AHI greater than 5 were considered as having SAS.
Generally, it is classified as normal (AHI<5), mild SAS (5 ≦ AHI<15), moderate SAS (15 ≦ AHI<30) and severe SAS (30 ≦ AHI). Echocardiography and FMD were performed in all patients. Patients were divided into the two groups according to the AHI value : Group A (moderate
-severe SAS : AHI
≥15 times/hr, mean 34.8±14.8, range 15.1
-77.9, n
=93) and Group B (mild SAS : AHI 5
-15 times/hr, mean 8.4±4.0, range 5.6
-14.9, n=36)
3−6). We com- pared clinical characteristics, laboratory data, echo- cardiographic parameters, and FMD between the two groups. The study protocol was approved by the Ethics Committee of the Fukushima Medical University, and written informed consent was ob ta- ined from all subjects.
Polygraphy
All subjects underwent overnight polygraphy with the use of standard techniques
7,8). Over night polygraphy was performed using a type 3 polygraph system (LS
-300, Fukuda Denshi, Tokyo, Japan) that consisted of the monitoring of electrocardiogram, thoracoabdominal motion, nasal airflow by an airflow pressure transducer, and arterial oxyhemoglobin sat- uration (SpO
2) by pulse oximetry. Obstructive apnea was defined as the absence of airflow for ≧ 10 s associated with ribcage and abdominal motion.
Central apnea was defined as the absence of airflow for >10 s associated without ribcage and abdominal motion. The major polygraphic parameters investi- gated were AHI, central apnea index (CAI), obstruc- tive apnea index (OAI), lowest pulse oxygen satura- tion (Lowest SpO
2), and mean pulse oxygen saturation (Mean SpO
2)
7,8).
Echocardiography
Echocadiography was performed using the stan- dard techniques. Two dimensional echocardiogra- phic images were acquired from the parasternal long and short axis, apical long axis, and apical four cham- ber views by an experienced echocardiographer.
The major echocardiographic parameters investi- gated were interventricular septal thickness (IVS), posterior wall thickness (PW), left ventricular mass index (LVMI), left atrial volume index (LAVI), left ventricular ejection fraction (LVEF), LV inflow E
wave deceleration time (DcT), the ratio of LV inflow E wave to A wave peak velocity (E/A), and the ratio of transmitral early left ventricular filling velocity to early diastolic Doppler tissue imaging of the mitral annulus (E/e’). All recordings were performed on ultrasound systems (Acuson Sequoia, Siemens, Erlangen, Germany).
Flow
-mediated dilatation (FMD) measurements Endothelial function was evaluated by means of FMD within one week before or after polygraphy as previously reported
2). After fasting for at least 5 hr, patients were required to lie at rest for at least 15 min, and FMD was assessed in the right arm in a supine position in a quiet temperature
-controlled room by using high
-resolution ultrasound (UNEXEF18G, UNEX Corporation, Nagoya, Japan).
The brachial artery was scanned laterally and its diameter at end
-diastole (from the inner border line of adventitia to adventitia) was measured. The cut off was obtained 5 cm proximal to the antecubital fossa, fitted at 8 cm distal to the brachial artery, near the wrist. The transmit focus zone was set at the depth of the anterior wall. Anatomical landmarks and snapshot images were used to assess FMD in the exact same vessel selection on each study day and at each time point. A view of a 5 cm transver- sal section of the brachial artery was recorded for periods of 30 s at the baseline and during the peak (up to 2 min after cuff release) reactive hyperemia (after deflation of the blood pressure cuff previously inflated to 50 mmHg above the patients’ systolic blood pressure around the forearm for 5 min). The vessel diameter was automatically measured by built
-in software. FMD was calculated as the per- centage of change in diameter from the baseline value before cuff release to the peak value after cuff release : %FMD=[(vessel diameter reactive hyper- emia−vessel diameter at rest)×100]/ vessel diame- ter at rest.
Statistical analysis
Data are presented as mean±SD. We used the
chi
-square test for categorical variables and the
independent t
-test for continuous variables. If the
data were not distributed normally, the Mann
-Whitney U test was used. A p value of <0.05 was
considered significant for all comparisons. All anal-
yses were performed using a statistical software
package (StatView version 5.0, SAS Institute Inc.,
Abacus Concepts, Berkeley, CA, USA).
RESULTS
Clinical characteristics of study subjects
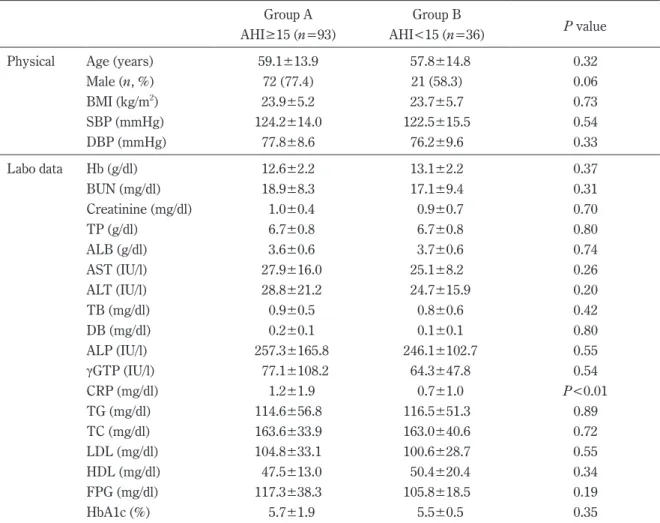
The clinical characteristics of Group A and Group B are shown in Table 1. C
-reactive protein was significantly higher in Group A than in Group B.
However, there were no other differences in the lab- oratory data between the two groups.
Polygraphic data are shown in Table 2. AHI, CAI and OAI were significantly higher in Group A than in Group B. The mean SpO
2was significantly lower in Group A than in Group B.
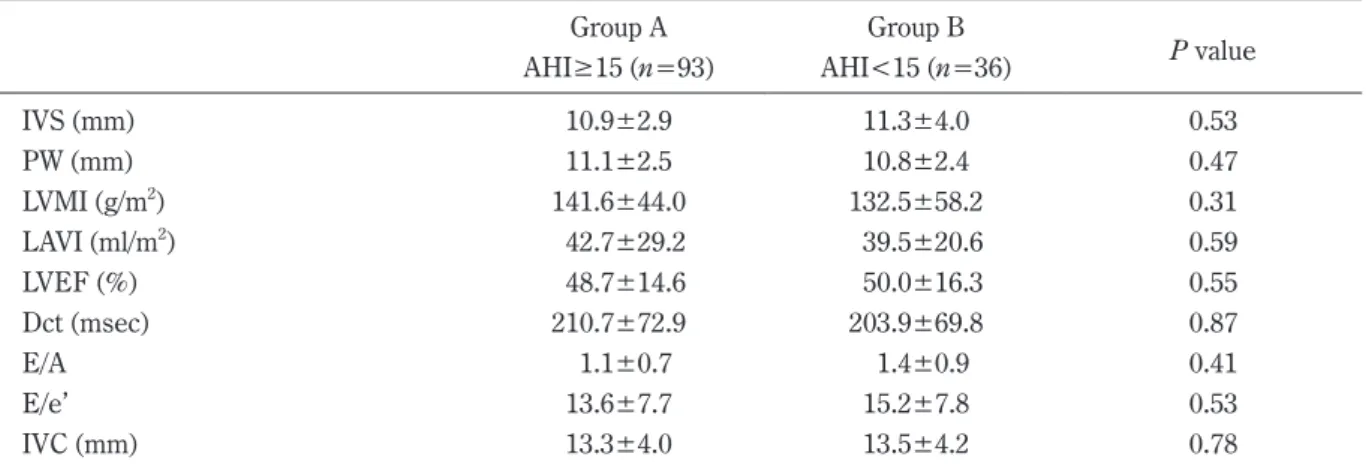
Echocardiographic data are shown in Table 3.
There were no significant differences in all parame- ters between the two groups.
Results of FMD are shown in Figure 1. The percentage of FMD was significantly lower in Group A than in Group B (3.5±1.6 vs. 7.8±3.1, P<0.01).
DISCUSSION
The influence of sleep apnea syndrome on cardiac function
Since obstruction of upper respiratory airway causes negative intra
-thoracic pressure and hypoxia results in sympathetic nervous overactivity, SAS may contribute to cardiac systolic and diastolic dysfunction
4,9,10). However in the present study, significant differences in cardiac function were not observed between mild and moderate
-severe SAS in our study population. In a previous study by Romero
-Corral et al
4), severe SAS was associated with diastolic dysfunction (LAVI), but not systolic dysfunction (LVEF). Their study population inclu- ded more severe SAS and OSA dominant compared to our study. In our study population, BMI and OAI were much lower than those in their study. These differences might relate to no significant changes in cardiac systolic and diastolic function even in moder-
Table 1. Comparisons of clinical characteristics between patients in groups A and B
Group A Group B
P value AHI≥15 (n=93) AHI<15 (n=36)
Physical Age (years) 59.1±13.9 57.8±14.8 0.32
Male (n, %) 72 (77.4) 21 (58.3) 0.06
BMI (kg/m
2) 23.9±5.2 23.7±5.7 0.73
SBP (mmHg) 124.2±14.0 122.5±15.5 0.54
DBP (mmHg) 77.8±8.6 76.2±9.6 0.33
Labo data Hb (g/dl) 12.6±2.2 13.1±2.2 0.37
BUN (mg/dl) 18.9±8.3 17.1±9.4 0.31
Creatinine (mg/dl) 1.0±0.4 0.9±0.7 0.70
TP (g/dl) 6.7±0.8 6.7±0.8 0.80
ALB (g/dl) 3.6±0.6 3.7±0.6 0.74
AST (IU/l) 27.9±16.0 25.1±8.2 0.26
ALT (IU/l) 28.8±21.2 24.7±15.9 0.20
TB (mg/dl) 0.9±0.5 0.8±0.6 0.42
DB (mg/dl) 0.2±0.1 0.1±0.1 0.80
ALP (IU/l) 257.3±165.8 246.1±102.7 0.55
γGTP (IU/l) 77.1±108.2 64.3±47.8 0.54
CRP (mg/dl) 1.2±1.9 0.7±1.0 P<0.01
TG (mg/dl) 114.6±56.8 116.5±51.3 0.89
TC (mg/dl) 163.6±33.9 163.0±40.6 0.72
LDL (mg/dl) 104.8±33.1 100.6±28.7 0.55
HDL (mg/dl) 47.5±13.0 50.4±20.4 0.34
FPG (mg/dl) 117.3±38.3 105.8±18.5 0.19
HbA1c (%) 5.7±1.9 5.5±0.5 0.35
BMI, body mass index ; SBP, systolic blood pressure ; DBP, diastolic blood pressure
118 A. YOSHIHISA et al.
Table 2. Comparison of polygraphic data between patients in groups A and B
Group A Group B
P value AHI≥15 (n=93) AHI<15 (n=36)
AHI (times/h) 34.8±14.8 8.4±4.0 P<0.01
CAI (times/h) 12.6±11.7 3.1±2.8 P<0.01
CAI/AHI (%) 36.2 36.9
OAI (times/h) 9.9±9.6 3.0±2.8 P<0.01
Lowest SpO
2(%) 80.5±8.0 82.3±8.2 0.20
Mean SpO
2(%) 94.9±2.7 96.0±3.4 0.07
AHI, apnea hypopnea index ; CAI, central apnea index ; OAI, obstructive apnea index ; Lowest SpO
2, low- est oxyhemoglobin saturation ; Mean SpO
2, mean oxyhemoglobin saturation
Table 3. Comparisons of echocardiographic data between patients in groups A and B