The oceans cover almost three-quarters of our planet, infl uencing food produc- tion, coastal erosion, sea-level rise, and natural disasters such as tsunamis and hurricanes. Those who study the oceans can be subdivided into four major fi elds:
biological oceanography, chemical oceanography, physical oceanography, and geological oceanography (marine geology and geophysics). Although
oceanography also includes ocean en- gineering, public policy, and coastal oceanography, these disciplines were not considered in this study because they are “non-traditional” and participation therein is more diffi cult to track.
A look at schools and departments of oceanography reveals a rich and intrigu-
ing variety of associated themes and studies: wave mechanics, seafl oor micro- biology, and climate research, to name a few. The science is also continually evolving: paleoceanography and ocean remote sensing are just two of the new branches that have emerged in the last fi fty years.
Women have played an active role in all areas of oceanography. Defi ning
the number of women oceanographers is not an easy task because the disci- pline is so broad and the boundaries between subdisciplines are not always distinct. For example, we (the authors of this article) study ocean sediments and have spent long months at sea on research vessels, yet neither of us con-
sider “oceanography” our primary fi eld of study. Our link to oceanography is through marine geology, and women marine geologists are included in this article. In contrast, we have not included marine biology as a discipline, but have included biological oceanography. Ma- rine biology focuses on the biology and physiology of marine organisms whereas biological oceanography has a more in- terdisciplinary ecological approach and focuses more on the interactions of or- ganisms and their environment.
There is no perfect way to look at women’s participation in oceanography.
What is clear, however, is that histori- cally the experience of women in this fi eld has been very different from that of B Y S U Z A N N E O ’ C O N N E L L A N D M A R Y A N N E H O L M E S
Women of the Academy and the Sea
W O M E N I N O C E A N O G R A P H Y
Suzanne O’Connell (soconnell@wesleyan.
edu) is Associate Professor and Chair, Department of Earth and Environmental Sciences, Wesleyan University, Middletown, CT, USA. Mary Anne Holmes is Research Associate Professor, Geosciences Depart- ment, University of Nebraska-Lincoln, Lincoln, NE, USA.
Women have played an active role in all areas of oceanography.
Defi ning the number of women oceanographers is not an easy task
because the discipline is so broad and the boundaries between
subdisciplines are not always distinct.
men. To assess how women have fared through the years, we have drawn on the publicly available data to examine the changes in women’s role through time and to create a snapshot of current aca- demic departments.
WOMEN IN O CE ANO GR APHY THROUGH TIME
We present data from two sources: the National Science Foundation (NSF) re- cord of degrees granted (NSF, 2004) and women scientists’ participation in Joint Oceanographic Institutions for Deep Earth Sampling (JOIDES) scientifi c ocean drilling research cruises (as given in cruise-related publications).
National Science Foundation—
Degrees Granted
Since 1966, NSF has collected and pub- lished data about degrees granted at the bachelor’s, master’s, and Ph.D. level in different disciplines. The geosciences include Earth, atmospheric, and ocean sciences (EAOS). Degree data for these three disciplines can be viewed in one category or in the various subcategories.
NSF data permit an assessment of broad trends in degrees granted to both total number and proportion of women in all EAOS fi elds (Figures 1 to 3). NSF data also permit comparison between wom- en’s participation in EAOS and women’s participation in other fi elds (Figure 4).
Whether looking at total numbers (Figure 1) or proportion (Figure 2), it is clear that women’s participation is increasing at all degrees levels within the EAOS category. The rate of increase
0 500 1000 1500 2000 2500
1965 1970 1975 1980 1985 1990 1995 2000
Number of Women Receiving Geoscience Degrees
Degree Year Bachelor’s
Master’s Ph.D.
0%
5%
10%
15%
20%
25%
30%
35%
40%
1965 1970 1975 1980 1985 1990 1995 2000
Proportion of Geoscience Degrees Awarded to Women (%)
Ph.D.
Degree Year Bachelor’s
Master’s
Figure 1. Number of women receiving bachelor’s, master’s and Ph.D. degrees in Earth, atmo- spheric, and ocean sciences, the three fi elds in the geosciences directorate at the National Science Foundation (NSF, 2004). Each value is a three-year running average centered at the middle year. Bachelor’s and masters’s degree data are not available for 1999 (NSF, 2004).
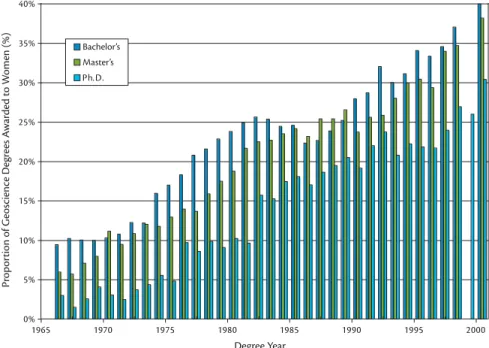
Figure 2. Proportion of women receiving bachelor’s, master’s and Ph.D. degrees in Earth,
atmospheric, and ocean sciences. Each value is a three-year running average centered at the
middle year. Th e proportions of women receiving geoscience degrees have risen faster than
the absolute numbers (Figure 1) because fewer men are pursuing these fi elds. Bachelor’s
and master’s degree data are not available for 1999 (NSF, 2004).
of the proportion of women receiving degrees is rising faster than the rate of increase of the number of women. The increase in the proportion of women earning degrees could be because the number of men pursing these degrees is increasing more slowly or not at all.
This is clearly documented in the case of awarded oceanography Ph.D. de- grees (Figure 5). At the current rate of increase, assuming the linear trend con- tinues, women will receive more than 50 percent of EAOS bachelor’s degrees before 2020 and more than 50 percent of EAOS Ph.D.s before 2030. Women al- ready receive over 50 percent of biology undergraduate degrees (NSF, 2004).
Despite the increases in women’s par- ticipation, fewer women than men enter the geosciences as undergraduates (Fig- ure 2) and still fewer women than men continue on to graduate school to earn Ph.D.s. While it is true that in all fi elds of science that relatively few students con- tinue on to earn a Ph.D., fewer women earn bachelor’s degrees in science and more women discontinue their formal science education after completing their undergraduate degree. The result is that far fewer women than men prepare to enter graduate school and later aca- demia. The data shows that 4,047 bache- lor’s degrees and 758 Ph.D.s were award- ed in EAOS fi elds in 2000. Of these, 1,617 (40 percent) of the bachelor’s de- grees and 230 (30 percent) of the Ph.D.s were awarded to women (NSF, 2004).
To address the question of attrition, we looked at the proportion of women in degree cohorts. We assumed that someone who continued on to graduate school shortly after receiving a bachelor’s degree would earn a Ph.D. seven years
0%
5%
10%
15%
20%
25%
30%
35%
1970 1975 1980 1985 1990 1995 2000 2005
Proportion of Geoscience Degrees Awarded to Women (%)
3 Year Running Average of: Bachelor’s Year +7, Ph.D. Year Bachelor’s Year +7
Ph.D. Year
0%
5%
10%
15%
20%
25%
30%
35%
40%
45%
50%
Engineering Physical
Sciences E, A, & O Math/Comp Biol/Ag Total STEM Area
Proportion Women in Degree Cohorts (%)
B.A. 1967 Ph.D. 1974 B.A. 1992 Ph.D. 1999
Figure 3. Proportion of women in degree cohorts for bachelor’s degrees and Ph.D.s in geosciences using a three-year running average with degree year placed at Ph.D. year.
Th e Ph.D. cohort used for comparison is set at seven degrees post-bachelor’s degree (e.g., 1987 Ph.D. degree recipients are compared to 1980 bachelor’s degree recipients), with data plotted at the Ph.D. year (NSF, 2004). Horizontal orange bars for 1997, 2001, and 2002 show the proportion of women in assistant professor, tenure-track geoscience positions at all degree granting institutions (bachelor’s, master’s and Ph.D.), based on data from the AGI directory (Claude, 1997, 2001, 2002). Scientists may become assistant professors immediately after receiving their Ph.D. or after several years as a post-doc- toral researcher. Faculty are usually assistant professors for six or seven years.
Figure 4. Two degree cohorts for all STEM fi elds, calculated as in Figure 3. Women who
receive a bachelor’s degree in Earth sciences are more likely than any other science to con-
tinue on for a Ph.D. However, as a proportion of the fi eld, fewer women major in the Earth
sciences than any other science. Th e high retention rate may refl ect women from other
science fi elds receiving Ph.D.s in EAOS fi elds. None of the Ph.D. proportions distinguish
between students earning their bachelor’s degrees at a U.S. institution or abroad before
entering a U.S. graduate program. Source: NSF (2004) and Holmes and O’Connell (2004).
later. First, we examined this average for EAOS degrees awarded by year (Figure 3). There is only a slight decrease in the proportion of women receiving a Ph.D.
relative to the proportion receiving a bachelor’s degree. Over the last thirty years, there has never been more than a 5.5 percent difference between the pro- portion of men and women who have continued on to receive a Ph.D., when the data are lagged. In recent years, the proportional attrition gap is closing.
However, a disturbing comparison is the proportion of women in tenure-track, assistant-professor positions (shown in orange for selected years, Figure 3). The gap between the proportion of Ph.D.s awarded to women and the proportion of women in tenure-track positions ap- pears to be increasing, not decreasing.
We will look at this further in the “snap- shot” sections.
We also compared the proportion of degrees granted to women for all science, technology, engineering, and mathemat- ics (STEM) fi elds for two bachelor’s de- gree/Ph.D. degree cohorts separated by 25 years (Figure 4). Women recipients of bachelor’s degrees have increased from an average of 16.8 percent in 1967 to 32.3 percent twenty-fi ve years later (1992).
Even though in all STEM fi elds women are less likely than men to pursue a Ph.D.
(Figure 4) (NSF, 2004), the increase in women receiving Ph.D.s is even more impressive than their increases in bache- lor’s degrees. The STEM fi eld increase in women receiving Ph.D.s is from 9.8 per- cent in 1974 to 27.4 percent in 1999.
Focusing on EAOS, the increase in the number of women students receiving bachelor’s degrees and Ph.D.s over the course of twenty-fi ve years is one of the
most improved. In the 1967 bachelor’s degree and 1974 Ph.D. cohort, women comprised 9.9 percent and 4.9 percent of the degree recipients, respectively. For the 1992/1999 cohort, the percentages had increased to 30 percent and 27.8 percent, respectively.
In addition to actual retention, there are three other factors that may con- tribute to the high proportional rates of women continuing for the Ph.D. in- cluding: (1) decreasing numbers of men continuing for a Ph.D., (2) more women than men recruited from other fi elds to EAOS fi elds, and (3) increases in the number of foreign women in U.S. gradu- ate programs. Oceanography is primar- ily a graduate discipline, therefore, it is likely that many oceanography Ph.D.s received their undergraduate degrees in non-EAOS fi elds such as physics, chemistry, mathematics, and biology.
If women are being drawn into EAOS at a higher rate than men for gradu- ate school, this could contribute to the
high apparent retention rate of women in EAOS. The proportion of women re- ceiving graduate oceanography degrees between 1966 and 2001 varies from 2 percent in the early 1970s to 38 percent in 2001 (NSF, 2004). This increase is due to both more women and fewer men en- tering the fi eld (Figure 5).
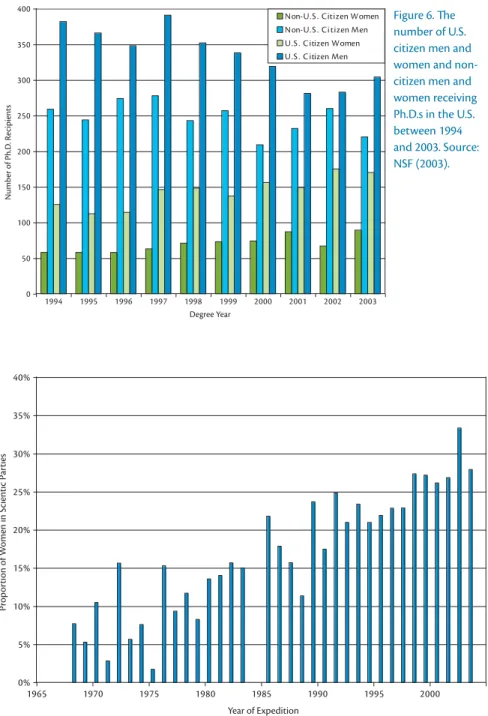
The cohorts also do not take into ac- count foreign students who enter the U.S. educational system at the graduate level, which would give the appearance of higher overall retention rates. If for- eign women receive Ph.D.s at a higher rate than foreign men, this would in- crease the apparent retention rates for women. NSF provides data for Ph.D.
recipients by nationality beginning in 1994 (NSF, 2003). Women who are U.S.
citizens show the highest rate of increase, followed closely by non-citizen women (Figure 6). Non-citizen men remain roughly constant and the number of U.S.
citizen men receiving Ph.D.s in EAOS fi eld decreases. If the non-citizen men
0 20 40 60 80 100 120
1965 1970 1975 1980 1985 1990 1995 2000 2005
Degree Year
Number of Women and Men Receiving Ph.D. in Oceanography
Women Receiving Ph.D.s Men Receiving Ph.D.s
Figure 5. Number of women and men receiving Ph.D.s in oceanography between 1966 and
2001. Source: NSF (2004).
0 50 100 150 200 250 300 350 400
1994 1995 1996 1997 1998 1999 2000 2001 2002 2003
Number of Ph.D. Recipients
Non-U.S . Citizen Women Non-U.S . Ci tizen Men U.S . C itizen Women U.S . C itizen Men
Degree Year
0%
5%
10%
15%
20%
25%
30%
35%
40%
1965 1970 1975 1980 1985 1990 1995 2000
Proportion of Women in Scientic Parties
Year of Expedition
Figure 6. Th e number of U.S.
citizen men and women and non- citizen men and women receiving Ph.D.s in the U.S.
between 1994 and 2003. Source:
NSF (2003).
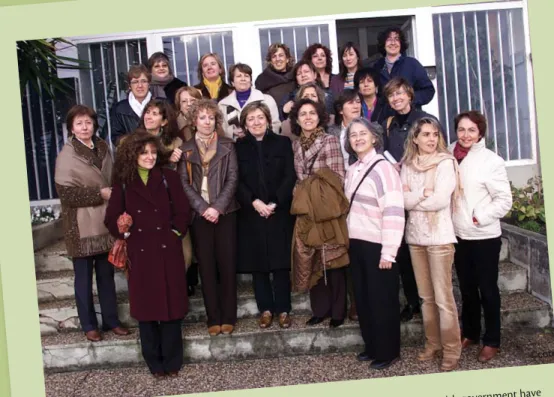
Figure 7. Proportion of women in DSDP (1968-1983) and ODP (1985-2003) scientifi c par- ties per year. Members of scientifi c parties are invited to participate and include graduate students, postdoctoral researchers and employed scientists. Th ere are several diff erences between DSDP and ODP scientifi c parties. During DSDP scientifi c parties were generally twelve people, while during ODP they were generally about 24. Although scientists from outside the United States participated in early legs, the participation of non-U.S. scientists wasn’t formalized until 1975 when Japan and four European countries joined the program.
During ODP non-US participation expanded even further, although the number and com- position of participating countries changed during the program. In the late 1960s and early 1970s, women comprised less than 10 percent of the scientifi c party. By the late 1990s and early 2000s, women comprised over 25 percent of the scientifi c party. Data from DSDP and ODP cruise lists are published at the beginning of report volumes. DSDP gender assign- ments were made on the basis of names, so there might be some error. ODP data from Tom Davies, Ocean Drilling Program, personal communication, 2005.
and women did not receive their un- dergraduate degrees at U.S. institutions, then the Ph.D.-receiving non-citizen women contribute to the apparent high- er retention rates of women.
S CIENTIFIC O CE AN DRILLING AND WORKFORCE STATISTICS Scientifi c ocean drilling began almost fi fty years ago with the Mohole project (more information available at http://
www.nas.edu/history/mohole/). Since then, it has undergone several changes, both in the vessel used, the program organization, and the size and composi- tion of the scientifi c party. The Deep Sea Drilling Project (DSDP) (1968-1983) originated as a U.S. program with the goal of learning about ocean history, es- pecially the age of the ocean, by recover- ing samples of ocean sediments and the underlying oceanic crust throughout the oceans. Although it was begun as a U.S.
program, scientists from other coun- tries participated as shipboard scientists.
International participation became for-
malized in 1975 when the governments
of Japan and four European countries
began fi nancial contributions, assuring
their scientists’ involvement in the plan-
ning process and guaranteeing them sci-
entifi c berths on the drilling vessel. This
international structure, with the United
States as the lead partner, continued in
a successor program, the Ocean Drilling
Program (ODP) (1985-2003). During
ODP, the number of non-U.S. countries
increased as did the size of the scientifi c
party. The newest scientifi c ocean drill-
ing program, the Integrated Ocean Drill-
ing Program, has the U.S. and Japan as
co-equal partners, and includes broad
international participation as well. Drill-
ing operations have only recently begun.
During the DSDP’s 15 years of sea-go- ing operations, 96 expeditions were com- pleted in all of the world’s oceans with the Glomar Challenger as the drilling vessel. Each expedition lasted about two months and was called a “leg.” Scientists who participate in the leg form the sci- entifi c party. During DSDP, nearly 1,260 scientists sailed on the Glomar Challeng- er. Of these scientists, only 12.5 percent were women (Figure 7).
The successes of the DSDP were sig- nifi cant. The cores recovered allowed scientists to date the ocean fl oor with reasonable accuracy, proving beyond a doubt that oceanic crust aged away from mid-ocean ridge spreading centers; al- lowed the fi eld of paleoceanography to develop and fl ourish; and increased our understanding of the processes at sub- duction zones.
When the Glomar Challenger became too old to meet the needs of the scientifi c community, a new program, the ODP began. ODP commissioned a larger ship, the JOIDES Resolution. This 471-foot- long vessel allowed an increase in the size of scientifi c laboratories and in the num- ber of scientists, meaning much more work could be done at sea. The new vessel was able to drill in high latitudes and address some of the major unsolved paleoclimate and paleoceanographic questions. The JOIDES Resolution also had better station-keeping and heave- compensating equipment. This equip- ment allowed drilling in rough weather and disturbed the cores less, making them more useful for detailed scientifi c analysis. Between 1985 and 2003, 109 ODP legs were completed. Almost 2,900 scientists participated, and 22.7 percent
of them were women (Figure 7).
Not shown in Figure 7 is the increase in women heading the drilling expedi- tions. The primary responsibility for en- suring the scientifi c results of each cruise rests with the two co-chief scientists.
These scientists are often the people who
proposed the research and spent many years collecting the necessary back- ground information to allow a leg to be drilled in a particular area to answer spe- cifi c scientifi c questions. During DSDP, only four women sailed as co-chief sci- entists, beginning with Leg 25 in 1972, and ending with Leg 92 in 1983. During ODP, women were co-chief scientists on sixteen ODP legs, and on Legs 144 and 147 in particular, both co-chief scientists were women.
WOMEN O CE ANO GR APHER S IN ACADE MIC AND RE SE ARCH POSITIONS
Women use their STEM Ph.D.s in many ways. The published degree information does not allow us to see what happens to women after receiving their degrees. One destination of many Ph.D. recipients is a tenure-track position at an academic or research institution. Women in these po- sitions are particularly important as role models, encouraging more junior women to pursue science degrees. Women in aca- demic positions are also relatively easy
to track though the American Geological Institute (AGI) database and institutional web sites. To measure the participation of women in the academic/research areas of oceanography, we took two approach- es. We used the 2002 AGI Directory of Geoscience Departments (Claudy, 2002)
and the personnel lists from web sites of six major oceanographic institutions, schools, and departments as given in the winter of 2004 to 2005.
AGI Data 2002
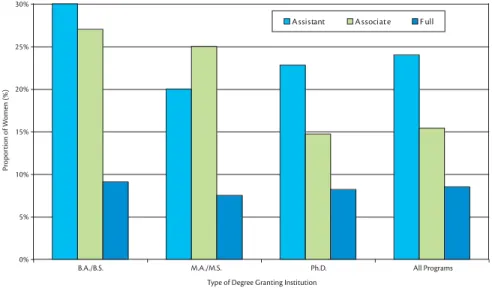
The AGI data are self-reported. The 2002 Directory of Geoscience Departments (Claudy, 2002) shows that for the geo- sciences overall, women are present in lower proportions, 12 percent at Ph.D.- granting institutions versus 17 percent at bachelor’s-degree-granting. Women are present in higher proportions at lower- ranking academic positions at both types of institutions (Figure 8). Master’s-de- gree-granting institutions show a differ- ent pattern, with a higher proportion of women associate professors and a lower proportion of women full professors than bachelor’s-degree-granting institutions.
The higher proportions in lower-rank- ing positions are not surprising because of the considerable time it takes to move from assistant to full professor, which is about fourteen years. What is surprising is that the proportions at the rank of pro-
What is surprising is that even with the increase of
women in both absolute numbers and proportions, the
number of women remains so low at the entr y level
assistant professor rank .
Oceanography is a thriving profession in Spain—though it is still male-domi- nated. Women oceanographers currently represent 42 percent of Spanish marine researchers (Figure 1). This seemingly high percentage is not homogeneous across all work classifi cations. Overall, 26 percent of Spanish oceanographers are men with permanent positions, while only 11 percent of women have similar permanent positions (Figure 2).
The statistics show that most of the ma- rine scientists who are grant holders are women (23 percent, versus 18 percent for men) (Figure 2). This job contrast is even greater at Spanish universities than in research institutes where men hold far
more permanent posts (Figure 3).
Gender distribution is also different among specializations. Men and women are more or less evenly balanced in ma- rine biological-ecological and chemical groups (ratios are 53/47 percent and 52/48 percent, respectively), while male dominance is obvious among geologi- cal and physical oceanographers (62/38 percent and 66/34 percent, respectively) (Figure 4). Male geological and physical oceanographers can represent 75 percent of specifi c marine-science e-mail lists.
The population of Spanish under- graduate oceanography students (a fi ve- year degree that comprises all of marine sciences) is about 2500, but these num-
bers decreased slightly between 1998 and 2001. Nevertheless, the percentage of women undergraduate oceanography students grew from 57 to 63 percent dur- ing the same period, exceeding the na- tional female university students’ ratio.
In conclusion, currently in Spain the majority of oceanographers are men, and men still hold the best jobs. How- ever, the number of women in this fi eld is increasing, and for the time being it seems that women represent most of the young marine scientists. It should be pointed out that recently some Span- ish women have reached very important posts, such as the Minister for Education and Science (M.José San Segundo) and
Oceanography in Spain: Gender Issues
B Y C A M I N O L I Q U E T E
Figure 2.
Figure 1.
the Director-General of the Spanish Oceanographic Institute (M. Concepción Soto) (photo).
So, it appears that at least in Spain, women oceanographers are becoming more equal in the highest working ranks. Undoubtedly, these numbers will improve even more in the future.
Camino Liquete ([email protected]) is a Ph.D. candidate, GRC Geociències Marines, Departament d’Estratigrafi a, Paleontolo- gia i Geociències Marines, Universitat de Barcelona/Facultat de Geologia Campus de Pedralbes, Barcelona, Spain.
Figure 3. Figure 4.
Homage to Spanish Women Oceanographers (http://www.ieo.es). Changes in the Spanish government have been refl ected in a higher proportion of woman in decision-making positions. On January 26, 2005, there was a homage to Spanish women oceanographers on board R/V Cornide de Saavedra, the fi rst Spanish research vessel, built in the 1970s. In this picture, a group of women oceanographers and research assistants from the Instituto
Español de Oceanografía (IEO), the Consejo Superior de Investigaciones Científi cas (CSIC), and the University of Cantabria. On the fi rst step, positions 3 to 7 from left to right, are the Councellor of Education from the Au- tonomous Government of Cantabria (Rosa E. Díaz-Tezanos), the Spanish Minister of Education and Science (M. José San-Segundo, dressed in black), the General Director of the Instituto Español de Oceanografía (Con-
cepción Soto), and the head of the Fisheries Division at IEO (Pilar Pereda), all posts held by women for the fi rst time, and the cruise leader on the R.V. Cornide de Saavedra (Alicia Lavín). Beatriz Reguera is on the second step between the last two. At ground level on the right, with a striped pullover, is the Director of the Instituto de Ciencias del Mar from Barcelona (Dolors Blasco). On the top left, with a white scarf, Marta Estrada, and
behind her, the Coordinator of the National Programme on Marine Sciences (Beatriz Morales) (A. Lavín, M.
Estrada and B. Reguera are contributors to this volume). Photo courtesy of the newspaper Alerta, 27 January 2005 (http://www.alertacantabria.com).
0%
5%
10%
15%
20%
25%
30%
35%
Geo chemistry
Paleoentology Ocean
ography Soil Science
Geology Geophysics
Other Planetology
Hydrology
Atm ospheric/ Me
terology
G eoscience S pecia lty
Proportion of Women in Specialty at Ph.D. Granting Institutions
Figure 9. Proportion of women in diff erent geoscience specialties as self reported in the 2001- 2002 AGI Directory of Geoscience Departments. Data from Claudy (2002) and Holmes and O’Connell (2004). Oceanography is the third most popular area for women in Ph.D.-granting geoscience departments. Th e actual number of oceanographers is likely to be underrepre- sented because women in some fi elds, especially biological oceanography, are unlikely to be represented in these data.
0%
5%
10%
15%
20%
25%
30%
B.A./B.S. M.A./M.S. Ph.D. All Programs
Type of Degree Granting Institution
Proportion of Women (%)
Assistant Associate F ull
Figure 8. Proportion of women geoscience faculty in diff erent degree-granting departments by academic rank in 2001-2002. Th ere are 219 BA/BS departments with an average of seven faculty, 99 MA/MS departments, with an average of nine faculty, and 272 Ph.D.-granting departments with an average of 16 faculty, for a total of 590 departments with an average of 12 faculty. At all academic levels, women are more likely to be at a bachelor’s (17 percent) than a Ph.D. (12 percent) granting institution. Data from Claudy (2002) and Holmes and O’Connell (2004).
fessor at all types of institutions are still so low (less than ten percent).
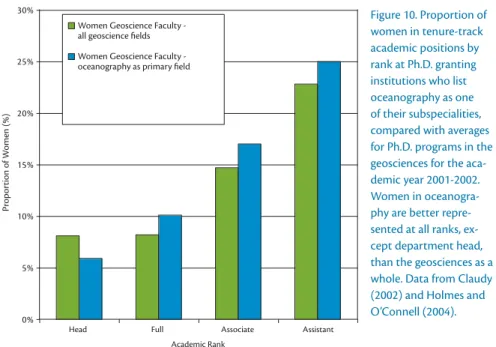
Oceanography is primarily a graduate fi eld, so only Ph.D.-granting institutions are included in Figure 9. Approximately 28 percent of the 581 tenured and ten- ure-track faculty at Ph.D.-granting in- stitutions that list oceanography as their primary discipline are women, making it the third most popular sub-discipline listed by women geosciences faculty. With the exception of department chairs or heads, women in oceanography are better represented by two to three percent more at each faculty rank than the average for geoscience departments (Figure 10).
Oceanographic Institutions As a second approach to assessing wom- en’s employment in academic oceanogra- phy, we examined the faculty web pages of six major oceanographic institutions, schools, and departments, including:
• College of Oceanic and Atmospheric Sciences, Oregon State University
• Graduate School of Oceanography, University of Rhode Island
• Department of Oceanography, Uni- versity of Washington
• Rosenstiel School of Marine and Atmospheric Sciences, University of Miami
• Scripps Institution of Oceanography, University of California San Diego
• Woods Hole Oceanographic Institu- tion
These schools were chosen because they
represent fi ve of the original six institu-
tions that formed Joint Oceanographic
Institutions for Deep Earth Sampling
(JOIDES) and consist of private and
public institutions and institutions of
different sizes. The sixth original JOI
institution, Lamont Doherty Earth Ob- servatory, was not included because it has many non-oceanographic Earth sci- entists. Reviewing the six web pages al- lowed us to better quantify the number of women in oceanography today. Also, by reviewing the web sites directly, we were able to add the names of those who may not be listed in the AGI geoscience directory because of a different subspe- cialty, such as biological oceanography.
We needed a method to accommodate the different ranking criteria and differ- ent disciplines among the six institutions studied. Some institutions had different job titles (full professor vs. senior scien- tist) and also listed staff under several subdisciplines within oceanography. For example, Woods Hole Oceanographic Institution does not have faculty per se, but they have a scientist rank that rough- ly follows faculty ranking. To equalize our data, we included only scientists and departments in the four major ocean- ography disciplines discussed earlier (i.e., physical, chemical, biological, and geological oceanography). Schools or departments of coastal studies, engineer- ing, and policy were not included. In addition, only faculty in tenure-track or tenure-track-equivalent job titles (e.g., associate scientist) were included. Not in- cluded in our analysis were research posi- tions, which usually imply that a higher proportion of salary comes from research grants rather than guaranteed by the in- stitution, and emeritus positions.
Some scientists were diffi cult to place in one category because their subspecial- ty belonged in more than one category.
If no specifi c department was listed for a scientist (e.g., at Oregon State Univer- sity), we used their research information
to place them into an appropriate cate- gory. For example, a scientist whose re- search area is defi ned as nutrient cycling was placed in chemical oceanography, but if organisms themselves were the re- search focus, the scientist was considered a biological oceanographer. A total of 411 scientists were counted, of which 353 (83.5 %) were men and 68 (16.5 percent) were women.
As was seen with the geoscience de- partment data (Figure 8), most men (221) in the oceanography departments surveyed have reached the level of full professor (Figures 11a and 11b). In con- trast, the number of women full profes- sors is low (20 women or 9 percent), and unlike their male colleagues, the total numbers of women in all areas and ranks is surprisingly constant (Figure 11c). Because women are present in the highest numbers in the biological sci- ences (Figure 4), it might be expected that women would be represented in the
highest proportion in biological ocean- ography. Although it is true that women are in higher proportions in biological oceanography at the assistant and full professor ranks, it is not true at the as- sociate rank, where both geological and chemical oceanography have a higher proportion of women. Particularly im- pressive is the increase in the proportion of women in physical oceanography, from 1.6 percent at the full professor level to 35 percent at the assistant pro- fessor level. Relative to other fi elds, the geosciences have the highest propor- tion of women at the associate level (28 percent) and the lowest at the assistant professor level (15 percent). All of these proportions are based on very small numbers (Figures 11b and 11c), so if one or two women get promoted or fail to get promoted, they can have a large im- pact on the proportion.
All fi elds except geological oceanog- raphy (marine geology and geophysics)
0%
5%
10%
15%
20%
25%
30%
Proportion of Women (%)
Women Geoscience Faculty - all geoscience fields Women Geoscience Faculty - oceanography as primary field
Academic Rank
Head Full Associate Assistant
Figure 10. Proportion of women in tenure-track academic positions by rank at Ph.D. granting institutions who list oceanography as one of their subspecialities, compared with averages for Ph.D. programs in the geosciences for the aca- demic year 2001-2002.
Women in oceanogra-
phy are better repre-
sented at all ranks, ex-
cept department head,
than the geosciences as a
whole. Data from Claudy
(2002) and Holmes and
O’Connell (2004).
0 % 5 % 1 0 % 1 5 % 2 0 % 2 5 % 3 0 % 3 5 % 4 0 % 4 5 %
Proportion of Women (%)
0 1 0 2 0 3 0 4 0 5 0 6 0
Number of Men by Field and Rank (2004-2005)
Academic Rank
Head Full Associate Assistant
0 10 20 30 40 50
60 Biological
Chemical Geological Physical
Number of Women by Field and Rank (2004-2005)
Academic Rank
Head Full Associate Assistant
Biological Chemical Geological Physical Biological Chemical Geological Physical Total
Academic Rank
Head Full Associate Assistant