1. Introduction
Great expansion has been taking place with Chinese education since the Reform and Opening-up policies were enacted in 1978, so does Chinese private-run universities. From 2003 to 2011, ratio of private-run universities shared in all Chinese universities rose from 8.3% to 25.3%, although independent institutions steadily kept a ratio of 11.2%(1). And within 698 private-run universities, 309 of them were independent institutions(2). Obviously, the quantity growth of private-run universities could be clearly seen; however, what is the quality aspect of private-run universities like? Does current quality match the quantity growth with private-run universities? To measure the quality of private-run universities, 3 aspects could be considered: “quality of teachers”, “quality of students” and “quality of education”.
Both “quality of teachers” and “quality of students” could be understood as words implied, how are the inner aspects of teachers/students like. In terms of “quality of education”, two parts are contained, one is the quality of curriculum/lectures provided by universities, and the other is the quality of education outcomes.
Answers to quality of private-run universities might be valued /identified in many ways such as issuing questionnaire survey to teachers or students in private-run universities, conducting fieldwork directly by spending time with students at private-run universities and so forth. As seen previously, independent institutions share almost half of private-run universities. As well as referring to the particular characteristic of independent institutions “established by national universities but self- management”, it is worth to making an argument upon issues related with independent institutions separately. Hence, referring to quality aspect of private-run universities, this paper will attempt to clarify “quality of students” by analyzing setting items regarded with question “what is students’ life of independent institutions like”. Students’ life could be considered as one mirror which can appear the real pictures of how students are spending their time in private-run universities, and these pictures could directly be connected with the daily life of them in private-run universities, and surely they can straightforward indicate the quality aspect of private-run universities. Hence, basic items such as living, dieting, and studying environment which directly related to students’ life of independent institutions will
Students’ Life of Independent Institutions : Based on Dalian Neusoft University of Information
Jiangwei SHAO
be argued by this paper.
In China, private-run universities could be categorized into 3 types: private regular university(3), private college(4) and independent institution(5). One independent institution named Dalian Neusoft University (DNU) will be analyzed as a case study in this paper. Two reasons might be given out why I chose DNU. One is the outstanding development of DNU among all private-run universities in Dalian.
This university was established in 2000, and within only 15 years, it has been upgraded from college to university, which currently owns an enrollment over 14,000 students(6). The other reason, also the more important reason is the specific transformation with DNU. When DNU was built up in 2000, it was just a college where provided skilled labour forces to society by matching social needs. In 2004, it was upgraded as one independent institution, belonging to national university – the Northeastern University(7). DNU has started a master course of system engineer (MSE) with Northeastern University in 2006, and started another master course of business administration (MBA) in 2012. Besides, DNU is located in Dalian, Liaoning Province. The reason why I chose this independent institution in Dalian, Liaoning as one case study is because of the impressive development with higher education in Dalian. Liaoning Province is one of the best five provinces in China where private-run universities well developed, and development of private-run universities in Dalian is fascinating attractive inside Liaoning Province.
Overall, aim of this paper is to clarify the students’ life in independent institution. In other words, it will attempt to clear how students are spending their life in independent institution by seeing 17 setting items directly related with them. Basic structure of this paper is formed by 4 parts. Firstly, previous literature will be examined (Chapter 2). Secondly, basic information of samples and variables will be explained, as well, 17 setting items will be introduced (Chapter 3). Thirdly, basic data distribution of 17 setting items will be introduced; as well, distribution of 17 setting items with 3 independent variables will be seen and argued (Chapter 4). And finally, conclusion will be summarized and discussion will be made.
2. Literature Review
In terms of quality of private-run universities in China, a few previous literatures could be found.
Bao (2006) analyzed the mechanism of social needs with private-run higher education institutions in China, and found that the social needs in China promoted the development of private-run universities.
Li (2007) made one questionnaire survey about students’ awareness and analyzed by many variables, in which, impacts of long-term family factors and short-term financial barriers on enrollment were both actors influenced higher education attendance was clarified, however , it only discussed about students’
awareness of national universities. Nanbu (2011) summarized the current circumstance of transnational universities in China, and in which, statement of universities established by both Chinese government and foreign countries or areas was clarified. Ruth etc. (2011) discussed 12 universities in China about
the establishment, financial aspect and so forth, and in which 3 private-run universities were involved.
Also, in which, the establishment of national universities and private-run ones were compared. Su (2011) issued questionnaire surveys and examined the operation of private-run universities, which were centrally conducted among school leaders in private-run universities, information related with students were not found. Based on Chinese Statistics Yearbook, Zhou and Zhong (2014) made a report, and in which, laws referring to private-run universities were categorized and summarized. Lu (2011) took Sanya University for an example and described the historical development of private-run university. In which, most resources were originally based on meetings or conferences related to the case of Sanya University. Similarly, Zhang, Liu (2011) emphasized the operation system of private-run universities based on the school management. All papers above more or less mentioned about the quality of private- run universities. Moreover, there is one thing that all papers above could commonly share: awareness related to students was rarely mentioned.
To clarify what kind of students enrolled in independent institutions, Shao (2014) had argued about the awareness of students in Qingdao University of Technology, of which, reasons of enrollment, satisfaction with learning environment of independent institutions, ideological impression to higher education system in China, factors which had influenced or will influence the development of private- run universities and so forth were argued. It identified students who failed in national universities enrolment but still wanted to award a 4-year university graduation certificate, tried to enroll independent institutions. However, it did not make any arguments or discussion referring to students’ life of independent institutions. Relatedly, Shao (2015) examined the students’ life in private college, and found that doing part-time jobs or not had an effect on academic learning of students in private college. Again, it did not mention about students’ life of independent institution. In all, as literature argued above, rarely papers referring to students’ awareness of private-run universities could be found.
The goals of this paper could be summarized as: 1 to clarify the distribution of students’ life in independent instructions, 2 to compare what kind of differences exists between male and female students with their daily life in independent institutions, 3 to identify what kind of differences could be seen among large-scale, mid-scale and countryside with students’ life in independent institutions, and 4 to find out how university enrolment grade to national admission lines affected the students’ life in independent institutions.
3. Samples and Variables
Questionnaire survey named “Awareness of Students on Private-run Universities” was distributed and collected in DNU in November, 2014. The response papers collected totally was 171. After data selection, available data response ratio was 87.1 % (N=149, of 171). Data analyzed in this paper is “Q15: Answer
the questions referring to personal daily life, and choose only one frequency level from 6 choices for each setting item.” 17 setting items related to students’ life were contained in Q15. Basic design of these 17 setting items was based on studying, living, privacy and so forth, and these would be divided into 6 categories. Each item was measured by six frequency levels as: “none at all”, “once per six months”,
“once per month”, “once per week”, “several times per week” and “almost every day”. And these 17 setting items would become major dependent variables in this study.
Obviously as shown above, previous literature rarely mentioned about awareness of students in private-run universities, particular related with students life in private-run universities. Since DNU is a natural science and engineering school, it is important and worthy to observe the differences between male and female. With the great expansion of urbanism in China, it is interesting to see the awareness differences of students among city scales. As well, to ensure the enrollment to universities, department of education in each province made grade lines in admission period. These grade lines become important aspect of judging the “quality of students”. Hence, referring those mentioned above, 3 variables namely “gender”, “city scale” and “university enrolment grade to national admission lines” will be used in observing the distribution of 17 setting items in this paper.
Referring to both research questions and goals of this paper above, variable “gender” will be used as explaining the differences between male and female students. Variable “city scale” will take a look at differences among different city types (3 types as: large-scale cities, mid-scale cities and countryside).
And finally variable “university enrolment grade to national admission lines(8)” will attempt to observe differences exist among students who reached different national admission lines by university enrolment grade. Centered with research questions, main discussion will be argued, especially focus on significant differences with 17 setting items by 3 independent variables. Data analyses were coped by IBM SPSS Statistics 22.
4. Data analysis
4.1. Whole distribution of 17 setting items
Whole distributions of 17 setting items were given out in Chart 1. As introduced previously, 17 setting items would be divided into 6 categories, which specifically named as: “lectures or academic textbooks directly related” (A, B and C), “non-academic books related reading” (D, E and F), “the use of media or internet” (G and H), “personal private activities” (I, J, K and O), “social activities” (M, P and Q) and
“cleaning and part-time job” (L and N). Basic trend of each category is just as follows.
4.1.1. Lectures or academic textbooks directly related (A, B and C)
This category directly indicated how students attending lectures or reading academic textbooks, in
51.051.02.6 2.6
26.226.235.635.622.822.8
43.043.06.0 6.0 51.751.74.7 4.7
14.114.16.0 6.0
27.527.518.818.814.814.8
10.110.118.118.112.812.8 15.415.44.7 4.7
8.1 8.1 36.236.210.710.7
30.930.96.7 6.7 10.110.14.7 4.7
5.4 5.4 5.4 5.4
12.812.816.816.812.812.8
10.710.77.4 7.4 6.0 6.0 12.112.13.4 3.4
14.814.812.812.822.122.1
12.112.126.926.99.4 9.4 11.411.4
9.4 9.4 8.7 8.7
16.816.823.623.621.521.5
16.116.114.814.814.814.8 12.112.124.224.2
26.226.26.7 6.7 24.324.3
4.7 4.7 36.336.37.4 7.4 29.529.5
23.523.519.519.5
29.529.517.417.421.521.5
30.930.924.224.233.533.5 8.1 8.1 38.338.3
18.118.16.7 6.7 17.417.4
8.1 8.1 17.417.415.415.428.928.9
29.529.526.826.8
11.411.417.417.418.818.8
25.525.526.826.824.224.2 1.3 1.3 26.826.8
6.6 6.6 2.0 2.0 2.7 2.7
1.2 1.2 6.7 6.7 6.0 6.0 20.820.8
18.118.133.633.6
2.0 2.0 6.0 6.0 10.610.6
6.7 6.7 8.7 8.7 8.7 8.7 0%20%40%60%80%100%N: to do part-time jobsL: to do cleaning
Q: to attend school eventsP: to attend social practiceM: to attend local activities
O: to travelK: to diet with friendsJ: to date with boyfriend/girlfriendI: to do sports
H: to play games by television or internetG: to check/read news by television or internet
F: to attend learning seminarE:to read magazines or manga booksD: to read non-academic books
C: to read academic textbooksB: to pre-review lectureA: to review lecture none at allonce per six monthsonce per monthonce per weekseveral times per weekalmost every day Chart 1. Distribution of 17 setting items related to students’ life
which, A, B and C 3 items were contained. Three items A, B and C showed similar trend, that over 50%
students were reviewing/pre-reviewing lecture or reading academic textbooks at least “once per week”.
It could conclude that students are acting well as they should be in independent institution.
4.1.2. Non-academic books related reading (D, E and F)
Items D, E and F were summarized as one category to describe the circumstance of students in non- academic books related reading. Different trends could be seen with items D, E and F. Item D showed that 21.5% of students read non-academic books “once per month”, and the same frequent level with items E and F could be read as 23.6% and 16.8%. On the contrary, frequent level of “none at all” with items D, E and F separately showed as 14.8%, 18.8% and 27.5%. Trend of this category could be described as over half students in independent institutions were showing effort on reading non-academic textbooks, however, less effort on reading manga/magazines or attending learning seminar.
4.1.3. The use of media or internet (G and H)
Continually, media or internet use of students contains two items G and H. Two items both G and H indicated that students were frequently using television or internet checking/ reading news or playing games. Focusing on the frequent level of “several times per week” above, we could easily found that 60.4% students were checking/reading news by television or internet, meanwhile the ratio of students who played games by television or internet was 47.6%. Wholly, it can easily conclude that internet has become an important part of students’ daily life.
4.1.4. Personal private activities (I, J, K and O)
In terms of category personal private activities, I, J, K and Q 4 items were included. These 4 items show different trends separately. Firstly, we could see that 79.2% of students of independent institutions did sports “once per week” above. Apparently, while students acting properly as they were expected in studying, they also tried to keep themselves outdoors. Dramatically, item J showed that 51.7% of students had no date with boyfriend/girlfriend at all. Furthermore, if “once per six month” were counted, no date with boyfriend/girlfriend ratio of students could be counted as 61.8%. In other words, it indicated that most students were single, and which could perfectly match the trend of item K. Item K showed that 60.4% students dieted with friends “once per week” above. Since single students shared over half of all, “to diet with friends” essentially became main trend of them. Finally, we will observe trend of item O. Obviously we could see that over 70% of students rarely travel. Two reasons might be considered to this. One is that students were obligated to attend school lectures which made them have little time to travel during school term. The other reason is probably because of the economy
circumstance of students. Currently, most students were still get funded by parents, economically they were not independent. However, there is still a few students who could travel “once per week”, “several times per week” or even “almost every day”. These students were most probably being considered as ones from economical wealthier families.
4.1.5. Social activities (M, P and Q)
Referring to the aspects of social activities, M, P and Q 3 items could be summarized as one category.
Items both M and Q showed similar trend that over 40% of students attended local or school events
“once per week”. The local or school events might be considered as societies events hold by students from the same or other universities. On the contrary, over 70% students were not actively in attending social practice(9). Therefore, basic trend of this category could be understood as students were actively in attending local or school events, but less active to social practice.
4.1.6. Cleaning and part-time job (L and N)
Finally, cleaning and part-time job were two special items were categorized together to examine.
According to Chart 1, we could find that almost 90% students were doing cleaning “over once per week”, and degree of “almost every day” with students even shared 26.8%. It could be connected with the obligation of cleaning in most universities(10). Clearly we could see that over half students were not doing part-time job at all. If degrees “once per month” below were counted, the ratio of students who were not doing part-time jobs would rise to more than 3 quarters. Two facts/reasons could be given to this. One is that most students of independent institutions were from economically wealthier families.
Thus, it is not necessary for most to do part-time jobs. And the other reason is because the school was located in suburban areas. Because of both economical and geographical reasons, most students were not doing part time jobs, which directly resulted that most of them were available to attend school events, do sports or focus on studying.
4.2. Distribution of 17 setting items seen by 3 variables
Section above argued distribution of 17 setting items directly related with students’ life in independent institutions. Through which, we could find that students of independent institutions were as expected in lectures reviewing/pre-reviewing or textbook reading. As well, students used internet and media frequently in their daily life. Since most students were single, dieting with friends became one part in their daily life. In the aspect of social activities, most students were not active in social practice, but active in attending local/school activities, and so forth were clarified. Continually, in this section, data analysis of 17 setting items will be measured by 3 variables: “gender”, “city scale” and “university
enrolment grade to national admission lines”.
4.2.1. Gender
At first, we will take a look at the differences with 17 setting items by variable “gender” (in Table 1).
Referring to categories’ distributions introduced previously, and according to Table 1, 4 distribution trends could be summarized. Firstly, almost half of female students read academic textbooks “once per week”, and which was double as male students did at the same frequency level. In terms of all frequent levels, male students were polarized. As well, in terms of both “to review lecture” and “to pre-view
Table 1. Distribution of 17 setting items seen by “gender”
Setting items Gender None
at all Once per
six months Once per
month Once per
week Several times per week Almost
every day Total
(N) p
A: to review lecture Male
Female 14.3
9.1 5.7
6.8 18.1
6.8 34.3
31.8 19.0
36.4 8.6
9.1 100.0 (105) 100.0 (44) n.s.
B: to pre-view lecture Male
Female 19.0
15.9 6.7
9.1 19.0
4.5 23.8
25.0 22.9
36.4 8.6
9.1 100.0 (105) 100.0 (44) n.s.
C: to read academic
textbooks Male
Female 11.4
6.8 13.3
4.5 17.1
13.6 22.9
50.0 26.7
22.7 8.6
2.4 100.0 (105) 100.0 (44) * D: to read
non-academic books Male
Female 15.2
13.6 14.3
9.1 20.0
25.0 21.0
22.8 16.2
25.0 13.3
4.5 100.0 (105) 100.0 (44) n.s.
E: to read magazine or
manga books Male
Female 21.0
13.6 15.2
20.5 22.9
25.0 20.0
11.4 13.3
27.3 7.6
2.2 100.0 (105) 100.0 (44) n.s.
F: to attend learning
seminar Male
Female 25.7
31.8 13.3
11.3 15.2
20.5 28.7
31.8 15.2
2.3 1.9
2.3 100.0 (105) 100.0 (44) n.s.
G: to check/read news by television or internet Male
Female 5.7
6.8 6.7
2.3 9.5
6.8 21.9
13.6 27.6
25.0 28.6
45.5 100.0 (105) 100.0 (44) n.s.
H: to play games by
television or internet Male
Female 5.7
34.1 5.7
4.5 10.5
6.8 24.8
20.5 34.3
18.2 19.0
15.9 100.0 (105) 100.0 (44) **
I: to do sports Male
Female 4.8
4.5 4.8
4.5 15.2
2.3 21.9
47.7 32.5
20.5 21.8
20.5 100.0 (105) 100.0 (44) * J: to date with boyfriend/
girlfriend Male
Female 51.4
52.3 11.4
6.8 8.6
11.4 10.5
0.0 14.3
18.2 3.8
11.4 100.0 (105) 100.0 (44) n.s.
K: to diet with friends Male
Female 7.5
2.3 6.7
6.8 28.6
22.7 32.4
45.5 18.1
15.9 6.7
6.8 100.0 (105) 100.0 (44) n.s.
O: to travel Male
Female 42.9
43.2 27.6
38.6 12.4
11.4 6.6
0.0 9.5
4.5 1.0
2.3 100.0 (105) 100.0 (44) n.s.
M: to attend social
activities Male
Female 21.0
27.3 13.3
4.5 20.0
27.3 22.9
27.3 20.0
11.4 2.8
2.3 100.0 (105) 100.0 (44) n.s.
P: to attend social
practice Male
Female 33.3
40.9 37.1
34.1 12.4
13.6 8.6
2.3 6.7
6.8 1.9
2.3 100.0 (105) 100.0 (44) n.s.
Q: to attend school events Male
Female 21.9
36.4 8.6
6.8 15.2
13.6 27.7
22.8 19.0
15.9 7.6
4.5 100.0 (105) 100.0 (44) n.s.
L: to do cleaning Male
Female 2.8
2.3 3.8
6.7 3.8
2.3 23.8
25.0 42.9
27.3 22.9
36.4 100.0 (105) 100.0 (44) n.s.
N: to do part-time jobs Male
Female 43.8
68.2 18.1
9.1 11.4
13.6 16.2
2.3 8.6
6.8 1.9
0.0 100.0 (105) 100.0 (44) *
*<.05, **<.01
lecture”, frequency level over “once per week” indicated that female students were more patient than male ones. Therefore, we could say that in terms of “lectures or academic textbooks directly related”, all students act as they were thought to be, however, female students were more patient than male ones.
On the contrary, secondly, more male students were playing games by television or internet than female ones did. The ratio of frequency level “once per week” above of male students even reached 78.1%. These two items mentioned above could be easily connected. Since female students focused on academic studying, therefore they spend less time than male students did on games playing by television or internet. Thirdly, female students were more frequent doing sports than male students.
Concerned with the high ratio of all students who were doing sports, we could discover that most students were active in sports, and female students were more active than male ones. Fourthly, although distribution of whole indicated that most students were not doing part time jobs, there were still more male students doing part time jobs than female students.
In all, we could conclude that female students were more active in both academic textbooks reading and doing sports than male ones, however, male students were spending more time than female ones in both playing games through television or internet and doing part-time job.
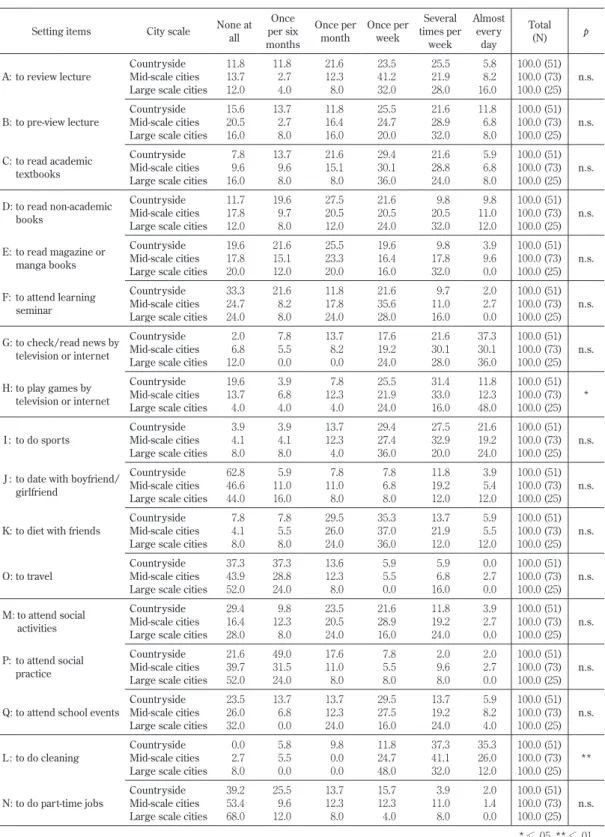
4.2.2. City scale
Continually, distributions with variable “city scale” will be examined. “City scale” was divided into 3 types: large-scale cities, mid-scale cities and countryside(11). As shown in Table 1, two items “to play games by television or internet” and “to do cleaning” could find significant differences. Students from countryside were less playing games by television or internet than ones from large-scale cities, but almost equaled to ones from mid-scale cities. Students from large-scale cities even played games “almost every day” by 48.0%. And this could be connected with the environment of students living since they were young. Students from countryside were economically less wealthy than those from large-scale or mid-scale cities, and for some of them were even not get internet or television equipped as young.
Students from large-scale cities usually get used to live in facilities well-equipped environment, which could easily result like this. Opposite to playing games by internet or television, in item of cleaning, frequency with students from countryside did cleaning “almost every day” was 35.3%, but only 12.0%
with ones from large-scale cities. This also could be related with the economic condition of students.
In independent institutions, students from large-scale cities were more often get daily issues done by housekeeper since they were young.
In all, because the living environment affected students since they were young, students from countryside were less playing games by television or internet than ones from large-scale cities, but almost equaled to ones from mid-scale cities.
Table 2. Distribution of 17 setting items seen by “city scale”
Setting items City scale None at
all
Once per six months
Once per
month Once per week
Several times per
week
Almost every
day
Total
(N) p
A: to review lecture
Countryside Mid-scale cities Large scale cities
11.8 13.7 12.0
11.8 2.7 4.0
21.6 12.3 8.0
23.5 41.2 32.0
25.5 21.9 28.0
5.8 8.2 16.0
100.0 (51) 100.0 (73) 100.0 (25) n.s.
B: to pre-view lecture Countryside Mid-scale cities Large scale cities
15.6 20.5 16.0
13.7 2.7 8.0
11.8 16.4 16.0
25.5 24.7 20.0
21.6 28.9 32.0
11.8 6.8 8.0
100.0 (51) 100.0 (73) 100.0 (25) n.s.
C: to read academic textbooks
Countryside Mid-scale cities Large scale cities
7.8 9.6 16.0
13.7 9.6 8.0
21.6 15.1 8.0
29.4 30.1 36.0
21.6 28.8 24.0
5.9 6.8 8.0
100.0 (51) 100.0 (73) 100.0 (25) n.s.
D: to read non-academic books
Countryside Mid-scale cities Large scale cities
11.7 17.8 12.0
19.6 9.7 8.0
27.5 20.5 12.0
21.6 20.5 24.0
9.8 20.5 32.0
9.8 11.0 12.0
100.0 (51) 100.0 (73) 100.0 (25) n.s.
E: to read magazine or manga books
Countryside Mid-scale cities Large scale cities
19.6 17.8 20.0
21.6 15.1 12.0
25.5 23.3 20.0
19.6 16.4 16.0
9.8 17.8 32.0
3.9 9.6 0.0
100.0 (51) 100.0 (73) 100.0 (25)
n.s.
F: to attend learning seminar
Countryside Mid-scale cities Large scale cities
33.3 24.7 24.0
21.6 8.2 8.0
11.8 17.8 24.0
21.6 35.6 28.0
9.7 11.0 16.0
2.0 2.7 0.0
100.0 (51) 100.0 (73) 100.0 (25) n.s.
G: to check/read news by television or internet
Countryside Mid-scale cities Large scale cities
2.0 6.8 12.0
7.8 5.5 0.0
13.7 8.2 0.0
17.6 19.2 24.0
21.6 30.1 28.0
37.3 30.1 36.0
100.0 (51) 100.0 (73) 100.0 (25) n.s.
H: to play games by television or internet
Countryside Mid-scale cities Large scale cities
19.6 13.7 4.0
3.9 6.8 4.0
7.8 12.3 4.0
25.5 21.9 24.0
31.4 33.0 16.0
11.8 12.3 48.0
100.0 (51) 100.0 (73) 100.0 (25) * I: to do sports Countryside
Mid-scale cities Large scale cities
3.9 4.1 8.0
3.9 4.1 8.0
13.7 12.3 4.0
29.4 27.4 36.0
27.5 32.9 20.0
21.6 19.2 24.0
100.0 (51) 100.0 (73) 100.0 (25) n.s.
J: to date with boyfriend/
girlfriend
Countryside Mid-scale cities Large scale cities
62.8 46.6 44.0
5.9 11.0 16.0
7.8 11.0 8.0
7.8 6.8 8.0
11.8 19.2 12.0
3.9 5.4 12.0
100.0 (51) 100.0 (73) 100.0 (25) n.s.
K: to diet with friends Countryside Mid-scale cities Large scale cities
7.8 4.1 8.0
7.8 5.5 8.0
29.5 26.0 24.0
35.3 37.0 36.0
13.7 21.9 12.0
5.9 5.5 12.0
100.0 (51) 100.0 (73) 100.0 (25) n.s.
O: to travel
Countryside Mid-scale cities Large scale cities
37.3 43.9 52.0
37.3 28.8 24.0
13.6 12.3 8.0
5.9 5.5 0.0
5.9 6.8 16.0
0.0 2.7 0.0
100.0 (51) 100.0 (73) 100.0 (25) n.s.
M: to attend social activities
Countryside Mid-scale cities Large scale cities
29.4 16.4 28.0
9.8 12.3 8.0
23.5 20.5 24.0
21.6 28.9 16.0
11.8 19.2 24.0
3.9 2.7 0.0
100.0 (51) 100.0 (73) 100.0 (25) n.s.
P: to attend social practice
Countryside Mid-scale cities Large scale cities
21.6 39.7 52.0
49.0 31.5 24.0
17.6 11.0 8.0
7.8 5.5 8.0
2.0 9.6 8.0
2.0 2.7 0.0
100.0 (51) 100.0 (73) 100.0 (25)
n.s.
Q: to attend school events Countryside Mid-scale cities Large scale cities
23.5 26.0 32.0
13.7 6.8 0.0
13.7 12.3 24.0
29.5 27.5 16.0
13.7 19.2 24.0
5.9 8.2 4.0
100.0 (51) 100.0 (73) 100.0 (25) n.s.
L: to do cleaning Countryside Mid-scale cities Large scale cities
0.0 2.7 8.0
5.8 5.5 0.0
9.8 0.0 0.0
11.8 24.7 48.0
37.3 41.1 32.0
35.3 26.0 12.0
100.0 (51) 100.0 (73) 100.0 (25) **
N: to do part-time jobs Countryside Mid-scale cities Large scale cities
39.2 53.4 68.0
25.5 9.6 12.0
13.7 12.3 8.0
15.7 12.3 4.0
3.9 11.0 8.0
2.0 1.4 0.0
100.0 (51) 100.0 (73) 100.0 (25) n.s.
*<.05, **<.01
4.2.3. University enrolment grade to national admission lines
Finally, we will take an eye on variable “university enrolment grade to national admission lines”.
3 levels were designed to this variable: “the second-batch”, “the third-batch” and “college”(12). Significant Table 3. Distribution of 17 setting items seen by “university enrolment grade to admission lines”
Setting items University enrolment grade to admission lines
None at all
Once per six months
Once per
month Once per week
Several times per
week
Almost every
day Total p
A: to review lecture The second batch The third batch College
12.5 12.513.3
7.5 6.24.4
12.5 15.615.6
32.5 34.433.3
30.0 18.826.7
5.0 12.56.7
100.0 (40) 100.0 (64) 100.0 (45) n.s.
B: to pre-view lecture The second batch The third batch College
17.518.8 17.8
10.07.8 4.4
20.012.5 13.3
17.525.0 29.0
32.525.0 24.4
10.92.5 11.1
100.0 (40) 100.0 (64) 100.0 (45) n.s.
C: to read academic textbooks
The second batch The third batch College
7.5 12.5 8.9
15.0 9.4 8.9
10.0 18.8 17.8
30.0 29.7 33.3
32.5 21.9 24.4
5.0 7.8 6.7
100.0 (40) 100.0 (64) 100.0 (45) n.s.
D: to read non-academic books
The second batch The third batch College
5.0 20.315.6
17.5 10.911.0
25.0 14.128.9
12.5 31.315.6
27.5 17.213.3
12.5 15.66.2
100.0 (40) 100.0 (64) 100.0 (45) * E: to read magazine or
manga books
The second batch The third batch College
25.05.0 22.2
20.015.6 15.6
30.023.4 17.8
15.018.8 17.8
22.514.1 17.8
7.53.1 8.8
100.0 (40) 100.0 (64) 100.0 (45) n.s.
F: to attend learning seminar
The second batch The third batch College
20.0 29.7 31.1
12.5 14.1 11.1
10.0 20.3 17.8
32.5 28.1 28.9
22.5 7.8 6.7
2.5 0.0 4.4
100.0 (40) 100.0 (64) 100.0 (45) n.s.
G: to check/read news by television or internet
The second batch The third batch College
5.04.7 8.9
2.57.8 4.4
10.97.5 6.7
17.523.5 15.6
30.028.1 22.2
37.525.0 42.2
100.0 (40) 100.0 (64) 100.0 (45) n.s.
H: to play games by television or internet
The second batch The third batch College
5.0 14.1 22.2
2.5 4.6 8.9
7.5 9.4 11.1
22.5 29.7 15.6
35.0 29.7 24.4
27.5 12.5 17.8
100.0 (40) 100.0 (64) 100.0 (45) n.s.
I : to do sports The second batch The third batch College
2.5 6.34.4
2.5 3.08.9
15.0 14.14.4
22.5 34.428.9
35.0 20.335.6
22.5 21.917.8
100.0 (40) 100.0 (64) 100.0 (45) n.s.
J : to date with boyfriend/
girlfriend
The second batch The third batch College
40.053.2 60.0
10.010.9 8.9
12.510.9 4.4
10.09.4 2.3
22.57.8 20.0
5.07.8 4.4
100.0 (40) 100.0 (64) 100.0 (45) n.s.
K: to diet with friends The second batch The third batch College
5.0 4.7 8.9
10.0 6.3 4.4
32.5 29.7 17.8
32.5 40.6 33.4
15.0 14.1 24.4
5.0 4.6 11.1
100.0 (40) 100.0 (64) 100.0 (45) n.s.
O: to travel The second batch
The third batch College
35.0 46.944.4
32.5 26.635.6
12.5 15.66.7
10.0 3.02.2
10.0 6.38.9
0.0 1.62.2
100.0 (40) 100.0 (64) 100.0 (45) n.s.
M: to attend social activities
The second batch The third batch College
22.521.9 24.4
10.015.6 4.4
27.521.9 17.8
22.520.3 31.2
12.518.8 20.0
5.01.5 2.2
100.0 (40) 100.0 (64) 100.0 (45) n.s.
P: to attend social practice
The second batch The third batch College
42.5 32.8 33.3
35.0 35.9 37.9
7.5 15.6 13.3
12.5 4.7 4.4
2.5 7.8 8.9
0.0 3.2 2.2
100.0 (40) 100.0 (64) 100.0 (45) n.s.
Q: to attend school events The second batch The third batch College
35.0 28.115.6
10.0 7.86.6
17.5 12.515.6
12.5 28.135.6
20.0 17.217.8
5.0 6.38.9
100.0 (40) 100.0 (64) 100.0 (45) n.s.
L : to do cleaning The second batch The third batch College
2.53.1 2.2
5.06.3 2.2
5.03.1 2.2
25.028.1 17.8
37.537.5 40.0
25.021.9 35.6
100.0 (40) 100.0 (64) 100.0 (45) n.s.
N: to do part-time jobs The second batch The third batch College
45.0 54.7 51.1
25.0 15.6 6.7
7.5 9.4 20.0
10.0 14.1 11.1
7.5 6.2 11.1
5.0 0.0 0.0
100.0 (40) 100.0 (64) 100.0 (45) n.s.
*<.05
difference could only be seen in one item “to read non-academic books”.
The better universities enrolled, the more students were reading novels. It also could be understood as students graded to “the second-batch” above could not only learn academic textbooks, but also vastly study non-academic books to enrich their knowledge.
5. Conclusion
Above all, students’ life in DNU was both overviewed by distributions of 17 setting items and specially differences examined by 3 variables. Conclusions could be summarized as follows.
In term of distribution with 17 setting items, 3 results could be shown. Firstly, students were spending their life just as students should be with their studying in reading academic textbooks. Most students showed effort on reading non-academic textbooks and less effort on reading manga/ magazines or attending learning seminars. Female students were more patient than male ones in learning. Seen by city scale, trend with learning could be seen as large-scale cities > mid-scale cities > countryside.
Internet has become one important part in students’ daily life. Secondly, because of obligation of attending school lectures, also influenced by economical circumstance, students were rare to travel.
However, most of them kept themselves outdoors to do sports. As well, since most students were single, many of them chose to diet with friends frequently. Thirdly, students were actively in attending school events, but not that active in processing social practices. Because of the obligation of cleaning, most students at independent institution do cleaning quite often. Due to the geographically location, most students were not doing part time jobs.
As well as distribution of 17 setting items, 3 conclusions could be summarized by seeing differences with 3 variables. 1), Female students were more active in academic textbooks reading, more doing sports than male ones did, however, male students were spending more time than female ones in both playing games through television or internet and doing part-time job. 2), because the living environment affected students since they were young, students from countryside were less playing games by television or internet than ones from large-scale cities, but almost equaled to ones from mid-scale cities.
3), Students graded to “the second-batch” could not only learn academic textbooks, but also vastly study non-academic books to enrich their knowledge.
Seen by the variable “university enrolment grade to admission lines”, we could notice that below half students in DNU scored over “the second-batch”. The poor quality of students in enrolment period could directly result the learning outcomes after they entered independent institution. As well, we could find students from large-scale cities appear higher than mid-scale cities, mid-scale cities show higher than countryside students on learning. On the contrary students from countryside did part time jobs most.
As well, female students were more active in learning than male students, while less active in doing
part time jobs than male ones. Above those, we could conclude that “quality of students” in independent institution DNU was not as good as national universities. Thus, quality ensuring with students in independent institution might become one topic to argue.
Though the quality of students in independent institution is not as good as national universities, private-run universities remain taking the responsibility of accepting more students who willing to receive higher education, and trying to educate skilled labour force to construct Chinese society. How to ensure the quality at enrolment period with private-run university becomes one topic to argue. As well, this paper observed distributions of 17 setting items and argued differences by seeing variables
“gender”, “city scale” and “university enrolment grade to admission lines”. Apparently, this paper mainly focused on independent institutions, what about students’ life in other two types of private-run universities being like? What about private-run universities in other provinces in China being like?
Furthermore, how much do variables as “parental’ wages” or “parental education levels” and so forth influenced students’ life? These will be topics in future studies.
Note⑴ Haitao Zhou, Binglin Zhong (2014). Zhongguo minban jiaoyu fazhan baogao 2012 [A report of development of private-run schools in China 2012]. Beijing Normal University Publishing Group. pp.1–2. China Non- government Higher Education Information (CNHEI)
http://www.cnhei.com.cn/News/20140822/201408221025021375.html (Access:2015/03/13)
⑵ Ibid.
⑶ Jiangwei Shao (2013) Development of private universities in China: A historical view after China’s foun- dation year 1949―” International Symposium and Academic Exchange among Beijing Normal University, Korea University and Waseda University. pp. 43–49. As well, Jiangwei Shao (2014) Awareness research of students on private-run university: Take Qingdao University of Technology for example. p. 33. BULLETIN of the Graduate School of Education of Waseda University. Private regular university could be understood as a university of 4-year schooling. This type of university generally established by private factors, such as compa- nies, private groups or personal.
⑷ Generally, private college is almost same as private regular university, but the education system is 3-year schooling.
⑸ Independent institution is a type of university built/established by national university, however the opera- tion and management are totally running by the tuition fees charged from students without any form of finan- cial aid from mother boned university or government. However, there is a strong connection between this kind of university and its mother boned university. Because of the famousness of mother boned university, this type of private-run university is generally well accepted by students or parents. Therefore, fee charging is usually double even three times than national universities.
⑹ http://www.neusoft.edu.cn/about/about/ (Access:2015/03/19)
⑺ Ibid.
⑻ Generally, 4 levels could be used to measure university enrolment grade to national admission lines, which are namely “the first-batch line of undergraduate course colleges and universities”, “the second-batch line of undergraduate course colleges and universities”, “the third-batch line of undergraduate course colleges and universities” and “the third-batch line below (college)”.
⑼ Social practice is generally existed in most universities in China. The basic aim of social practice is to increase the social responsibility of students and make them be active in social events participating.
Generally, the process and feeling of attended social practice will be summarized as report to university. This is normally considered as one part of moral education in evaluating or applying scholarship.
⑽ Cleaning here mentioned not only tidying up personal stuff, also referring the cleaning of each class in university. Most universities in China instruct that cleaning as one obligation in daily life for students, and operate that cleaning will be counted as one part of students’ moral education.
⑾ Chinese Council has established “Notice on Adjusting Classification Standard by City Scale” in November 21st, 2014. The details could be categorized into seven ranks as: small cities below 500,000 (two types includ- ed: I 200,000–500,000 and II l200,000 below), middle cities populated 500,000–1,000,000, big cities populated 1–5 million(two types I 3–5 million and II 1–3 million), 5–10 million extra big cities and above 10 million super big cities. City scale referred here just been divided into 3 groups: 1,000,000 below as countryside, 1–5 million as mid-scale cities and above 5 million as large-scale cities.
⑿ To measure university enrolment grade to national admission lines, 4 levels are available: the first-batch, the second-batch, the third-batch and college. Since only few students in DNU reached the first-batch, there- fore, this paper will summarized the first-batch and the second-batch as one level “the second-batch”.
References
Dan Lu (2011). Minban daxue de chushi jihua [The establishment plans of private-run univerities]. Fudan press.
Haitao Zhou, Binglin Zhong (2012). Zhongguo minban jiaoyu fazhan baogao 2012 [A report of development of pri- vate-run schools in China 2012]. Beijing Normal University Publishing Group.
Hirotaka Nanbu(2011). Cyugoku ni okeru toransu nasyonaru koutou kyouiku:naigai kyouryoku niyoru daigaku unei no genjyo [Transnational higher education in China: current statement of university management between power inside and outside China]. A report of transnational education research in the world (final report).
Jiangwei Shao (2013). Development of private universities in China: A historical view after China’s foundation year 1949. International symposium and academic exchange among Beijing Normal University, Korea University and Waseda University.
― (2014). Awareness research of students on private-run universities-Take Qingdao University of Technology for example. Bulletin of the Graduate School of Education of Waseda University.
― (2015). Awareness of students in private-run universities: Take Shandong Vocational College of Foreign Affair Translation for example. Bulletin of the Graduate School of Education of Waseda University. Vol. 16. pp. 111–118.
Ruth Hayhoe, Jun Li, Jing Lin, Qiang Zha (2011). Portraits of 21st century Chinese universities: In the move to mass higher education. Comparative Education Research Centre The University of Hong Kong.
Spring Su (2011). Property ownership and private higher education in China. Lexington Books.
Wei Bao (2006). Cyugoku no minei koutou kyouiku kikan: syakai niizu to no taioi [Private higher education institution in China: Responding to the society’s needs]. Toshindou.
Wenli Li (2007). Family background, financial constraints and higher education attendance in China. Economics of Education Review 26(2007) pp. 725–735.
Yongjun Zhang, Xiang Liu (2011) One: Minban xuexiao jinglve [Management of private-run universities]. Jiuzhou Press.
― (2011) Two: Minban xuexiao jinglve [Management of private-run universities]. Jiuzhou Press.
ABSTRACT
Students’ Life of Independent Institutions:
Based on Dalian Neusoft University of Information
Jiangwei SHAO
From 2003 to 2011, ratio of private-run universities shared in whole Chinese higher education rose from 8.3% to 25.3%. It is easy to observe the quantity growth with private-run universities, however, what about the quality development of current private-run universities is one question to be solved. Previous literatures related to this field were mainly focusing on management of private-run universities, histori- cal development of private-run universities or analysis of the current law of private-run schools. On the aspect of students’ awareness, there are only a few papers could be found. Even though, these papers are not directly related with analysis of students’ life in private-run universities. To clarify the quantity circumstance of current private-run universities, students’ life is one important aspect could not be ignored. Therefore, goal of this paper is to try to make the students’ life of private-run universities clear.
To achieve the goal, this paper will take one independent institution named Dalian Neusoft University of Information for example as a case study. In this case study, the available data are based on question- naire survey conducted with 149 students. Distribution of 17 setting items related with students’ life will firstly be analyzed, as well, these 17 setting items would be dependent variables in this paper. Following directly after that, 3 independent variables namely “gender”, “city scale” and “university enrolment grade to national admission lines” would become dependent variables to analysis the differences exist in all items. By seeing distribution differences with 3 variables on 17 setting items, trend of students’ life in private-run universities would be attempted to drawn out.
In short, this paper only analyzed one type of private-run universities - independent institution in China. In fact, three types of private-run universities exist in China. What about the students’ life being like in other two types of private-run universities is still not got cleared. As well whole trends of students’
life of private-run universities are not clarified yet. These could be thought as disadvantages of this paper, also, those might be considered as future topics to research.
Key words: Private-run universities. Students’ life. Independent institution. Questionnaire survey.
Higher education in China.