Fukushima Medical University
This document is downloaded at: 2021-11-08T00:01:57Z
Title Late Gadolinium Enhancement Predicts Improvement in Systolic Function after Aortic Valve Replacement in Patients with Severe Aortic Stenosis( 本文 )
Author(s) 藤宮, 剛
Citation
Issue Date 2019-03-22
URL http://ir.fmu.ac.jp/dspace/handle/123456789/974
Rights © The Author(s)
DOI
Text Version ETD
Late Gadolinium Enhancement Predicts Improvement in Systolic Function after Aortic
Valve Replacement in Patients with Severe Aortic Stenosis
(ガドリニウム遅延造影は重症大動脈弁狭窄症における 大動脈弁置換術後の収縮能改善の予測に有用である)
福島県立医科大学大学院医学研究科 心臓血管外科学分野
藤宮 剛
2
論 文 内 容 要 旨(和文)
学位論文題名
ガドリニウム遅延造影は重症大動脈弁狭窄症における大動脈弁置 換術後の収縮能改善の予測に有用である
【背景】大動脈弁狭窄症(AS)において、大動脈弁置換術(AVR)前の左室心筋線 維化の進行は術後予後と関連する。近年、左室収縮能の鋭敏な指標であるglobal longitudinal strain(GLS)と心筋線維化指標であるMRIによるガドリニウム遅延 造影(LGE)の関連が報告されているが、術後の左室収縮能改善の有無と術前の心 筋線維化指標との関連は不明である。
【目的】LGEによってAVR術後の左室収縮能の改善が予測可能かどうかを検討す る。
【方法】対象は重症ASのためAVRを施行した患者29例(中央値 73歳、男性52%)
であった。重症大動脈弁閉鎖不全症合併、中等度以上の僧帽弁閉鎖不全症合併、心 筋梗塞の既往や狭心症合併、心房細動合併、左脚ブロック、透析症例は除外とした。
術前に2D speckle tracking法によるGLSと、MRI画像からLGEcore(g, > 5 SD)、
LGEgray (g, 2 SD- 5 SD)、LGEcore+grayを評価した。13例では術中左室心筋生 検標本からfibrous index (FI, %)を算出した。上記各指標の関連を検討し、また術 後1年における、術後のGLS改善の予測因子を検討した。
【結果】GLSはFI(r = 0.68, p < 0.05)、LGEcore (r = 0.38, p < 0.05)LGEgray
(r = 0.57, p < 0.01)、LGEcore+gray(r = 0.60, p < 0.01)と有意に相関し、FIは LGEcore(r = 0.62, p < 0.05)、LGEcore+gray(r = 0.61, p < 0.05)と相関した。
GLSは術前に比べ術後1年で有意に改善し(GLSpre to GLSpost1year; -16.9 to -19.9%, p<0.01)、GLS改善群(GLS ≥ -19.9%, n = 14)では非改善群(n = 12)に比べ術前 のLGEcoreが有意に低値であった(改善群 vs. 非改善群; 1.34 vs. 4.70 g, p <
0.01)。多変量解析ではLGEcoreが術後収縮能改善の予測因子であった(β = 0.446, p < 0.05)。ROC解析により術後のGLS 改善を予測するLGEcore のcut-off値は 2.86 g(AUC 0.81, 感度 78.6%, 特異度83.3%)であった。
【結語】重度AS患者において、LGEcoreがAVR術後の左室収縮能改善を予測す る因子として有用である。
3
論文概要
大動脈弁狭窄症 (aortic stenosis: AS)患者において、持続的な左室心筋への圧負荷に より心筋線維化が惹起される。この左室心筋線維化が左室収縮能低下を引き起こし、
予後不良因子とされている。これまで、病初期に左室心筋に生じる diffuse fibrosis は可逆性であるが、病期の進行に伴い focal fibrosis が出現し、不可逆性となること が報告されている。
重症ASに対しては、大動脈弁置換術 (aortic valve replacement: AVR)が施行され るが、術後圧負荷が解除されたにも関わらず左室収縮能低下が進行し、心不全が出 現・進行する症例が存在する。しかしながら、術後左室収縮不全進行の予測は未だ困 難であり、適切な手術時期の見極めには左室心筋の線維化の評価を行い、AVR 後に 左室収縮能改善の予測因子となるかどうかを検討する必要がある。
これまで、左室心筋線維化の評価法として心筋生検が用いられてきたが、侵襲性が 高く、日常臨床において用いるのは困難である。近年、心臓 MRI 検査によるガドリ ニウム遅延造影検査(LGE)による心筋線維化の定量評価が行われるようになり、
LGE による大動脈弁置換術後の予後に関する報告がなされている。一方、心エコー 図法による左室収縮能の鋭敏な指標であるglobal longitudinal strain (GLS)は、左室 駆出率 (LVEF)の低下のないAS患者においても低下し、予後と関連することが報告 されている。しかしながら、LGE 指標を用いて、AVR 後の GLS 改善を予測可能か 否かは明らかでない。
今回我々は、AVR 後のGLS を指標とした左室収縮能の改善がLGE によって予測 可能か否かを明らかにすることを目的として研究を行った。
対象はAVRを予定された重症AS患者29人(平均年齢73歳、男性52%)であっ た。術前に心エコー図検査による GLS、および MRI検査によるLGE を算出した。
LGEは正常心筋を基準点とし、LGEcore (> 5 SD +基準点, focal fibrosisの指標)、
LGEgray (2 SD- 5 SD +基準点,diffuse fibrosisの指標)およびLGEcore+grayを評 価した。同意の得られた 13 例においては、術中左室心筋生検を行い、病理組織学的 検討により、心筋組織に占める割合を線維化面積 (fibrosis index: FI %)として算出し た。上記より、GLS、LGE、FI の関係を検討した。さらに、術後1 年に再度心エコ ー図検査を行い、術後GLSの改善をLGEにより予測できるかについて検討した。
全症例において、GLSはLGEcore (r = 0.38, p < 0.05)、LGEgray (r = 0.57, p < 0.01)、
LGEcore+gray (r = 0.60, p < 0.01)と相関関係を認めた。また、FIはLGEcore(r = 0.62, p < 0.05)、LGEcore+gray (r = 0.61, p < 0.05)、GLS (r = 0.68, p < 0.05)と相関関係を 認めた。
術後1年においてGLSは有意に改善した(術前 to 術後:-16.9% to -19.9%, p<0.05)。 術後GLSの中央値を用いて全症例を改善群 (術後GLS ≥ -19.9%)および非改善群 (術後GLS < -19.9%)の2群に分け、GLS改善の予測因子の検討を行った。2群間に
4
おいて、術前GLSおよびその他の心エコー図指標に差は認められなかったが、
LGEcoreは改善群で非改善群に比べ有意に小さかった。(改善群 vs 非改善群: 1.34 g vs 4.70 g, p < 0.01)。多変量解析により、LGEcoreは術後GLS改善を予測しうる独 立した規定因子であり(r = 0.446, p < 0.05)、LGEcoreのカットオフ値は2.86 g(感 度78.6%、特異度83.3%)であった。
本研究の結果から、重症AS患者におけるAVR後の左室収縮能の改善(GLS改善)
をLGEを用いて予測可能か否か検討し、以下の知見を得た。1)術前GLS、LGEお よびFIに有意な相関関係を認めた。2)LGEcoreは術後1年のGLS改善を予測する 独立した規定因子であった。3)LGEcore 2.86 gをカットオフ値として、術後 GLS 改善を予測可能であった。
無症状の重症AS患者に対する手術適応はLVEF 50%未満が推奨されているが、
LVEFが低下する前からGLSは低下し、左室心筋線維化は進行している。本研究の 結果から、LGEcoreはAVR後の収縮能改善の有用な予測因子であり、LVEFが保た れている重症AS患者における至適手術時期の決定の一助になると考えられた。
5 ABSTRACT
BACKGROUND Myocardial fibrosis, as detected by late gadolinium enhancement (LGE) magnetic resonance imaging (MRI), is related to mortality after aortic valve replacement (AVR) in patients with severe aortic stenosis (AS). However, whether LGE predicts improvement in LV systolic function after AVR remains unclear.
OBJECTIVES This study aimed to determine whether myocardial fibrosis quantified by LGE MRI predicts improvement in left ventricular (LV) systolic function after AVR in patients with severe AS.
METHODS Twenty-nine patients with severe AS who were scheduled to undergo AVR were enrolled in this study. Two-dimensional echocardiography and contrast-enhanced MRI were performed before AVR. Global longitudinal strain (GLS) as an index of LV systolic function and LGEcore (g: > 5 SD of normal area), LGEgray (g: 2 SD- 5 SD), and LGEcore+gray (g) were measured. The fibrosis index (FI, %) was assessed using intraoperative LV myocardial specimens obtained from 13 patients. One year after AVR, changes in GLS were examined by echocardiography to assess improvement in LV function.
RESULTS GLS correlated with LGEcore (r = 0.38, p<0.05), LGEgray (r = 0.57, p < 0.01) and LGEcore+gray (r = 0.60, p < 0.01), and FI correlated with LGEcore (r = 0.62, p < 0.05), LGEcore+gray (r = 0.61, p < 0.05), and GLS (r = 0.68, p < 0.05), preoperatively. GLS was significantly improved at one year after AVR (GLSbaseline to GLS1year: -16.9% to -19.9%, p <
0.05). LGEcore was significantly lower in patients with improved GLS (GLS1year ≥-19.9%) compared to those with no improved GLS (1.34 g vs. 4.70 g, p < 0.01). Multivariate analysis revealed that LGEcore independently predicts improvement in GLS after AVR (r = 0.446, p <
0.05), with a cut-off value of 2.86 g (AUC 0.81; 78.6% sensitivity and 83.3% specificity).
CONCLUSION LGE predicts improvement in LV systolic function after AVR in patients with severe AS.
KEYWORDS: Aortic stenosis; myocardial fibrosis; global longitudinal strain; late gadolinium enhancement; aortic valve replacement
6 ABBREVIATIONS
AS = aortic stenosis
AUC = area under the curve AVR = aortic valve replacement BNP = brain natriuretic protein CKD = chronic kidney disease ECV = extracellular volume EF = ejection fraction FI = fibrosis index
GLS = global longitudinal strain IQR = interquartile ratio
LAVI= left atrial volume index LGE = late gadolinium enhancement LV = left ventricle
MPG = mean pressure gradient MRI = magnetic resonance imaging SAP = systolic arterial pressure SD = standard deviation
SVi = stroke volume index Zva = valvulo-arterial impedance
7 INTRODUCTION
Aortic stenosis (AS) remains a diagnostic and therapeutic challenge especially in elderly patients. Left ventricular (LV) myocardial fibrosis is associated with progression of LV hypertrophy, which compensates for pressure overload in patients with AS. Myocardial fibrosis is classified as focal fibrosis or diffuse fibrosis, with the latter being an early phenomenon preceding the former (1). LV myocardial advanced fibrosis, especially focal fibrosis or scars, reportedly correlates with LV systolic dysfunction, and the severity of fibrosis is known to be associated with a poor late prognosis (2). In some cases, LV
dysfunction and heart failure further progress after aortic valve replacement (AVR). Therefore, the optimal timing for AVR needs to be determined while considering the grade of LV
myocardial fibrosis. While myocardial biopsy is the gold standard for detecting myocardial fibrosis, its general applicability is limited due to the invasiveness of the procedure.
Cardiac magnetic resonance imaging (MRI) is widely used for assessment of myocardial fibrosis (1). Late gadolinium enhancement (LGE) MRI is a useful method for detecting myocardial fibrosis. Myocardial fibrosis detected by LGE has been reported to correlate with late mortality in patients with AS after AVR (3).
Several studies have reported that global longitudinal strain (GLS), an index of LV systolic function assessed by echocardiography, is reduced even in AS patients with preserved LV ejection fraction (EF) (4). Impaired GLS is known to correlate with AS severity, increased left ventricular mass index (LVMI) (5), and all-cause mortality in patients with AS (6).
However, few studies have examined which preoperative examinations predict improvement in GLS after AVR.
This study aimed to examine whether LGE MRI predicts improvement in GLS after AVR in patients with severe AS.
METHODS
STUDY DESIGN AND PATIENT RECRUITMENT. This prospective observational study was conducted in 29 patients with severe AS who underwent AVR according to AHA/ACC
8
Guideline (7) from January 2014 to July 2017. Severe AS was defined as an aortic valve area
<1.0 cm2, peak aortic valve velocity >4.0 m/s, and mean pressure gradient >40 mmHg (8).
Exclusion criteria were patients with concomitant severe aortic regurgitation, moderate to severe mitral regurgitation, and a previous history of ischemic heart disease, atrial fibrillation, left bundle branch block (possibility of complete atrioventricular block by biopsy), or chronic kidney disease (CKD: eGFR <30 ml/min/1.73 m2 is a contraindication to gadolinium
enhanced-MRI) (9).
All patients underwent echocardiography and MRI prior to AVR. Myocardial biopsy specimens were collected intraoperatively from 13 patients who provided informed consent.
We evaluated relationships among the parameters of echocardiography and MRI and myocardial specimens. Echocardiography was also performed one year after AVR to assess the correlation between preoperative LGE and postoperative GLS improvement.
This study was approved by the institutional review board of Fukushima Medical University and was conducted in compliance with the principles of the Declaration of Helsinki. All patients provided written informed consent.
ECHOCARDIOGRAPHY. We performed transthoracic echocardiography to assess aortic valve function and LV systolic and diastolic function using the Acuson SC2000TM system (SIEMENS: Mountain View, CA, USA) with a 4-MHz transducer (10, 11).
Echocardiographic parameters included LV wall thickness and dimension, LV volume and LVEF, left atrium volume index (LAVI), E/A, e’, E/e’, and AS indices [aortic valve area, peak velocity, mean pressure gradient (MPG), and valvulo-arterial impedance (Zva)]. Zva was defined as the ratio of estimated LV systolic pressure (the sum of systolic arterial pressure (SAP) and MPG) to stroke volume index (SVi): Zva = (SAP+MPG)/SVi (12). LV mass index was calculated by the cube formula in the parasternal long-axis view (10).
2D-GLS was examined by 2D speckle tracking echocardiography using the SC2000 workplace system VVITM (SIEMENS: Mountain View, CA, USA). We assessed endocardial GLS as the average of GLSs in apical 2-, 3-, and 4-chamber views (Figure 1) (13).
9
CARDIAC MRI. Cardiac MRI was performed on a 1.5-T scanner (Vantage TitanTM: Canon Medical Systems, Otawara, Japan) according to the standard LGE protocol (14). Ten minutes before image acquisition, 1.0 M gadobutrol (GadovistTM: Bayer, Berlin, Germany), a
gadolinium-based contrast agent, was administered systemically to patients with eGFR ≥30 ml/min/1.73 m2.
Cardiac MRI was analyzed using a post-processing workstation (Ziostation2TM: Ziosoft, Tokyo, Japan). The contours of the LV endocardium and epicardium were traced semi-automatically in short-axis slices. The region of interest (ROI) was selected within the remote reference myocardium to set the standard deviation (SD) (15). We evaluated LGEs as parameters of fibrosis, calculated on the workstation as areas with the above-threshold signal intensity compared to the remote reference myocardium in the ROI (LGEcore: >5 SD;
LGEgray: 2 SD- 5 SD; LGEcore+gray: LGEcore plus LGEgray) (Figure 2) (16, 17).
INTRAOPERATIVE BIOPSY. Intraoperative myocardial biopsy specimens were taken from 13 of the 29 patients. Myocardial specimens roughly 8 mm3 in volume were harvested from the ventricular septum following aortic valve resection. All specimens were preserved in 20% formalin, embedded in paraffin, cut into 5-µm-thick sections, and stained with
Elastica-Masson stain. The myocardial muscle and fibrous tissue was observed at a
magnification of 100x (18). The fibrosis index (FI) was defined as the ratio (in percentage) of fibrosis tissue to the total myocardial field using Image J (19). For each patient, FI was quantified in five different fields representative of all myocardial samples (Figure 3).
RELATIONSHIPS AMONG ECHOCARDIOGRAPHY, MRI, AND MYOCARDIAL SPECIMENS AT BASELINE AND FOLLOW-UP. We evaluated relationships among preoperative GLS by echocardiography, LGEcore, LGEgray, and LGEcore+gray by MRI, and FI derived from myocardial specimens.
10
Patients underwent echocardiography one year after AVR and were divided into the following two groups according to GLS improvement: the improvement group (postoperative GLS greater than or equal to median) and the non-improvement group (post-operative GLS less than median).
Pre- and postoperative echocardiographic parameters and LGEs were compared between the improvement group and the non-improvement group in order to assess whether it is possible to predict improvement in GLS after AVR. Moreover, multivariate analysis was performed to determine which parameters are independent predictors of GLS improvement.
STATISTICAL ANALYSIS. The planned sample size for this study was based on the ability to detect a 3% decreasing of GLS after AVR compared with the preoperative GLS. To
account for the possibility of patients loss of follow-up and to ensure a real clinical difference, the planned sample size was 30 patients. Statistical analyses were performed using SPSSTM software version 23 (IBM, Armonk, New York). Categorical variables were expressed as percentages. All continuous variables were expressed as a median (interquartile range: IQR).
Comparisons between the two groups were assessed by the Mann-Whitney U test for non-normally distributed variables and the chi-square test for categorical variables. Log transformation was used to normalize the distribution of preoperative GLS, LGEcore, and LGEcore+gray. Multiple linear regression was used to predict postoperative improvement in GLS based on preoperative GLS, LGEcore, and LGEcore+gray. For each parameter,
log-converted values were used for multivariate analysis (i.e., x: [log x]/ [SD of log x]).
RESULTS
BASELINE CHARACTERISTICS. Table 1 summarized preoperative baseline
characteristics of the 29 patients (age, 73 [IQR: 66 – 78] years; 52% male) included in this study. Nine patients presented with symptoms of heart failure (New York Heart Association functional class II in 8 patients and III in 1 patient), and 16 patients presented with symptoms of AS (dyspnea: 9, chest pain: 4, syncope: 3). In this cohort, patients had several
11
atherosclerotic risk factors (hypertension, diabetes mellitus, hyperlipidemia, and/or current smoking). Brain natriuretic peptide was 85.0 pg/ml (IQR: 39.1-183.0).
PREOPERATIVE ECHOCARDIOGRAPHIC AND MRI FINDINGS. Table 2 shows echocardiographic parameters at baseline. All patients had high-gradient severe AS, with a peak velocity of 4.72 m/s (IQR: 4.30 – 5.25), mean pressure gradient of 51.0 mmHg (41.4 – 68.1), aortic valve area of 0.67 cm2 (0.57 – 0.79), and Zva of 5.40 mmHg/ml/m2 (4.53 – 6.5).
LVEF was well-preserved at 65.7% (61.9 – 68.5), while GLS was reduced at -16.5% (-18.2 – -14.2). LV hypertrophy was observed (LVMI: 123.2 g/m2), but no severe diastolic
dysfunction with increased LA pressure was noted (E/A: 0.63 and E/e’: 12.4).
The parameters of myocardial fibrosis by MRI were as follows: LGEcore 3.0 (IQR:
1.2 – 6.7) g, LGEgray 10.8 (7.3 – 17.8) g, and LGEcore+gray 15.0 (9.5 – 22.7) g, and these showed no severe myocardial fibrosis. As shown in Figure 4, significant correlations were observed between GLS and LGEcore (r = 0.38, p < 0.05), LGEgray (r = 0.57, p < 0.01) and LGEcore+gray (r = 0.60, p < 0.01).
RELATIONSHIPS BETWEEN MYOCARDIAL FIBROSIS AND IMAGING PARAMETERS. The FI obtained from myocardial biopsy specimens of 13 patients was 5.3% (IQR: 2.8 – 16.0). FI correlated with LGEcore (r = 0.62, p < 0.05) and LGEcore+gray (r
= 0.61, p < 0.05), but not LGEgray (Figure 5). FI strongly correlated with GLS (r = 0.68, p <
0.05) (Figure 6).
FOLLOW-UP ECHOCARDIOGRAPHY AFTER AVR. There was no all-cause death or hospitalization due to heart failure at one year after AVR. We examined echocardiography in 26 patients; reasons for not performing follow-up echocardiography included patient refusal, cost of echocardiography, and other socioeconomical reasons. The results of comparisons of echocardiographic parameters before and after AVR are summarized in Table 3. After AVR, aortic valve function was significantly improved in terms of peak velocity (4.73 to 2.55 m/s),
12
mean pressure gradient (50.5 to 14.1 mmHg), aortic valve area (0.65 to 1.47 cm2), and Zva (5.46 to 4.48 mmHg/ml/m2). Regression of LV hypertrophy was observed [interventricular septum thickness, 13.1 to 10.8 mm (p < 0.001); posterior wall thickness, 13.0 to 10.1 mm (p <
0.001); LVMI, 123.2 to 92.9 g/m2 (p < 0.001)], with improved diastolic function [E/A, 0.62 to 0.91 (p < 0.05); e’, 5.2 to 7.5 cm/sec (p = 0.001)]. A significant improvement in GLS was also observed after AVR (-16.9% to -19.9%).
PREDICTION OF GLS IMPROVEMENT AFTER AVR. We divided the 26 patients who underwent follow-up echocardiography according to median postoperative GLS: the
improvement group (≥ -19.9%; n = 14) and the non-improvement group (< -19.9%; n = 12).
The comparisons of patient characteristics, echocardiographic parameters, and MRI parameters between the two groups are shown in Table 4.
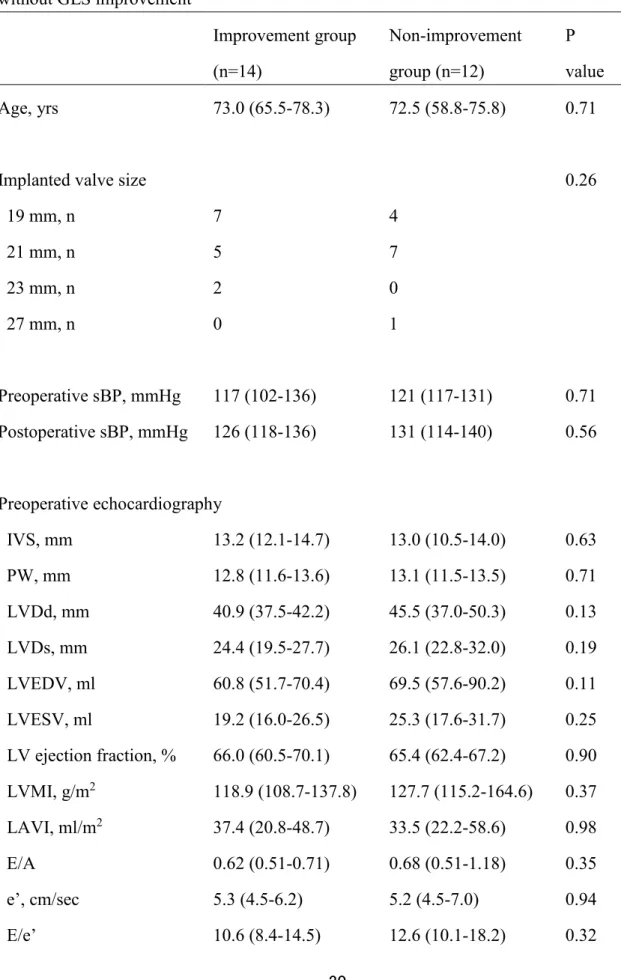
No significant differences were observed in age, implanted valve size, and blood pressure between the improvement and non-improvement groups. Preoperative
echocardiographic parameters did not differ between the two groups. Postoperatively,
however, significant improvements were observed in LV hypertrophy (IVS and PW) and LV diastolic function (LVMI and e´) in the improvement group compared to the
non-improvement group.
LGEcore and LGEcore+gray were lower in the improvement group compared to the non-improvement group. LGEgray did not differ between the two groups.
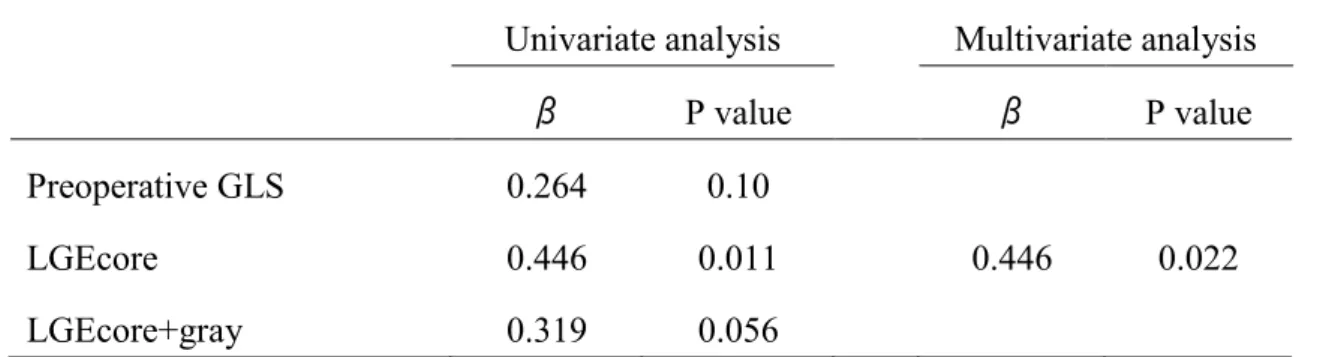
In the univariate analysis, LGEcore and LGEcore+gray were significant predictors of GLS improvement after AVR (LGEcore: β = 0.446, p = 0.011; LGEcore+gray: β = 0.319, p = 0.056) (Table 5). On the other hand, no preoperative echocardiographic parameters including GLS predicted improvement in GLS. In the multivariate analysis, LGEcore was found to be an independent predictor of postoperative improvement in GLS (β = 0.446, p = 0.022) (Table 5).
13
In the ROC analysis, the area under the curve was 0.81 for predicting postoperative GLS improvement (≥ -19.9%) by LGEcore, with a cut-off value of 2.86 g (sensitivity, 78.6%;
specificity, 83.3%) (Figure 7A).
Figure 7B shows changes in GLS before and after AVR for each patient. Patients with low LGEcore (< 2.86 g) showed improved GLS after AVR compared to those with high LGEcore (≥ 2.86 g).
DISCUSSION
In this study, we investigated whether preoperative LGEs could predict improvement in GLS after AVR in patients with preserved LVEF and reduced GLS. The major findings are as follows: 1) Preoperative examinations revealed significant correlations among GLS, LGEs, and FI; 2) One year after AVR, GLS was improved in a manner
dependent on preoperative LGEcore; and 3) LGEcore can predict postoperative improvement in GLS with a cut-off value of 2.86 g. These findings suggest that myocardial fibrosis as detected by LGE predicts improvement in GLS after AVR, and that LGE can help determine the optimal timing for AVR in patients with severe AS.
Microscopic changes in LV are characterized by cardiomyocyte hypertrophy and extracellular matrix expansion in patients with AS. These conditions are caused by either focal replacement fibrosis (scar) or reactive and interstitial diffuse fibrosis (2, 3, 20-24). A recent prospective observational cohort study reported that focal fibrosis (scars) as detected by LGE does not resolve, while diffuse fibrosis and myocardial hypertrophy as assessed by extracellular volume (ECV) show significant regression after AVR in patients with
symptomatic severe AS (20). It remains unclear as to which type of LV myocardial fibrosis (i.e., focal or diffuse) plays an important role in persistent systolic dysfunction after AVR.
Several recent studies used LGE cardiac MRI for quantification of LV myocardial fibrosis with signal thresholding techniques (25). While the 2 SD threshold method is often used to detect myocardial fibrosis, different thresholds (3 SD, 5 SD, and 7 SD) have been proposed for detecting hypertrophic cardiomyopathy and acute/chronic myocardial infarction,
14
with different mean LGE volumes (26). The thresholds of 3 SD and 2-3 SD are used for the core infarct zone and the gray infarct zone, respectively, to assess myocardial fibrosis in patients with ischemic heart disease (27). The gray infarct zone has been reported to be a predictor of mortality (27) in post-myocardial infarction and ventricular arrhythmia (16, 17).
Azevedo et al. reported that LGE (> 2 SD) could predict all-cause mortality in patients with severe AS (2), and Lee et al. reported that LGE (> 5 SD) was a predictor of poor prognosis in patients with AS (1). Yet, no study has examined which threshold (i.e., 2 SD or 5 SD) better predicts improvement in contractile function after AVR. Therefore, different optimal
thresholds are used to predict specific heart disease outcomes. In the present study, we used a threshold of 2- 5 SD for LGEgray and >5 SD for LGEcore in order to predict both GLS reduction before AVR and GLS improvement after AVR.
According to previous studies, LGEcore and LGEgray reflect focal fibrosis and diffuse mild interstitial fibrosis, respectively (16). Reverse remodeling after AVR has been shown to be primarily due to regression of diffuse fibrosis accompanied by myocardial cell hypertrophy (20). In the present study, LGEcore, but not LGEgray or LGEcore+gray, was found to be a predictor of GLS improvement after AVR. While LGEgray (i.e., mild interstitial fibrosis) can be reversible, LGEcore (i.e., focal fibrosis) is unlikely to improve after AVR.
Thus, our findings suggest that the degree of focal fibrosis before AVR is a determining factor for GLS improvement after AVR in patients with severe AS.
In addition, there was no significant difference in LGEgray between the group of improved GLS and the group of no improved GLS. In this study, FI was determined by pathological analysis using Elastica-Masson staining, and therefore, indicated fibrosis and fibrillary collagen but not interstitial fluid. In contrast, LGEgray reflects interstitial fluid as well as extracellular matrix. This difference may explain why LGEgray was not correlated with FI. LGEgray could not predict improvement of LV systolic function possibly because it reflects reversible components after AVR.
GLS is reduced in symptomatic patients with severe AS, and a decrease in GLS is a predictor of all-cause mortality (6). GLS is also a predictor of future major adverse cardiac
15
events in asymptomatic patients with severe AS and preserved LVEF (28). Thus, assessing GLS is clinically important in patients with potential systolic dysfunction and preserved LVEF.
Lee et al. reported that native T1 values by cardiac MRI as an index of diffuse interstitial fibrosis correlated with GLS (29). In a previous study, histological findings suggested
improved GLS in patients with mild fibrosis, but not in those with moderate or severe fibrosis, nine months after AVR (22). It remains unclear as to whether a decrease in GLS correlates with values of focal fibrosis and/or diffuse mild fibrosis, and whether LGEcore (i.e., focal fibrosis) and LGEgray (i.e., diffuse mild fibrosis) are predictors of GLS improvement after AVR.
GLS reduction also correlates with several factors such as myocardial fibrosis (30), pressure overload, and obesity (31). Dihn et al. reported that enlarged LVMI is reflected in abnormalities of GLS in patients with AS (5). The main cause of GLS impairment is still unknown, as well as the prospect for GLS improvement after AVR. In the present cohort study, patients had preserved LVEF with a slight decrease in GLS, and myocardial specimens
showed mild fibrosis compared to severity of fibrosis in the previous reports (1, 29). However, given that not all patients showed improved GLS after AVR, predictors of GLS improvement after AVR need to be investigated further.
To the best of our knowledge, this is the first study to evaluate whether LGE as an index of focal fibrosis and/or diffuse fibrosis could predict improvement in GLS one year after AVR. Preoperative GLS strongly correlated with LGEgray, but weakly correlated with LGEcore. On the other hand, LGEcore was found to be a predictor of GLS improvement after AVR. The use of different thresholds, i.e., >5SD for LGEcore and 2-5SD for LGEgray,
allowed us to detect potential systolic dysfunction with preserved LVEF (LGEgray), and to predict improvement in GLS (LGEcore) after AVR.
Recent therapeutic strategies for asymptomatic severe AS include AVR, which is recommended only when LVEF is less than 50% (7). However, severe AS patients with preserved LVEF already has LV myocardial fibrosis (32). In patients with extensive focal fibrosis, myocardial damage persists even if LV afterload is decreased by AVR. Thus,
16
myocardial fibrosis needs to be evaluated noninvasively in order to predict prognosis after AVR in a clinical setting. Since focal fibrosis as detected by LGEcore (<2.86 g) is an
independent predictor of GLS improvement after AVR, surgical therapy should be considered before patients develop irreversible LV dysfunction.
STUDY LIMITATIONS. This study has several limitations. First, this study was conducted at a single center with a small number of participants. Therefore, our findings need to be confirmed in a larger cohort. Second, we excluded patients with CKD because of a contraindication to contrast-enhanced MRI. Thus, the results of the present study may not apply to patients with CKD, which is a common disorder in elderly patients. Other methods to assess LV myocardial fibrosis, e.g., ECV by MRI (33, 34), should be considered. Third, we assessed GLS by 2D echocardiography, not 3D echocardiography. A significant correlation has been reported between 2D GLS and 3D GLS in patients with AS, and 3D GLS as well as 2D GLS are reportedly predictors of major adverse cardiac events (28).
CONCLUSIONS
This prospective observational study demonstrated that improvement in systolic function after AVR can be predicted in patients with severe AS. Preoperative LGEcore is the most effective predictor of contractility improvement after AVR in patients with severe AS and preserved LVEF, and could help determine the timing of AVR.
ACKNOWLEDGEMENTS
We thank Dr. Tetsuya Ohira, Professor of Department of Epidemiology, Fukushima Medical University, for his advice on statistical analysis.
17 REFERENCES
1. Lee H, Park JB, Yoon YE, et al. Noncontrast Myocardial T1 Mapping by Cardiac Magnetic Resonance Predicts Outcome in Patients With Aortic Stenosis. J Am Coll Cardiol Img 2018; 11:974-83.
2. Azevedo CF, Nigri M, Higuchi ML, et al. Prognostic significance of myocardial fibrosis quantification by histopathology and magnetic resonance imaging in patients with severe aortic valve disease. J Am Coll Cardiol 2010; 56:278-87.
3. Barone-Rochette G, Piérard S, De Meester de Ravenstein C, et al. Prognostic significance of LGE by CMR in aortic stenosis patients undergoing valve replacement. J Am Coll Cardiol 2014; 64:144-54.
4. Kusunose K, Goodman A, Parikh R, et al. Incremental prognostic value of left ventricular global longitudinal strain in patients with aortic stenosis and preserved ejection fraction.
Circ Cardiovasc Imaging 2014; 7:938-45.
5. Dinh W, Nickl W, Smettan J, et al. Reduced global longitudinal strain in association to increased left ventricular mass in patients with aortic valve stenosis and normal ejection fraction: a hybrid study combining echocardiography and magnetic resonance imaging.
Cardiovasc Ultrasound 2010; 8:29.
18
6. Ng ACT, Prihadi EA, Antoni ML, et al. Left ventricular global longitudinal strain is predictive of all-cause mortality independent of aortic stenosis severity and ejection fraction. Eur Heart J Cardiovasc Imaging 2018; 19:859-67.
7. Nishimura RA, Otto CM, Bonow RO, Carabello BA, Erwin JP 3rd, Guyton RA et al.
2014 AHA/ACC Guideline for the Management of Patients With Valvular Heart Disease:
executive summary: a report of the American College of Cardiology/American Heart Association Task Force on Practice Guidelines. J Am Coll Cardiol 2014; 63:2438-88.
8. Baumgartner H, Hung J, Bermejo J, et al. Recommendations on the echocardiographic assessment of aortic valve stenosis: A focused update from the European Association of Cardiovascular Imaging and the American Society of Echocardiography. J Am Soc Echocardiogr 2017; 30:372-92.
9. Kribben A, Witzke O, Hillen U, et al. Nephrogenic systemic fibrosis pathogenesis, diagnosis, and Therapy. J Am Coll Cardiol 2009; 53:1621-8.
10. Lang RM, Badano LP, Mori-Avi V, et al. Recommendations for cardiac chamber quantification by echocardiography in adults: An update from the American Society of Echocardiography and the European Association of Cardiovascular Imaging. J Am Soc Echocardiogr 2015; 28:1-39.
11. Nagueh SF, Smiseth OA, Appleton CP, et al. Recommendations for the evaluation of left ventricular diastolic function by echocardiography: An update from the American Society
19
of Echocardiography and the European Association of Cardiovascular Imaging. J Am Soc Echocardiogr 2016; 29:277-314.
12. Hachicha Z, Dumesnil JG, Pibarot P. Usefulness of the valvuloarterial impedance to predict adverse outcome in asymptomatic aortic stenosis. J Am Coll Cardiol 2009;
54:1003–11.
13. Kansal MM, Panse PM, Abe H, et al. Relationship of contrast-enhanced magnetic resonance imaging-derived intramural scar distribution and speckle tracking echocardiography-derived left ventricular two-dimensional strains. Eur Heart J Cardiovasc Imaging. 2012; 13: 152-58.
14. Crouch G, Bennetts J, Sinhal A, et al. Early effects of transcatheter aortic valve implantation and aortic valve replacement on myocardial function and aortic valve hemodynamics: Insights from cardiovascular magnetic resonance imaging. J Thorac Cardiovasc Surg 2015; 149:462-70.
15. Spartera M, Damascelli A, Mozes F, De Cobelli F, La Canna G. Three-dimensional speckle tracking longitudinal strain is related to myocardial fibrosis determined by late-gadolinium enhancement. Int J Cardiovasc Imaging 2017; 33:1351-60.
16. Roes SD, Borleffs CJ, van der Geest RJ, et al. Infarct tissue heterogeneity assessed with contrast-enhanced MRI predicts spontaneous ventricular arrhythmia in patients with
20
ischemic cardiomyopathy and implantable cardioverter-defibrillator. Circ Cardiovasc Imaging 2009; 2:183-90.
17. Gao P, Yee R, Gula L, et al. Prediction of arrhythmic events in ischemic and dilated cardiomyopathy patients referred for implantable cardiac defibrillator: evaluation of multiple scar quantification measures for late gadolinium enhancement magnetic resonance imaging. Circ Cardiovasc Imaging 2012; 5:448-56.
18. Milano AD, Faggian G, Dodonov M, et al. Prognostic value of myocardial fibrosis in patients with severe aortic valve stenosis. J Thorac Cardiovasc Surg 2012; 144:830-7.
19. Schneider CA, Rasband WS, Eliceiri KW. NIH Image to ImageJ: 25 years of image analysis. Nat Methods 2012; 9:671-5.
20. Treibel TA, Kozor R, Schofield R, et al. Reverse Myocardial Remodeling Following Valve Replacement in Patients With Aortic Stenosis. J Am Coll Cardiol 2018; 71:860-71.
21. Dweck MR, Joshi S, Murigu T, et al. Midwall fibrosis is an independent predictor of mortality in patients with aortic stenosis. J Am Coll Cardiol 2011; 58:1271-9.
22. Weidemann F, Herrmann S, Störk S, et al. Impact of myocardial fibrosis in patients with symptomatic severe aortic stenosis. Circulation 2009; 120:577-84.
23. Herrmann S, Störk S, Niemann M, et al. Low-gradient aortic valve stenosis myocardial fibrosis and its influence on function and outcome. J Am Coll Cardiol 2011; 58:402-12.
21
24. Yarbrough WM, Mukherjee R, Ikonomidis JS, Zile MR, Spinale FG. Myocardial remodeling with aortic stenosis and after aortic valve replacement: mechanisms and future prognostic implications. J Tjorac Cardiovasc Surg 2012; 143:656-64.
25. Kim EK, Chattranukulchai P, Klem I. Cardiac Magnetic Resonance Scar Imaging for Sudden Cardiac Death Risk Stratification in Patients with Non-Ischemic Cardiomyopathy.
Korean J Radiol 2015; 16:683-95.
26. Yan AT, Shayne AJ, Brown KA, et al. Characterization of the peri-infarct zone by contrast-enhanced cardiac magnetic resonance imaging is a powerful predictor of post-myocardial infarction mortality. Circulation 2006; 114:32-9.
27. Flett AS, Hasleton J, Cook C, et al. Evaluation of techniques for the quantification of myocardial scar of differing etiology using cardiac magnetic resonance. J Am Coll Cardiol Img 2011; 4:150-6.
28. Nagata Y, Takeuchi M, Wu VC, et al. Prognostic value of LV deformation parameters using 2D and 3D speckle-tracking echocardiography in asymptomatic patients with severe aortic stenosis and preserved LV ejection fraction. J Am Coll Cardiol Img 2015;
8:235-45.
29. Lee SP, Lee W, Lee JM, et al. Assessment of diffuse myocardial fibrosis by using MR imaging in asymptomatic patients with aortic stenosis. Radiology 2015; 274:359-69.
30. Hoffmann R, Altiok E, Friedman Z, Becker M, Frick M. Myocardial deformation imaging by two-dimensional speckle-tracking echocardiography in comparison to late
22
gadolinium enhancement cardiac magnetic resonance for analysis of myocardial fibrosis in severe aortic stenosis. Am J Cardiol 2014; 114:1083-8.
31. Ávila-Vanzzini N, Fritche-Salazar JF, Vázquez-Castro NM, et al. Echocardiographic and Histologic Correlations in Patients with Severe Aortic Stenosis: Influence of Overweight and Obesity. J Cardiovasc Ultrasound 2016; 24:303-11.
32. Hein S, Arnon E, Kostin S, et al. Progression from compensated hypertrophy to failure in the pressure-overloaded human heart: structural deterioration and compensatory
mechanisms. Circulation 2003; 107:984-91.
33. Chin CWL, Everett RJ, Kwiecinski J, et al. Myocardial Fibrosis and Cardiac Decompensation in Aortic Stenosis. J Am Coll Cardiol Img 2017; 10:1320-33.
34. Moon JC, Messroghli DR, Kellman P, et al. Myocardial T1 mapping and extracellular volume quantification: a Society for Cardiovascular Magnetic Resonance (SCMR) and CMR Working Group of the European Society of Cardiology consensus statement. J Cardiovasc Magn Reson 2013; 15:92.
23 FIGURE LEGENDS
Figure 1. Measurement of GLS by 2D Echocardiography
Endocardial GLS was examined by 2D speckle tracking echocardiography using the SC2000 workplace system VVITM. GLS as the average of GLSs in apical 2-, 3-, and 4-chamber views was assessed using the same procedure.
GLS: global longitudinal strain
Figure 2. Measurement of LGE by MRI
LGEcore, LGEgray, and LGEcore+gray were calculated as areas with the above-threshold signal intensity in the ROI (≥5SD for LGEcore and 2-5SD for LGEgray compared to the normal area).
ROI: Region of interest
LGE: late gadolinium enhancement
Figure 3. Histopathological Image of the Fibrosis
LV myocardial specimens were stained with Elastica-Masson stain. The relative volume of myocardial muscle and fibrous tissue (arrow) was determined at a magnification of 100×. The fibrosis index was defined as the ratio of fibrosis tissue to the total myocardial field.
24 Figure 4. GLS and LGE before AVR
GLS was significantly correlated with LGEcore (r=0.38, p<0.05), LGEgray (r=0.57, p<0.01) and LGEcore+gray (r=0.60, p<0.01).
Figure 5. LGE and the Fibrosis Index before AVR
LGEcore (r=0.62, p<0.05) and LGEcore+gray (r=0.61, p<0.05), but not LGEgray, was significantly correlated with the fibrosis index.
Figure 6. GLS and the Fibrosis Index before AVR
GLS was significantly correlated with the fibrosis index (r=0.68, p<0.05).
Figure 7. Receiver-Operating Characteristics (ROC) Curve Analysis for Prediction of GLS Improvement after AVR
A) In the ROC analysis, the area under the curve was 0.81 for predicting postoperative GLS improvement (≥-19.9%) by LGEcore, with a cut-off value of 2.86g (sensitivity, 78.6%;
specificity, 83.3%).
B) Patients with low LGEcore (<2.86 g) showed improvement in GLS after AVR compared to those with high LGEcore (≥2.86g).
Black circle: LGEcore <2.86g, white circle: LGEcore ≥2.86 g.
25 Table 1 Patient baseline characteristics (n=29)
Age, yrs 73 (66-78)
Men, n (%) 15 (52)
Height, cm 155.4 (148.2-161.7)
Body weight, kg 55.2 (51.8-60.5)
Body surface area, m2 1.50 (1.41-1.60) Body mass index, kg/m2 22.8 (19.8-25.0) NYHA functional class, n (%)
I 20 (69)
II 8 (28)
III 1 (3)
IV 0
Symptoms, n (%)
Dyspnea 9 (31)
Chest pain 4 (14)
Syncope 3 (10)
Risk factors, n (%)
Hypertension 19 (66)
Diabetes mellitus 4 (14)
Hyperlipidemia 16 (55)
Current smoker 5 (17)
History/comorbidity, n (%)
Chronic kidney disease 7 (24)
Cerebral vascular disease 3 (10) Chronic obstructive pulmonary disease 3 (10)
Brain natriuretic peptide, pg/ml 85.0 (39.1-183.0) eGFR, ml/min/1.73 m2 68.0 (59.0-74.0)
Continuous variables are expressed as median (interquartile range).
26
NYHA: New York Heart Association, eGFR: estimated glomerular filtration rate.
27
Table 2 Preoperative echocardiographic and MRI parameters (n=29) Echocardiography
IVS, mm 13.1 (11.1-14.3)
PW, mm 12.9 (11.4-13.5)
LVDd, mm 41.7 (37.4-45.5)
LVDs, mm 25.4 (21.9-28.7)
LVEDV, ml 62.8 (54.1-77.1)
LVESV, ml 21.5 (17.2-28.7)
LV ejection fraction, % 65.7 (61.9-68.5)
LVMI, g/m2 123.2 (113.0-148.6)
LAVI, ml/m2 37.4 (25.7-48.8)
E/A 0.63 (0.51-0.82)
e’, cm/sec 4.9 (4.4-6.2)
E/e’ 12.4 (9.4-19.5)
Aortic valve
Peak velocity, m/s 4.72 (4.30-5.25)
Mean PG, mmHg 51.0 (41.4-68.1)
Aortic valve area, cm2 0.67 (0.57-0.79)
Zva, mmHg/ml/m2 5.40 (4.53-6.50)
2D-GLS, % -16.5 (-18.2- -14.2)
MRI
LGEcore, g 3.0 (1.2- 6.7)
LGEgray, g 10.8 (7.3- 17.8)
LGEcore+gray, g 15.0 (9.5- 22.7)
Continuous variables are expressed as median (interquartile range).
28
IVS: interventricular septal thickness, PW: posterior wall thickness, LVDd: left ventricular end-diastolic diameter, LVDs: left ventricular end-systolic diameter, LVEDV: left ventricular end-diastolic volume, LVESV: left ventricular end-systolic volume, LVMI: left ventricular mass index, LAVI: left atrium volume index, PG: pressure gradient, GLS: global longitudinal strain, LGE: late gadolinium enhancement.
29
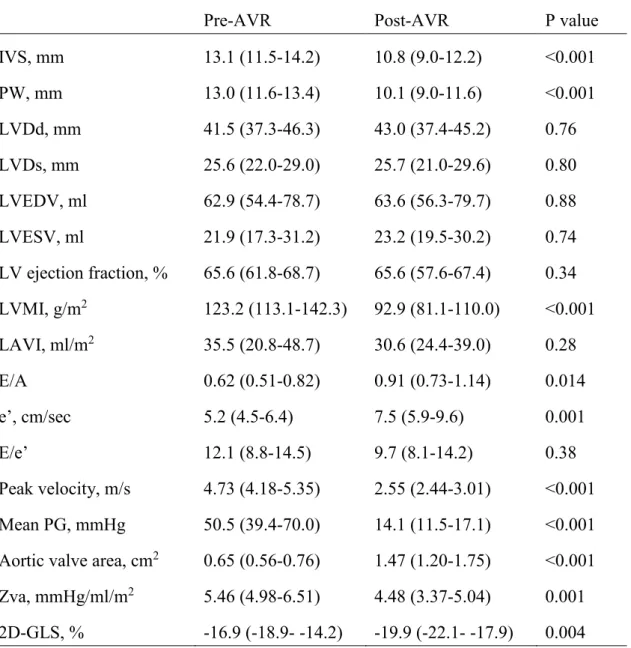
Table 3 Comparison of pre- and postoperative echocardiographic parameters (n=26).
Pre-AVR Post-AVR P value
IVS, mm 13.1 (11.5-14.2) 10.8 (9.0-12.2) <0.001
PW, mm 13.0 (11.6-13.4) 10.1 (9.0-11.6) <0.001
LVDd, mm 41.5 (37.3-46.3) 43.0 (37.4-45.2) 0.76
LVDs, mm 25.6 (22.0-29.0) 25.7 (21.0-29.6) 0.80
LVEDV, ml 62.9 (54.4-78.7) 63.6 (56.3-79.7) 0.88 LVESV, ml 21.9 (17.3-31.2) 23.2 (19.5-30.2) 0.74 LV ejection fraction, % 65.6 (61.8-68.7) 65.6 (57.6-67.4) 0.34 LVMI, g/m2 123.2 (113.1-142.3) 92.9 (81.1-110.0) <0.001 LAVI, ml/m2 35.5 (20.8-48.7) 30.6 (24.4-39.0) 0.28
E/A 0.62 (0.51-0.82) 0.91 (0.73-1.14) 0.014
e’, cm/sec 5.2 (4.5-6.4) 7.5 (5.9-9.6) 0.001
E/e’ 12.1 (8.8-14.5) 9.7 (8.1-14.2) 0.38
Peak velocity, m/s 4.73 (4.18-5.35) 2.55 (2.44-3.01) <0.001 Mean PG, mmHg 50.5 (39.4-70.0) 14.1 (11.5-17.1) <0.001 Aortic valve area, cm2 0.65 (0.56-0.76) 1.47 (1.20-1.75) <0.001 Zva, mmHg/ml/m2 5.46 (4.98-6.51) 4.48 (3.37-5.04) 0.001 2D-GLS, % -16.9 (-18.9- -14.2) -19.9 (-22.1- -17.9) 0.004 Continuous variables are expressed as median (interquartile range).
AVR: aortic valve replacement, IVS: interventricular septal thickness, PW: posterior wall thickness, LVDd: left ventricular end-diastolic diameter, LVDs: left ventricular end-systolic diameter, LVEDV: left ventricular end-diastolic volume, LVESV: left ventricular end-systolic volume, LVMI: left ventricular mass index, LAVI: left atrium volume index, PG: pressure gradient, GLS: global longitudinal strain.
30
Table 4 Comparison of echocardiographic and MRI parameters between groups with or without GLS improvement
Improvement group (n=14)
Non-improvement group (n=12)
P value
Age, yrs 73.0 (65.5-78.3) 72.5 (58.8-75.8) 0.71
Implanted valve size 0.26
19 mm, n 7 4
21 mm, n 5 7
23 mm, n 2 0
27 mm, n 0 1
Preoperative sBP, mmHg 117 (102-136) 121 (117-131) 0.71 Postoperative sBP, mmHg 126 (118-136) 131 (114-140) 0.56
Preoperative echocardiography
IVS, mm 13.2 (12.1-14.7) 13.0 (10.5-14.0) 0.63
PW, mm 12.8 (11.6-13.6) 13.1 (11.5-13.5) 0.71
LVDd, mm 40.9 (37.5-42.2) 45.5 (37.0-50.3) 0.13
LVDs, mm 24.4 (19.5-27.7) 26.1 (22.8-32.0) 0.19
LVEDV, ml 60.8 (51.7-70.4) 69.5 (57.6-90.2) 0.11 LVESV, ml 19.2 (16.0-26.5) 25.3 (17.6-31.7) 0.25 LV ejection fraction, % 66.0 (60.5-70.1) 65.4 (62.4-67.2) 0.90 LVMI, g/m2 118.9 (108.7-137.8) 127.7 (115.2-164.6) 0.37 LAVI, ml/m2 37.4 (20.8-48.7) 33.5 (22.2-58.6) 0.98
E/A 0.62 (0.51-0.71) 0.68 (0.51-1.18) 0.35
e’, cm/sec 5.3 (4.5-6.2) 5.2 (4.5-7.0) 0.94
E/e’ 10.6 (8.4-14.5) 12.6 (10.1-18.2) 0.32
31
Peak velocity, m/s 4.73 (4.18-5.38) 4.75 (4.07-5.43) 0.98 Mean PG, mmHg 52.0 (40.8-76.8) 50.5 (38.1-68.6) 0.78 Aortic valve area, cm2 0.64 (0.54-0.77) 0.66 (0.56-0.81) 0.67 SVi, ml/m2 34.5 (25.6-35.6) 31.4 (24.6-36.0) 0.61 Zva, mmHg/ml/m2 5.81 (4.10-7.07) 5.41 (4.99-6.27) 0.76 2D-GLS, % -17.7 (-20.5- -14.9) -15.2 (-18.1 - -12.7) 0.18
Postoperative echocardiography
IVS, mm 9.7 (8.7-11.8) # 11.5 (9.9-13.4) 0.041
PW, mm 9.5 (8.6-10.6) # 11.1 (9.9-13.0) 0.036
LVDd, mm 43.0 (38.0-44.4) 41.8 (37.4-45.4) 0.86
LVDs, mm 24.9 (21.4-29.6) 25.7 (20.1-29.7) 0.82
LVEDV, ml 62.9 (55.1-79.7) 65.3 (55.9-81.9) 0.63 LVESV, ml 24.8 (17.6-30.6) 22.1 (20.4-29.2) 0.94 LV ejection fraction, % 65.2 (57.5-67.4) 65.5 (61.4-68.4) 0.82 LVMI, g/m2 82.2 (74.5-101.2) # 102.7 (92.4-127.6) # 0.036 LAVI, ml/m2 29.8 (22.9-34.1) 37.2 (24.1-52.2) 0.30
E/A 0.97 (0.79-1.25) # 0.9 (0.6-1.1) 0.32
e’, cm/sec 8.5 (6.9-10.6) # 6.0 (5.1-8.0) 0.011
E/e’ 9.2 (7.1-11.9) 11.6 (9.3-15.8) 0.044
Peak velocity, m/s 2.6 (2.5-3.1) # 2.5 (2.3-3.0) # 0.53 Mean PG, mmHg 15.7 (12.1-17.1) # 13.0 (11.2-17.7) # 0.49 Aortic valve area, cm2 1.26 (1.12-1.61) # 1.60 (1.32-1.79) # 0.28 SVi, ml/m2 35.1 (32.7-40.3) * 33.3 (24.7-40.1) 0.33 Zva, mmHg/ml/m2 4.11 (3.39-4.78) # 4.42 (3.15-5.58) 0.33 2D-GLS, % -22.1 (-22.4- -20.3) # -17.6 (-18.7- -13.4) <0.001
Preoperative MRI
32
LGEcore, g 1.34 (0.81-2.98) 4.70 (2.99-9.00) 0.005 LGEgray, g 8.72 (4.40-13.48) 10.8 (10.1-18.8) 0.12 LGEcore+gray, g 9.62 (6.84-15.24) 18.8 (13.4-26.2) 0.013
sBP: systolic blood pressure, IVS: interventricular septal thickness, PW: posterior wall thickness, LVDd: left ventricular end-diastolic diameter, LVDs: left ventricular end-systolic diameter, LVEDV: left ventricular end-diastolic volume, LVESV: left ventricular end-systolic volume, LVMI: left ventricular mass index, LAVI: left atrium volume index, PG: pressure gradient, SVi: stroke volume index, GLS: global longitudinal strain, LGE: late gadolinium enhancement
*: p<0.05 vs. preoperative echocardiography
#: p<0.01 vs. preoperative echocardiography
33
Table 5 Multivariate analysis to predict postoperative improvement in GLS
Univariate analysis Multivariate analysis
β P value β P value
Preoperative GLS 0.264 0.10
LGEcore 0.446 0.011 0.446 0.022
LGEcore+gray 0.319 0.056
GLS: global longitudinal strain, LGE: late gadolinium enhancement