Industrial Progress of Pelagic Fisheries in
the South Pacific : A Case Study of Fiji
著者
IWAKIRI Shigero, Vina RAM
journal or
publication title
鹿児島大学水産学部紀要=Memoirs of Faculty of
Fisheries Kagoshima University
volume
36
number
1
page range
97-135
別言語のタイトル
南太平洋海洋漁業の産業的展開 : フィジーの事例
研究
URL
http://hdl.handle.net/10232/13355
Mem. Fac. Fish., Kagoshima Univ. Vol. 36, No. 1, pp. 97-135 (1987)
Industrial Progress of Pelagic Fisheries in the South Pacific
A Case Study of Fiji
Shigero Iwakiri* and Vina Ram
Abstract
According to the ancient history of the Polynesians, Melanesians and Micronesians, the
islanders were referred to as "ocean farers" who possed good navigational and fishing skills.
However, thecolonial powers were not interested in exploitation ofocean resources because of
the lack of market then for fisheries products. Much of the interest lied in agricultural
plantation development to provide raw materials for the metropolitan markets. As a consequence, within the primary industries of the islands it is seen that fisheries is still at a
considerable stage of subsistence compared to other agricultural activities. Thus, it is
important that while the traditional structures are still present within these island societies, the
possibilities for reconstructing orreviving the traditional skills ofocean people be considered
towards the coastal and open sea fisheries development.
It is also seen that within the last decade two international political events have further
sought to change the perspects ofthe fishing industry which was initially limited to household
production. Firstly, the political independence has given the islands new incentives and
commitment to develop their own few resources and secondly, the declaration of the 200 mile extended jurisdiction under the International Marine Policy has initiated the islands of thepossibilities of exploiting and managing the highly migratory tuna resources which form the
main stockof the deep ocean within these island countries jurisdiction. The effects of these are
already evidenced by the development of the industrial pelagic fisheries under the strong
national and regional support.
Presently each ofthe Pacific Islands have National Fisheries Development Plans, where the main objectives relate to increase foreign exchange, creating employment and providing
protein food.
In the case of Fiji, the export-orientated industrial pelagic fisheries has been developed
independently under national capital for production, and foreign joint-venture for processing and marketing. This development shows a modernised course of industrial progress and mode
of accumulation in contrast with the theoratical process. Furthermore, this development
perspect has been a result and under the guidance oftheemerging regional marine and fisheries
policy under the International Law of the Sea regime.
In this study on industrial fisheries, the methodology adopted based on the economic
* i Laboratory of International Marine Policy, Faculty of Fisheries, Kagoshima University, 50-20
Shimoarata 4, Kagoshima, 890 Japan
98 Mem. Fac. Fish., Kagoshima Univ. Vol.36, No. 1 (1987)
analysis of capital accumulation, labour force and composition, national intervention,
international relations and so on.
1) Regional Policies and Target of Pelagic Fisheries
(i) Regional Fisheries Policy
Fishing in the South Pacific has largely been concentrated within the coastal areas, partly because of fishing for small quantities for subsistence, but more importantly because of lack of technology, skills, and appropriate gear to exploit beyond the outer reef areas. Use of traditional technology of the coastal waters or trawling has been restricted because of the difficult physical characteristics of the ocean environment which (KEARNEY ; 1979 : p. 1) describes as •••
"••• Land masses of Tropical Pacific are in general comparatively isolated islands or
archipelagic which are surrounded by clear extremely deep ocean. In most cases the transition in depth from shallow, inshore or lagoon waters is precipitous, dropping to depths which often exceeds 1,000 fathoms in distances from shore of a few miles or even less. Throughout the region there are very few areas of true continental shelf, and in those areas where a shelf does exist it does not generally extend beyond the 12 miles currently accepted
as territorial sea."
As a result of lack of technical capabilities of the islands for access to the deep ocean, much of their ocean or pelagic fisheries which consists of largely highly migratory species has been exploited by foreign fishing fleets, from Japan, Korea, Taiwan and USA while the islands generally received license fees and tax revenue from these fishing fleets.
Japanese longlining fisheries developed in the 1950s which was later joined by Korea in 1958 and Taiwan in the mid 1960s. These foreign vessels operated within the South West Pacific operating through 4 major bases in American Samoa, New Hebrides (Vanuatu), French Polynesia and Fiji.
With political independence and commitment towards self-reliance, the islands sort to develop commercial tuna industry to increase exports by way of getting a greater share of benefits and involvement with the foreign operations.
Also around the same period (1960s-1970s) the tuna prices in American and Japanese
markets increased and indicated a future potential towards industrial fisheries development. This flourishing business of the foreign operations on the other side aroused fear and concern for the island nations that they were not receiving fair benefits by malpractices and that inadequate information was available from these uncontrolled operations.
A further and most important turning point which has infact taken effect for development of industrial fisheries has been the new order of the oceans which emerged in the late 1970s by the declaration of the 200 mile Exclusive Economic Zone (EEZ) by the coastal states. This new order on the extension of the sea boundary has necessitated the islands to develop and manage the resources within their extended jurisdictions according to the International
IWAKIRI • Ram I Pelagic Fisheries in the South Pacific 99 (KEARNEY ; 1979 : p. 2) — states the direct impact of this new EEZ Order on the
National Fisheries Policies of the islands as follows :
"(1) The rights of coastal states to increase their control over the harvesting of the living resources within their respective exclusive economic zone.
(2) The obligation of coastal states to promote optimum resource utilization from these a r e a s .
(3) The obligations of Nationals fishing in an exclusive economic zone other than their own to comply with the conservation measures and with the other terms and conditions established in the regulations of the coastal states such as licensing fishermen, fishing vessels, disclosing information on catch effort and other statistics, fixing prices and quotas, and so on.
(4) The need to conserve the fishery resource base.
The above terms indicate of the increased rights and obligations of the coastal states to protect the resources for the benefit of mankind and to actively promote attainment of maximum sustainable yields".
Since the major economic species of tuna and bill fishes are of highly migratory nature whose population travel freely from the waters of one coastal state to another, a regional and international co-operation is needed for the management of these resources. Several biological reasons further enforce the need for a regional and international co-operation for management, conservation and rational use, such as those relating to the variable distribution of resources during their life cycle at different times within a common ocean and that disturbance at one point would affect the whole population cycle.
The need for regional and international co-operation of the highly migratory species was endorsed by Article 64, Part V of the Informal Composite Negotiating Text RSNT (1979
(later adopted in the Law of the Sea Convention, 1982) which states
"The Coastal States and other States whose Nationals fish in the region for the highly
migratory species ••• shall co-operate directly or through appropriate international organisations with a view to ensuring conservation and promoting the objective of optimum utilization of such species throughout the region, both within and beyond the EEZ. In regions for which no appropriate international organisation exists, the coastal state and other states whose nationals harvest these species in the region shall co-operate to establish such an organisation and participate in its work."
In accordance with this article of the Law of the Sea, a regional fisheries agency was established by the South Pacific Forum in 1979 to co-ordinate regional fishery concerns. Co-operation for fisheries management at the regional level was aroused by the island states towards maintenance of the highly migratory resources of the region, to maximise socio-economic benefits for the island people, to present a common front for negotiation with distant water fishing nations and in other international issues and to co-operate for research and statistics and surveillance. Part V of the Law of the Sea Convention explicitly recognises the coastal nations sovereign rights over all living marine resources, including the highly migratory species, within their 200 mile exclusive economic zones.
100 Mem. Fac. Fish., Kagoshima Univ. Vol.36, No. 1 (1987)
individual coastal nations' exclusive jurisdiction over highly migratory species conflicts
with effective management control over such species which requires greater regional and
international co-operation." (DYKE & HEFTEL ; 1981 : p.4).According to the prevailing "Fishery Conservation & Management Act" of 1976
(FCMA) ; USA does not recognise exclusive jurisdiction bycoastal nations overmigratory
fish.At the 1978 and 1979 South Pacific Forum, great debate led the islands of the region to exclude distant water fishing nations to full members of the Agency. Article II of the Forum, Convention (1979) states that the South Pacific Forum Fisheries Agency (FFA) membership consists of members of the SPF and other states or territories in the region on
the recommendation of the Committee and with the approval of the Forum. (FFA
Convention 1979 ; p. 2). This provision therefore excludes distant waterfishing nations, but allows nations with island dependencies to participate indirectly through their dipenden-cies.
However, despite many unsolved political issues on tuna management, the South Pacific
Forum Fisheries Agency (FFA) stands as an important step towards regional co-operation
and creation of regional fisheries agency. The objective of the FFA is to promote the conservation and rational utilization of the fish stocks of the region. Functions basicallyinclude collecting, interchanging and disseminating information on the fisheries issues, management procedures of the region, price, shipping, processing and marketing surveys, providing technical assistance on fisheries and development policies, and negotiating at the regional and international level.
The Agency has acted as a regional information center to supply information on catches, marketing, legal and economic analysis of fishing access, joint-venture arrangement, statistical information, and so on.
The Agency also aims to supply and assist at the national level upon the request of
individual countries. In 1980/81, the Fiji project included assisting the Government of Fiji
in its involvement in tuna price negotiation between PAFCO and IKA Corporation. (FFA : Director's Report 1980/81 : p.4).
Although the FFA's initial instituting had been based on international and regional politics, hence its effects and limitations on the present operations ; it is nevertheless seen by regional islands as the mechanism for development and management of the fisheries resources at the national, regional and international level ; the activities which otherwise cannot be performed by each island country independently.
(ii) Fiji's Industrial Fisheries Policy
Fiji's industrial fisheries is largely export based in order to provide foreign exchange and employment. According to the Development Plan Eight (1981-1985), industrial fisheries was seen to represent the major economic potential of the sector. Various programmes were put forward to increase production and processing with and emphasis on foreign involvement in areas of manufacturing, technical assistance and aid financing.
IWAKIRI • Ram I Pelagic Fisheries in the South Pacific 101 facilitate IKA Corporation activities by vessel construction and training and other means to
increase fishing effort. The second project related to tuna processing and marketing which
involved finding access to foreign markets and seeking preferential marketing terms. During the DP9 period, the low world-tuna prices made pole and line fishery uneconomical, therefore reducing the fleet to 3 in 1985. With the inadequate supply of fish the cannery has been operating at nearly half its capacity.
The current Development Plan (DP9) [1986-1990] which has just taken effect recognises
the industrial fisheries sub-sector as one under a state of flux in light of the continued low world tuna price and further the constraints in the operation and management at the production and processing level. It states the following comment with regard to industrial
fisheries :
"The industrial pelagic fisheries will remain the backbone of the fisheries sector despite unwelcome decline in production and foreign exchange earnings at the beginning of the plan period. Efforts should be directed however towards improved management measures for both IKA and the cannery and rooms made available to accommodate private participation through joint ventures or managemet contracts if it brings about the necessary expertise and competence. Regional awareness of the need to support the development of national fishing
and processing ventures will impose further challenges". (Central Plannig Office ; 1985).
The objective of the current development plan therefore includes the following : a ) To consolidate and expand skipjack tuna fisheries by assisting in the development of
IKA Corporation,
b ) To further encourage processing of tuna products for exports and diversification, c ) To encourage alternative fishing methods such as purse seining, Long-lining or a
combination of such methods applicable in Fiji waters,
d ) To investigate the possible involvement of neighbouring island countries in the local industry.
(Central Planning Office ; 1985).
The development strategies to achieve the above objectives include improving effeciency of local skippers, crew, engineering, shore management staff and labour through special training ; infrastructural development such as port facilities and freezer storage plants ; use of purse-seine fishing to increase the efficiency of the capital plant ; and increase private participation of local and foreign in terms of joint-ventures, bilateral or licensing fishing agreements for tuna fishery within the EEZ, and use of Fish Aggregation Devices (FADs) to facilitate fishing activities. The industrial fisheries is seen to be one aimed at increasing foreign earnings by way of reliance on foreign transfer of capital and technology in production and processing. Furthermore, direct government control and assistance has been essential in this industrial progress. Regional co-operation is also seen to be an important factor in the development of the small islands industrial fisheries.
102 Mem. Fac. Fish., Kagoshima Univ. Vol.36, No. 1 (1987)
2).
National Capitalistic Organisation and Functions of State Enterprise
(IKA Corporation)(i) Historical Progress of IKA Corporation
In 1968, at the South Pacific Commission-sponsored fisheries technical meeting in
Noumea, the island Governments and United Nations Development Programme/Food and
Agriculture Organisation (UNDP/FAO) expressed interest and agreed on the development
ofregional fisheries. Bythe early 1970s skipjack and tuna fisheries had developed in Papua
New Guinea and Solomon Islands under the Japanese capital. The UNDP/FAO set up a
mission for investigation of the feasibility of exploitation of the possible island states waters. The mission recommended for a local tuna fishery project for Fiji which started in 1971 and included activities such as bait fish survey, ecploratory fishing, training, fishhandling, marketing and processing. The project concluded work in 1973 which indicated
existence of skipjack tuna and baitfish resources in commercial quantities and recommended
the development of a skipjack tuna fishery based on 8 to 10medium size vessels landing up
to 5,000 tonnes of fish by 1979.
Following the servey result, in 1974 government entered into a joint-venture with
PAFCO for canning of tuna, and consequently also decided that capture of all fish within the territorial waters of Fiji should be reserved for Fiji nationals."In 1975 the Land Development Ordinance Cap. 124 was amended to allow the formation
of corporations dealing with fishing matters, thus giving way to the formation of wholly
government owned fishing corporation to be managed by Fisheries Division" (Anon ; 1975 : p.5).
Thus IKA Corporation was formed by the government as a step towards establishing an
individual fishery focusing mainly on the exploitation of skipjack tuna resources to supply
to the cannery for processing.
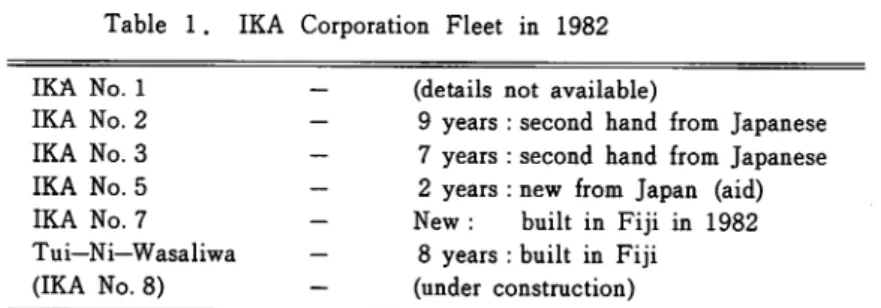
In 1976 IKA chartered its first vessel and also decided to hire foreign fishing vessels to fish in Fiji waters to meet government's obligation to PAFCO. By 1982 it had 5 vessels of its own and chartered 7. Table 2 gives the fleet size of IKA vessels and those chartered by IKA from 1976 to 1984. In 1982 IKA had a major turning point in deciding to reduce its pole
& line fleet. Table 1 below gives details on the IKA fleet in 1982.
Table 1. IKA Corporation Fleet in 1982 IKA No. 1 - (details not available)
IKA No. 2 — 9 years : second hand from Japanese IKA No. 3 — 7 years : second hand from Japanese IKA No. 5 — 2 years : new from Japan (aid) IKA No. 7 - New: built in Fiji in 1982 Tui—Ni—Wasaliwa — 8 years : built in Fiji
(IKA No. 8) — (under construction) Source : Central Planning Office. 1983 : p. 32.
IWAKIRI • RAM I Pelagic Fisheries in the South Pacific 103
However, with the decline in catch and the international tuna recession, the Corporation
decided to reduce its pole and line fleet from 1983 because of the high cost of operation, as pole and line has a low catch efficiency and high labour cost and consequently, increase
medium-size purse seiners in order to meet PAFCO's requirements.
Table 2. Fleet size and Composition Fiji Tuna Fleet
Purse Seine
Total Vessels
Vessel Type Pole & Line Vessels
Small Medium &
Large
Ownership IKA
Corporation
Vessels Char
tered by IKA Private
Foreign NZ Foreign Chartered by IKA YEAR 1976 1977 1978 1979 1980 1981 1982 1983 1984 1 2 2 4 5 5 6 6 4 1 4 6 3 5 6 7 7 3 1 1 1 2 2 2 1 2 2 1 1 3 2 6 8 8 12 14 17 16 13
Source : Central Planning Office. 1983 : p. 32
The Government requested South Pacific Forum Fisheries Agency (FFA) to carry out a
feasibility study on purse seining for IKA Corporation. IKA Corporation has already been chartering purse seine vessels from New Zealand and is planning to increase its purse seine fleet by further chartering, possibly from USA and constructing its own medium sized purse
seine vessels.
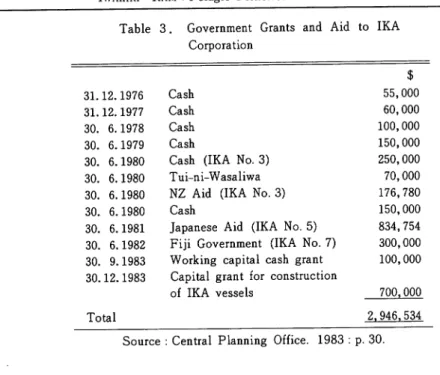
Since its establishment, IKA Corporation has faced several managemental and operation al difficulties in terms of financial, technical, production fluctuations, lack of skilled labour, and so on. The administrative organisation structure of the Corporation was re-organised in 1983 defining exact responsibilities at each level of management organisation. Figure 1 gives an outline of the new organisation chart made by the present General Manager of IKA Corporation. The government has continuously assisted IKA with grant and aid to facilitate its operations. Table 3 gives an indication of grant and aid to IKA Corporations for purchasing and constructing fishing vessels.
IKA Corporation has also relied on foreign technology and expertise by way of relying on
Japanese fishing masters and engineers for the necessary operational and training assistance. It has further sort foreign assistance mainly from Taiwanese, Korean and
Fleet Supervisor Storeman Fig. 1. Organisational Chart for IKA Corporation (October 1983) LAND DEVETOPMENT AUTHORITY IKA CORPORATION BOARD OF MANAGEMENT GENERAL MANAGER OPERATIONS DEPARTMENT Operations Manager Fleet Engineer Crews of IKA Vessels Engineering Requirements Store Engineer Deck Requirements Source: Central Planning Office. 1983: p. 12. ADMINISTRATION DEPARTMENT Financial Controller Accountant Accounts Glerks Telephonist, Typist sCD 3 o ^ O B < o o
IWAKIRI • RAM '. Pelagic Fisheries in the South Pacific Table 3. Government Grants and Aid to IKA
Corporation 31.12.1976 Cash $ 55,000 31.12.1977 Cash 60,000 30. 6.1978 Cash 100,000 30. 6.1979 Cash 150,000
30. 6.1980 Cash (IKA No. 3) 250,000
30. 6.1980 Tui-ni-Wasaliwa 70,000
30. 6.1980 NZ Aid (IKA No. 3) 176,780
30. 6.1980 Cash 150,000
30. 6.1981 Japanese Aid (IKA No.5) 834,754
30. 6.1982 Fiji Government (IKA No. 7) 300,000
30. 9.1983 Working capital cash grant 100,000
30.12.1983 Capital grant for construction
of IKA vessels 700,000
Total 2.946,534
105
Source : Central Planning Office. 1983 : p. 30.
(ii) Purpose and Target of IKA Corporation
The main purpose of IKA relates to the establishment of domestic entreprenurship such
that the government policy states that fishing within Fiji waters would be confined to local
people. Assistance from abroad for specialised experts, gear and equipment, and
technology has been sought to help to plan and implement the development programs. IKA
has also been contracting with foreign vessels to help towards meeting its commitment to PAFCO. Table 4 gives a representation of IKA's commitment to PAFCO.Table 4. IKA' s Commitment to Supply Skipjack Tuna to
PAFCO
Year Scheduled Quantity (t) Quantity Supplied (t) % Performance
1975 400 1976 1,150 1977 2,300 1978 3,100 1979 4,150 1980 1981 1982 1983 80 20 681 49 1,800 78 2,525 81 3,496 84 2,547 6,530 5,671 4,535
106
Mem. Fac. Fish., Kagoshima Univ. Vol.36, No. 1 (1987)
Upon the establishment of IKA, Development Plan Seven (DP7) : [1976-80] stated the
following functions of IKA Corporation.
a )
To contract with foreign vessels catching in Fiji Waters in the initial stages,
b)
To engage in commercial skipjack tuna fishing operations in order to supply fish for
the domestic market and for the processing and marketing operations of the
joint-venture with the PAFCO.
c )
To promote the development of locally owned fisheries enterprise and experience in
the types of vessels and fishing methods best suited to local conditions.
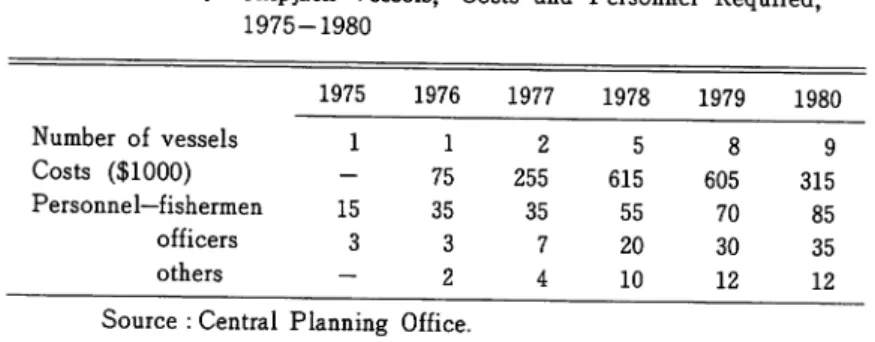
Table 5 indicates the initial target of IKA set for the DP7 period.
Table 5.
Skipjack Vessels, Costs and Personnel Required,
1975-1980 1975 1976 1977 1978 1979 1980 Number of vessels 1 1 2 5 8 9 Costs ($1000) — 75 255 615 605 315 Personnel—fishermen 15 35 35 55 70 85 officers 3 3 7 20 30 35 others - 2 4 10 12 12Source : Central Planning Office.
Seventh Development Plan 1976-1980. p. 95.
The initial plan stated in Development Plan Seven for IKA Corporation development
project indicated that the number of vessels were to increase from one in 1975 to nine by
1980. In the actual operationsin 1980 IKAhad achieved five pole and line of its ownand fivechartered pole and line and one private pole and line and one purse seine vessel.
Top management expertise including fleet engineers have been recruited from Japan to
develop the fishery and to maintain effective operation of vessels. IKA also aimed to benefit
from this employment of foreign experts by way of providing training on board for the local
labour.Government's plan for IKA Corporation during the Development Plan Eight (1981-1985)
period stated that Government was still to continue to rely on foreign management skills to
ensure for the continuity of operations of IKA. Taking into consideration IKA'scommitment to supply to the cannery the projected plan had aimed to increase its fleet by
four vessels under aid andexpand employment to over250 andaimed for a projected catchof
skipjackof 7,000mt. by 1985. The Government consequently was to providesupportto IKA through finance and technical assistance. During the DP8 period government was to furtherextend operation into fishing zones of adjacent states to extend the effective fishing season
and facilitate the use of capital equipment.
In the actual implementation of the plan, government had given grant to IKA for construction of IKA7 and 8. However, the lowworld prices for tuna during the period made
the pole and line fishery uneconomical. At the end of the Plan period IKA requested the
IWAKIRI • Ram '. Pelagic Fisheries in the South Pacific 107 The current Development Plan DP9 (1986-1990) states that despite the decline in
production, the industrial pelagic fisheries would still remain the backbone of the fisheries
sector. The Government aims to direct efforts, for improvement of the IKA management and to utilize the possible benefit from regional corporation.
The current objectives state that alternative fishing methods such as purse seining would
be encouraged and the possibilities of involving the neighbouring island countries into the
industrial sector would be sought. Other objectives involves training of local labour, increasing private and foreign participation in fishing and use of Fish Aggregation Devices(FAD) to facilitate fishing operations.
The operational scope of IKA defined in the constitution are broad ranging from —"fish
culture and harvesting of all forms of aquatic life to purchasing of marketable produce from other fishermen and to store, process, transport and market such produce." (Central Planning Office ; 1983 : p. 9).Main emphasis is placed on involvement of local nationals through training and technical assistance by foreign expertise and to operate IKA as an independent commercial
enterprise.
Since the inception of IKA, it is seen that major aim and target of IKA has been to fulfill its catch commitments to PAFCO and to provide technical training to local labour towards development of domestic entreprenurship.
(Hi) Present Activities
IKA Corporation is organised into 2 departments, the administration and management, and the operations department. The latter includes shore management and business accounting whereas the operational activities involve catching of fish by pole and line IKA vessels and chartered foreign and private pole and line and purse seiners.
The size of the fleet is given in Table 2 on Page 7. Pole and Line vessels are between 60t - lOOt where as purse seine vessels are 220-350t. IKA plans to build new purse seine vessels of 220 gross tonnage.
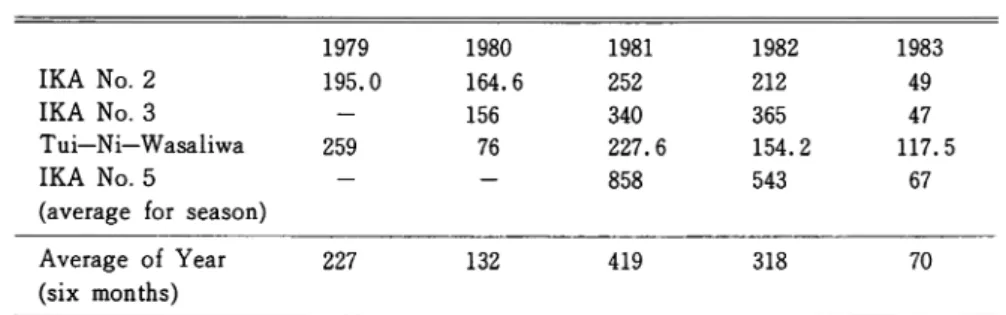
In 1985 only IKA 5, 7, and 8 were in operation. Two older pole and line vessels have been disposed and the number of chartered vessels reduced because of the difficulty of continuing pole and line fishery under the low world tuna prices. Total catch by IKA vessels is given for the period 1979-1983 in Table 6.
Table 6 . Catch Statistics of IKA Vessels (1979-1983) by Tonnes
1979 1980 1981 1982 1983
IKA No. 2 195.0 164.6 252 212 49
IKA No. 3 - 156 340 365 47
Tui—Ni—Wasaliwa 259 76 227.6 154.2 117.5
IKA No. 5 - — 858 543 67
(average for season)
Average of Year 227 132 419 318 70
(six months)
108 Mem. Fac. Fish., Kagoshima Univ. Vol.36, No. 1 (1987)
Figure 2 further indicates the total catchbyvessel group, chartered and owned by IKA. It
is seen that annual catches of Japanese chartered vessels are far higher than IKA vessels."Average catch on IKA vessels over the past years have been approximately 260 tonnes
per seasonwhereas the chartered JapaneseHokuku vessels have recorded average catches of 530 tonnes per vessels per month". (Central Planning Office ; 1983 : p. 33).Figure 3 gives details on skipjack and yellowfin landings by IKA vessels and the
corresponding price per tonne.
Fig. 2. Total Catch by Vessel Groups (1979-1982)
a a o H o o o o o 1979 1980 5 All HM Vessels
All Private Vessels
1
1981
Numeral indicate the number of vessels fishing Year
1982
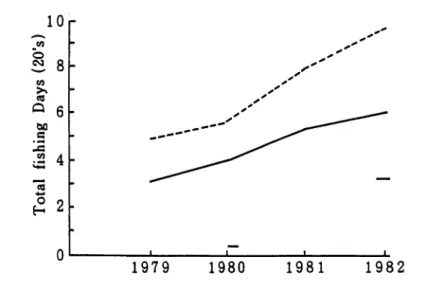
Figure. 4. indicates the total fishing days by the vessel group where as Figure. 5. gives the catch per day by vessel group. Figure. 6. gives further details on average tuna catch per vessel per month from 1979-1982. The graph clearly illustrates the seasonal fluctuations in catches with the peak of cycle in February and March and a low season from July to October. It is also seen that average catch per vessel of the HM vessels is higher than IKA
o 8 w o CO o g 2 < 5 -3 • 1.5 00 r-W Jz;
§ 1.000
H CO p < 500 >IWAKIRI • RAM : Pelagic Fisheries in the South Pacific 109
Fig. 3. IKA Corporation Skipjack & Yellowfin Landings 1976-1983
1976 77 78 79 80 81 82 83
MONTHLY SKIPJACK PRICE IN US$/T0NNE
0 in 111111111111 ii 111111111111111111111 ii 11 ii ii 11 li 111111 ii n I•111 ii •111111111111 • 1111. i. ii i ii i• 11
1976 1977 1978 1979 1980 1981 1982 1983
Landings (M/T)
881 1711 2525 3496 2547 6600 5571 3122(l/2yr)
110 Mem. Fac. Fish., Kagoshima Univ. Vol.36, No.l (1987) 10r o *J 8 en « 6 c •2 4 O n 5 r ^ 4 V . CO " — " CO 3 Q im <U Q. 2 -C o OS (J 1
Fig. 4. Total Fishing Days by Vessel Groups
1979 1980 1981 1982
Source : Central Planning Office. 1983 : p. 40.
Fig. 5. Catch per Day by Vessel Groups
79 80 81 82
i60r 140 120 o 2 u > < 100 80 60 40 20 M I I Fig. 6. Average Tuna Catch Per Vessel Per Month, 1979-1983 All HM VESSELS (JAPANESE / CHARTER)/ *.— ALLPRIVATE VESSELS
JFMAMJ
JASONDJFMAMJ
JAS
ONDJFMAMJ
JAS
ONDJFMAMJ
JASONNJFMAMJJASOND
1982 1981 1983 1980 1979 Source: Central Planning Office. 1983: p.34. 3 > > Tj C/5 O TJ112
Mem. Fac. Fish., Kagoshima Univ. Vol.36, No.l (1987)
Figure. 7. illustrates theaverage number ofdays spent fishing pervessel permonth for the
year 1979 to 1982. It shows that on average the HM vessels spent more days per month
engaged in fishing than IKA vessels.
The above comparative data on the performance of the chartered and IKA vessels
illustrate that IKA vessels had lower performance. The following factors were identified as
main reasons for the difference in performance.
"( a ) The difference in wage system. The wages ofthe Japanese crew on the HM vessels
are directly related to the value of the catches whereas IKA crew have been paid
fixed regular wages unrelated to their catches. This has not provided crew with a
direct financial incentive to increase catches.
( b ) IKA vessels have spent an average about five less days per month fishing than HM
vessels.
( c ) Asmaller proportion of the crew of IKA vessels actively engage in fishing than that
of HM vessels and private vessels.
( d ) The fish catch per man day is lower of IKA crew than HM crew.
( e ) The above facts point to a lower level of motivation and discipline on IKA vessels
than HM and private vessels."
(Central Planning Office ; 1983 : p. 37.
IKA Corporation relies heavily on foreign experts for technical assistance, particularly
Japanese fishing masters and engineers. Local people are trained on board the fishing
vessels. Training programes have been difficult to implement under the present low prices
of tuna and the seasonal activities of crew.
On the operation side, the number of staff on IKA pole and line vessels varies between
22(60t) to 28(100t).
(iv) Cost and Revenue Analysis
Beside operational difficulties, IKA also faces several administrative and management
problems.
The balance sheet as at 30th June 1983 showed the depreciation value of assets as $1,561,814 and accumulated loss as $2,260,080. Table. 7. gives details on revenue,
Table 7. Revenue, Expenditure and Accumulated Losses
The sales and net profit/(loss) and accumulated profit/(loss) situation for the
past five years are as follows :
Sales Profit/(loss) Accumulated Losses
1978 1,668,792 15,955 140,263
1979/80 1,096,628 (539,707) (399,445)
1980/81 4,052,368 (70,104) (469,549)
1981/82 3,836,986 (649,684) (1,119,234)
1982/83 2,234,134 (1,134,983) (2,260,080)
As at 30 June 1983, the Corporation is therefore in the untenable position of
having written down capital assets of $1,561,814 yet an accumulated loss of
$2,260,080.
> < Fig. 7. AverageDays Fishing perVessel per Month 1979-1982 30 -25 /-~T 20 ?-ALL HM VESSELS » ^ ALL PRIVATE VESSELS 15 10 JJ_ FMAMJ JASONDJ FMAMJ JASONDJ FMAMJ JASONDJ FMAMJ JASONDJ FMAM 1979 1980 1981 1982 19 •* data not available for 1979 and 1980 for IKA Vessels Source: Central Planning Office. 1983: p.36. J_U
W
ASOND 3> > 2 P ?* CO o114
Mem. Fac. Fish., Kagoshima Univ. Vol.36, No.l (1987)
expenditure and accumulted losses over the period.To illustratethe deterioration of the financial position, the balance sheet analysis for IKA
Corporation prepared by the Financial Controller of IKA is given in Appendix. A. Cost of individual vessel from 1979 to 1983 is also given in Appendix. B. (a), (b), (c), (d), (e),(f). These vesselshave made up the IKA fleetoverthe years. IKA No. 1 and IKA No. 2 have
been disposed because of high operation cost and Tui-Ni-Wasaliwa has been sold at the end of 1983, thus reducing the pole and line fleet.
Salaries and wages have contributed to high operating costs as indicated in Appendix. B. (a), (b), (c), (d) and (e) which shows the wage and salary cost of each vessel in
operation. Untill 1982 salaries and wages were based on fixed income which with low catches and fluctuations in catch together with low prices have contributed to high operation costs. Under the new management IKA has made a new wage agreement which directly relates to the value of catch or under a share system. Each vessel has a wage guideline based on a certain proportion of catch taking into account the fuel and ration costs in calculating the wages and salaries costs. Repair and maintainence costs have also been high over the period. Under the new management agreement, the shore management and administration
staff have been reduced to cut down the costs.
(V) Problems faced by IKA Corporation
Major problems faced by IKA has been identified in various reports on IKA's activities. The report by Central Planning Office (1983) on IKA's economic activities states the following problems identified by IKA's General Manager.
1 ) The decline in world marketfor tuna has price to fall from US $1,100 to US $890, a reduction of 20%.
At the same time IKA wages, fuel and ration costs have increased, thus causing a
reduction in real terms in excess of 25%.
2 ) Lack of experienced fishing masters.
Fishing masters and the dedication of good fishing masters are key to efficient operations. IKA has been relying on Japanese fishing masters which has been expensive as training of local crew and fishing masters is a long term activity. 3 ) Uneconomical ships.
The second hand and Japanese ships operated by IKA were designed about 12 years ago. The fuel price then was not a critical factor in the operation costs, however, the sudden rise in fuel price has increased costs by 25 to 30%. Maintenance costs of older ships are higher because all equipment has been sea water cooled (corrosion). 4 ) Unskilled engineers
IKA has had problems of lack of skilled engineers in order to diagnose mechanical faults. It is presently training local engineers on board.
5 ) Jetty facilities
Initial costs were high when repair and maintenance was done by contractors as IKA had no workshop or berthing facilities.
IWAKIRI • Ram I Pelagic Fisheries in the South Pacific H5
cut down costs and to facilitate for jetty facilities.
6 ) Fuel, ration and general expenses have also been high and IKA's new management plan is to cut down costs in this area as far as possible.
7 ) Dedication of fishermen
During bad fishing season fishermen lose motivation and dedication. However,
under the new scheme introduced, there is no basic pay but under the catch share
system.
8 ) Low bait catches
Bait fishing has seasonal fluctuations and IKA has faced problems of availability of
natural bait. IKA further faced problems with the customary rights owners as most bait fishing grounds are located within the coastal areas.
Other problems identified in the administration and management areas have been basically the following :
a ) Organisation Structure-IKA has adopted new organisation structure as the previous according to IKA's Auditors Review lacked formal coordination and communication and dis not define each level of authority.
b ) Lack of planning and analysis capabilities.
"The present circumstances in which IKA finds itself is partly due to lack of effective corporate planning and management. IKA has had no formal corporate plan to guide its development. Investments in new vessels have been made without any thorough feasibility analysis of their expected costs and benefits." (Central Planning Office 1983 ; p. 21).
c ) Other managemental problems include personnel and staffing and low labour productivity.
3) State of Foreign Investment into Fisheries Related Industries : Pacific Fishing
Company (PAFCO)
(i) History of PAFCO Operations
In early 1960s the Japanese expressed interest in establishing a freezing and trans-shipment base in Fiji to serve their longliners operating in the region. In 1963 an agreement was reached to from the Pacific Fishing Co Ltd (PAFCO), which was registered under the laws of Fiji. The Company based at Levuka had the following investment structure :
C. Itoh Co. 33%
Nihon Ryokoku Kaisha 25%
Banno Co. of Osaka 25%
Fiji Citizens 16. 7%
In 1974 a joint-venture was established between government of Fiji and PAFCO to develop local tuna processing and marketing from vessels fishing in South West Pacific and skipjack and yellowfin caught in the territorial waters and later in the Exclusive Economic Zone (EEZ) of Fiji. This was part of the government strategy towards industrial fisheries development in order to provide foreign exchange and employment.
116
Mem. Fac. Fish., Kagoshima Univ. Vol.36, No.l (1987)
The major element of the 1974 agreement included a re-capitalisation of the then existing
company, PAFCO, from F$ 600,000 to F$ 1,800,000 distributed as follows :
C. Itoh Co. 61%
Nichiro Ltd 10%
Fiji Government 25%
Fiji Citizens 4%
PAFCO began canning operations in August 1976. The cannery had the following capability :
Ice plant 30 tonnes production/24 hours Freezing plant 60 tonnes/24 hours
Cold storages 2,000 tonnes
Canning capability 60 tonnes (8-hour day 4 lines x 155mt/8hr) Fish meal plant 12 tonnes/8-hour day
Can making approx. 250,000 cans/8-hour day
PAFCO has contract with foreign and private fishing vessels besides IKA Corporation to supply catch to the cannery. Frozen tuna has also been imported to fulfil the demand for the
cannery.
Figure 8 illustrates the catch landings to PAFCO by contracted vessels.
(ii) Achievement of Production
PAFCO has the sole right to process and export tuna from Fiji. Table 8 gives PAFCO
production figures from 1974 to 1983. During the nine years (1975-1983) 66,926 tonnes of fish has been landed, 19,411 tonnes (29%) has been exported frozen and 47,515 tonnes
(71 %) has been used to produce 3,428, 429 cases of tuna (48X7oz) for export, 61,449 cases
of tuna flakes and 3,898 tonnes of fish meal for the local market.
The production is characterised by a progressive decline in longline catches and increasing pole and line catch of skipjack tuna. The decline in frozen fish exports corresponds with the increase in canned fish and fish meal production.
Table 9 indicates details on production of canned and frozen tuna by PAFCO. PAFCO's major buyers are Canadian and United Kingdom buyers (British Columbia Packers for albacore white meat; John West, Princes, Saisbury and Tesco for skipjack and yellowfin tuna light meat packs). Canned pet food is mostly sold to Australia. Frozen tuna, mainly yellowfin and albacore, are exported to USA and big-eye and bill fish to Japan. Table 10 indicates exports of tuna products and countries of destination.
(Hi) Operational Activities
PAFCO's operations involve "heading" and gutting of thawed tuna, followed by the
cooking and the labour intensive cleaning and fillet preparation process. The cleanedloins" are placed in cans as either a compressed "solid" pack or as a loose "flake" pack,
with additions of vegetable and/or brine. Cans are sealed, washed and auto cleared prior tolabelling and packing according to buyer instructions.
Fig. 8. Tund Landings at Pacific Fishing Company Longline Vessels Catch tonnes X1000 IKA Corp. Vessels Loc. Private P & L Vessels Chartered P & L Vessels m Purse Seine Vessels 1878 1977 1978 1979 1980 1981 1982 1983 1984 Year Source: Ministry of Primary Industries. Commodity Profile. Fish. 1985. p. 95 •pz Tl T] O
Table 8. PAFCO Production Figures Landings (t) longline pole and line imported/purse seine total Frozen Fish exports (t) Canned Fish '. production (cartons) Sales I export local Fish meal (t) 1974 3893 3893 4264 1975 2632 80 2712 2458 7,500 69,160 1976 3707 681 4388 2712 1977 5700 1800 7500 3152 1978 7970 2525 10495 3730 1979 3568 3496 7064 1349 1980 5702 2547 8249 3577 1981 3200 6530 9730 1668 1982 2139 5671 665 8475 528 1983 1557 4535 2221 8313 493 97,830 245,700 414,500 547,632 318,042 605,000 583,520 608,705 238,958 385,703 385,703 496,100 5,028 9,310 13,815 6,000 130 306 407 673 346,235 662,206 533,305 689,982 5,954 6,662 7,670 7,060 357 640 700 685 1J « Source : Central Planning Office, 1984. oq OC/J Table 9. Production of canned and frozen tuna by PAFCO 5" High qualitv products (T^-cai is) 1977 1978 1979 1980 1981 1982 1983 white meat albacore 95,538 228,608 224,090 90,935 132,131 138,905 144,864 < Light meat Yellowfin 10,565 21,893 18,733 16,712 25,928 75,007 46,391 pi Skipjack 64,886 79,505 133,245 133,327 260,899 272,332 270,157 ^ By Products O i—» Pet food 64,751 71,881 107,572 91,244 122,046 140,529 147,831 Low grade flakes 10,076 9,638 14,457 426 4,905 8,687 N. A. to 00 Fish meal (tonnes) 306 553 673 357 656 718 741 --J Frozen tuna (tonnes) Albacore — 1,572 0 1,467 839 — — Yellowfin -1,411 814 1,833 474 536 443 Big-eye/marlin -719 531 748 354 -Source : Landell Mills Associates, 1982 : 168-169 Fisheries Division Annual Reports 1977—1983
Table 10. Export of tuna products in units of cases 1977 — 1983 „„.. xt 4 ~ 1977 1978 1979 1980 1981 1982 1983 White Meat Tuna Canada 51,978 221,395 154,700 167,600 75,800 Switzerland -1,370 -Japan -938 -Australia 2,156 -— — U.S. A 43,825 -2.470 4,110 Light Meat Tuna England 75,580 78,230 177,340 113,818 226,465 Jordon -1,370 4,088 French Polynesia -— 500 Vanuatu -100 New Zealand -2,320 Pet Food Australia 56,076 81,390 110,400 86,400 51,200 Japan -28,009 U.S. A -— 37,760 Frozen Tuna U.S. A -3,025 298 2,387 474 Japan -719 768 893 1,191 Singapore -220 — — Italy — -«-297 296 — 94,272 144,864 g Source : Lai & Slatter, 1982 P. 35 Fisheries Division Annual Report 1982, 1983. 74,960 46,391 era o' > O 0 536 443 §
120
Mem. Fac. Fish., Kagoshima Univ. Vol. 33, No.l (1985)
to the store by cages and forklift trucks. Iced-fish is frozen in a 60 tonne/day blast-freezer.
Empty cans for packing are supplied by Fiji Can Company (Tokyo Seikan Co. ) located
next to PAFCO.The financial performance of PAFCO from 1974 to 1983 is given in Table 11.
During the 9 years, PAFCO had sales of $F 120. 25m, an accumulated loss of $F
487,872. It paid company taxes to the government of Fiji of $52,831 and dividends of $F324,000 of which $81,000 was paid to Fiji Government.
Fixed assets increased from $798,774 to $3,465,557 and accumulated depreciation
amounted to $F 2,041,127.
With the establishment of the processing factory, the number of contracted longline
vessels increased from 14 to 36 in 1976. In 1978, PAFCO achieved over $15 million in sales as a result of good albacore and skipjack catches.
An increase in oil price and the establishmentof 200 mile EEZ created an instability in the longline fishery and the dependence on local skipjack tuna became more important. (iv) Process of Employment
At the end of December 1983, PAFCO had 318 staff workingat Levuka of which 305 were
local and 13 expatriates. All operational staff are local people from the surrounding
villages. Women labour is used in cleaningand packing. Hourlypaid casual labour from thevillage is used at the factory and during unloading of catch. A bus collection service around
the island is operated for all workers. Table 12 indicates the salary and wage stucture of
PAFCO employees.
In 1983, payments by PAFCO in salaries and wages were as follows :
Local staff Japanese staff
(300) (17)
Salaries and wages 1,273,882 601,545
Tax 165,474 235,097
The Japanese staff are employed on contract basis as expatriates at management level.
PAFCO has a staff union with membership of full-time local workers which looks after workers welfare, disputes, compensation, etc. PAFCO tries to allocate work to all villagers in co-operation with the union. PAFCO claims that unlike tuna canneries in
Solomons and Papua New Guinea, labour cost is high because of the pressure for higher
wages through the workers' union.
(V) PAFCO/IKA Relations
There is a contractual agreement between IKA Corporation and PAFCO that PAFCO
would buy all catch from IKA vessels. The prescribed schedule in the early years of
Table 11. Economic Performance of PAFCO (1974-1983) F$ 1. Sales $ F 2. Profit (loss) after tax 3. Accumulated Profit/(loss) 4. Asset Dimi-nition Re serve (ADR) 5. Tax paid 6. Dividends paid 7. Fixed assets 8. Depreciation 9. Total provi sion for depreciation 1974 1975 1976 4125229 1946590 5351820 (191417) (400992) 58912 (592409) (533497) (533497) 880000 798774 47117 616304 880000 1074106 47658 663963 880000 2270421 85467 742376 Source : Central Planning Office, 1984. 1977 1978 1979 1980 1981 1982 1983 11134814 15171762 133642247 17903258 21704838 14705168 18968008 35177 145107 300007 749155 566941 (350000 from ADR) 33444 530000 2244290 143606 865298 68621 530000 2468082 150793 213638 530000 2644107 184805 55645 638800 (350000 (220000 to ADR) to ADR) (971636) 114964 (1100000 from ADR) (602836) 487870 880000 1100000 1100000 108000 2846476 191301 270000 216000 2851801 189661 3511078 259310 346555 25369 1013679 1198484 1384762 1531964 1787435 204112 3 > *> in o "d
Table 12. Salary and Wage Structure (PAFCO) 1975 1976 1977 1978 1979 1980 1981 1982 1983 Fiji citizens :
WaSes
74,206
73,576
580,552
739,202
900,374
703,113
1,054,228
1,089,005
1,273,882
£
Income
tax
12,416
29,263
64,639
93,057
126,450
81,680
138,331
134,994
165,474
P
Minimum wage :("ate)
0-74
0.805
1.034
1.034
1.106
1.317
1.417
1.417
1.437
(female)
0.68
0.735
0.957
0.957
1.024
1.226
1.326
1.326
1.338
Japanese staff (a) Fiji C. Itoh paid byC'
Itoh
130,995
80,223
93,826
110,713
g
Paid
by
PAFCO
NOT
AVAILABLE
57.543
120.334
lan
7*n
im
rwn
gj
57,543 120,334 140,740 166,070Total
(4
staff)
188,538
200,557
234,566
276,783
PAFCO paid by " " " "PAFCO
(9
staff)
^
259,066
323,390
301,768
237,454
Total income tax for allJapanese
staff
in
Fiji
17,869
69,519
81,567
140,557
139,111
191,589
222,967
226,839
235,097
(b)
Tokyo
(no
Fiji
tax)
~
i^T
(c)
C
Itoh
paid
by
C
Itoh
28,687
38,162
paid
by
PAFCO
28>087
3g
m
(1 staff 1983) Source : Central Planning Office, 1984. 40,561 27,785 40,561 27,785 < < o oIWAKIRI • RAM '. Pelagic Fisheries in the South Pacific 123 Year 1975 1976 1977 1978 1979 1980 1981 1982 1983
Source : Central Planning Office, 1984.
N. A. - not available
As a result of high operation cost and seasonal pole-and-line fishing with poor catches, IKA has not been able to meet its obligations to PAFCO. On the other hand, PAFCO has continued to rely on other private pole and line vessels and Taiwanese and Korean longliners.
Rise in fuel prices and the declaration of the 200 mile Exclusive Economic Zone (EEZ) by the coastal states has reduced the foreign longline operations, thus reliance by PAFCO on IKA Corporation on the other hand depends on prices paid by PAFCO which is determined by the world tuna prices. The decline in world tuna prices since 1981 have reduced the skipjack price paid to IKA from US $1,100 per tonne to a current price of US $700 per tonne.
4) Labour Force and Technology Transfer
The establishment of PAFCO was seen as a means of generating employment. Clause 22 of the PAFCO Agreement required representation of Fiji citizens as follows :
Year Minimum percentage Fijian Average actual percentage citizens to be employed of Fijian citizens employed
1975 85 87.4 1976 89 92.4 1977 90 94.2 1978 91 94.2 1979 92 94.8 1980 94.7 1981 96.0 1982 95.9 1983 96.0
Source : Central Planning Office, 1984.
The management structure is given below in Table. 13. (a) and (b) for 1977 and 1983. There has been a gradual upgrading of local staff at the middle management level.
Scheduled Quantity % Performance
quantity (mt) supplied (mt) 400 80 20 1,150 681 49 2,300 1,800 78 3,100 2,522 81 4,150 3,496 84 N.A. 2,547 N.A. * 6,530 * * 5,671 * * 4,535 *
124 Mem. Fac. Fish., Kagoshima Univ. Vol.36, No.l (1987)
Table 13 (a). Details of PAFCO Employees (1977)
Japanese Taiwanese Classification Assistant to General Manager 1 Manager 2 Assistant Manager 3 Section Chief 1
Section Assist. Chief 1
Supervisor 3 1 Senior staff Headman Assistant Headman Permanent workers Apprentice Female—temporary Casual workers TOTAL 11
Table 14 (b). Details of PAFCO Employees (1984)
Japanese Taiwanese Classification General Manager 1 Assistant General Manager 1 Manager 2 Assistant Manager 2 Section Chief 4
Assistant Section Chief 1
Supervisor 2
Senior staff Leaders
Assistant Leaders Permanent workers
Male temporary workers Female temporary workers
TOTAL 12 1
Source : Central Planning Office, 1984
Fisheries Division Annual Report, 1977
Fijian Total 1 2 3 1 1 2 4 4 4 2 2 10 10 70 70 1 1 100 100 196 208 Fijian Total 1 2 2 4 1 1 3 6 6 12 12 8 8 146 146 25 25 125 125 325 338
IWAKIRI • RAM '. Pelagic Fisheries in the South Pacific 125 Training has been given to 20 semi-skilled staff in Japan in the late 1970s but this was
discontinued due to lack of financial support. However, foreign expertise particularly
Japanese technical control is still regarded as important towards continuity of the cannery
and as a step towards long-term transfer of technology.
5) Competitive Situation of Marine Products in Overseas Markets
In the early 1980s, the fishing industry and tuna canneries all over the world experienced the disastrous effects of the market depression and the canned tuna market continued to decline. This depressed state of the industry also led to closure of canneries in many parts of the world and low prices paid to tuna vessels.
Poor tuna season in Fiji, an increase in smaller size fish and low prices paid for canned products all contributed to the uneconomical production by PAFCO. In 1982 PAFCO's production decreased by only 3% but export earnings fell by 30% due to the significant reduction in selling price and PAFCO suffered a loss of nearly $1 million.
Production of canned tuna increased in 1983 but the selling price continued to decline and marketing became a problem because of competition from Thailand and Philippines. Increase in United States purse seining created an over-supply of tuna, thus further continuing the price to stay low.
C. Itoh Co. is responsible for the marketing of all PAFCO's products. There are no import or export duty levied on raw or processed fish. Fiji's major buyers for tuna are United Kingdom and Canada. Fiji has a market share of over 10% in the UK. The British market offers preferential access within terms of the EEC-ACP Agreement under Lome II which provides a 24% duty concession for PAFCO's products going to U. K. Belgium as a member of the European Community also provides a small domestic market for yellowfin and skipjack solid packs.
PAFCO also exports both flake and solid white packs to Canada since 1977 but there are no preferential access such as those normally accorded to developing countries. Although the demand by Canadian buyers for white meat tuna increased, the decline in longline fishing has not been able to meet the required quantities of raw albacore.
USA provides the largest market for tuna, however there are no developing country concessions in the form of tariff reduction on any products which leaves Fiji competiting with the Japanese suppliers who are responsible for the majority of white meat supplies and are largest single supplier of light meat. (Lundell, 1982 : 144) ••• indicates that because of the nature of the import control system and the increasing proportion of imports originating in US joint-venture companies, that the sales of Fijian tuna to US will be opportunist by nature rather than strategic.
Presently PAFCO sees the need for high quality products to compete with the increasing operations in Thailand, Korea, and other American joint-ventures in developing countries.
However, PAFCO's continuity and increased production has been a result of negotiated market opportunities in United Kingdom and as a result of stable pound sterling compared to the fluctuating US dollar and US tuna market. Joint-ventures in Papua New Guinea where
I26 Mem. Fac. Fish., Kagoshima Univ. Vol.36, No.l (1987)
major market was USA had to close operations as a result of uneconomical operations.
The presentPAFCO joint-venture agreement is still under renegotiation after its first ten
years of operation. Negotiations so far have indicated that C. Itoh CO. is reluctant to
continue operations under the present terms of agreement. The Fiji Governmenton the other
hand hopes to increase its share in order to keep the industrial fisheries base as an attempt to
develop the pelagic fisheries ; to provide employment, foreign exchange and as a means oftechnology transfer.
Discussion
With political independence and commitment towards self-reliance, the islands sort to
develop commercial tuna industry to increase foreign exchange by way of getting a greater
share of benefits and involvement with the foreign operations. Furthermore, the declaration of the 200 mile Exclusive Economic Zone under the Law of the Sea increased the
responsibility of the islands to manage the resources within their extended jurisdictions. As a result of this new order of the oceans, the South Pacific Forum established a regional
fisheries institution called the Forum Fisheries Agency (FFA) as a mechanism for the development and management of the fisheries resources of the islands. The island governments in their National Development Plans also place considerable emphasis on the
development of industrial fisheries in order to provide employment and foreign exchange.
On the other hand, through economic history there have been two major courses for the world capitalist development. The gradual progress of small-scale production into enterprise scale operations and the transfer of merchant capital into new investment areas.
Adequate demand in the domestic market for products was also essential for entrepreneual development. However, through the rapid industrialisation policy for economic progress a further modernised course has been sought with the introduction of national and foreign
capital.
From a historical perspective, except for foreign investment in plantation and mining
development, Fiji's economy does not have the basic conditions for capitalistic develop
ment, as the economy has been carried on under household scale production. In fisheries, two enterprise scale operations are combined in order to develop the industrial pelagic fisheries following the modernised course of industrial progress.
IKA Corporation is financed by state capital in order to exploit the resources of the 200 mile EEZ while PAFCO is a foreign joint-venture between government of Fiji and Japanese trade companies to facilitate processing and marketing of catch. The development of IKA Corporation under state capital exhibits a similar course as that of the Japanese capitalistic fisheries development where the ultimate aim has been to transfer the state enterprise into private sector as a means to establish domestic entreprenurship. The establishment of PAFCO and IKA Corporation also provide an essential means of transfer of technology into the fisheries sector such as processing, handling, cold storage, shipbuild ing, engine maintenance, business management, etc.
IWAKIRI • RAM '. Pelagic Fisheries in the South Pacific 127
that both are interdependent. IKA's market prices are determined by PAFCO, whereas
PAFCO's availability of raw materials is determined by IKA's performance. Moreover, this industrial fisheries exists independently from the coastal fishery. It is export-orientated,thus depends on international tuna market prices ratherthan on the domestic market trends.
Like all other tuna industries in the world PAFCO and IKA are also facing similar
problems such as high cost of operations and competitive market situation because of low
tuna prices.
PAFCO's dependence on the preferential trade arrangements has enabled PAFCO to
continue operations during the depressed market situation. Reliance on opportunity markets has become risky because of oversupply of tuna in the American market. Thus government assistance for seeking preferential market opportunities is still vital for the continuity of PAFCO untill the present market situation improves.
Low prices of tuna and seasonal availability of catch has also made IKA's pole and line fishery uneconomical. The number of pole and line vessels has been reduced and IKA is seeking alternative techniques for exploitation of pelagic fisheries. Government financial support has been essential for construction of more efficient boats and in providing the necessary funds for the operations.
Despite these continued problems, the current Development Plan still considers the industrial fisheries as an important sector towards fisheries development.
The islands have realised that their major economic potential lies in primary industrial development rather than having capital-intensive industries.
Moreover, with vast areas of ocean, fisheries is regarded as a sector of major economic potential. The small-scale fisheries provides the major means of livelihood for the outer island community and the coastal villages, while the industrial fisheries is aimed towards providing foreign exchange. Fisheries development is also seen as a means of improving the technical know-how, generate employment, and help towards rural development. Thus, given the complex socio-economic structure of fisheries, hence its planning to achieve such development objectives, one must take into account the particular characteristics of small
island economies.
The following state some broad recommendations towards achieving such development objectives.
Regional Co-operation -There is a need for a regional co-operation for fisheries management and development. Considering the smallness of each of the island states in the international setting, limited economies of scale for industrial production, marketing and distribution problems, moreover, sharing of a common resource of the highly migratory species necessitates for a regional co-operation.
Bibliographies
Central Planning Office. Economic Analysis of the IKA Corporation. Octorber 1983.
Central Planning Office. Fiji's Seventh Development Plan. 1976-1980. Policies and Programmes for
128
Mem. Fac. Fish., Kagoshima Univ. Vol.36, No.l (1987)
Central Planning Office. Fiji's Eighth Development Plan. 1981-1985. Policies and Programmes for
Regional Development. (Vol.2). Suva, Government Printer. 1980. 221p.
Crocombe, R — (et. al). Politics in the Pacific Islands : Foreign Forces in Pacific Politics. Vol.A. Suva, Institute of Pacific Studies. 1983. 325p.
DYKE. J. V. ••• [et. al] Tuna Management in the Pacific : An Analysis of the South Pacific Forum Fisheries Agency. Hawaii, University of Hawaii Law Review. 1981. 65p.
Government of Fiji. Fisheries (Chapter 135) In : Laws of Fiji. Suva, Government Printer. p. 1698-1705 Fisheries Regulations p. 5484-5995.
Government of Fiji, Marine Spaces Act. (Chapter 158A). In : Laws of Fiji. Government Printer,
1978. 14p.
IKA Corporation. Financial Statement for the year ending 30 June 1984. 15p.
Kearney, R. E. An overview of recent changes in the Fisheries for Highly Migratory species in the Western Pacific Ocean and Projections for future development. Suva, South Pacific Bureau for Economic Corporation. 1979. 96p.
Ministry of Agriculture and Fisheries. Annual Report for the years : 1975, 1976, 1977, 1978, 1979,
1980, 1981, 1982, 1983. Suva, Fisheries Division.
Pacific Fishing Company Ltd. Annual Reports : 1978, 1979, 1980, 1981, 1982, 1983, 1984. South Pacific Forum Fisheries Agency. IKA Corporation Tuna Small Purse Seiner Study. (Draft
Report). Forum Fisheries Agency. 1985. 131p.
APPENDIX : A. 1. WORKING CAPITAL 30th June 1983 30/6 1982 30/6 1981 30/6 1980 RATIO OR CURRENT ' 592996 935665 1486752 355018 RATIO 1705241 1138674 1179903 331901 Current Assets Current Liabilities =0.34 =0.82 = 1.26 = 1.05 or 1 : 0. 34 1 :0.82 1 :1. 26 1 :1.05
Working Capital or Current Ratio
The trend in the working capital for the last three years show that current liabilities have steadily exceeded current assets. Thus the short term finance is being eroded and is virtually non-existent. There is an inadequate level of working capital, in that there is a low level of investment in the current assets structure, where as liabilities have been increasing.
The industry level should be a one to one (1 :1) or above that. In order to achieve this, cash has to be injected by the proprietors or additional sales and other revenues have to be generated by fixed assets employed by the Corporation.
IWAKIRI • Ram '. Pelagic Fisheries in the South Pacific 129
2. CASH FLOW RATIO
30/6 1983 30/6 1982 30/6 1981 30/6 1980
Net Profit (Less) + Depr Expense (1134983) -221940 (649684) -190112 (70104) -239025 (539707) -147573 Fixed Assets 1561814 = 0.58 1624268 = -0.28 1358778 = +0.12 759594 = -0.52
The Cash. Flow Ratio
Indicates the rate of funds provided from the enterprise own resources for the replacement of its major fixed assets.
The trend in the ratio reflect a deteriorating position. The internal resources of the Corporation cannot finance replacement of fixed assets and as well as maintain the working capital ratio.
This (low) ratio when taken in conjunction with the proprietary ratio and the working capital ratio, shows that fixed assets have to be financed from either additional funds provided by the shareholders or from term borrowing.
3. PROPRIETAR Y RATIO
Total shareholders Funds total Liabilities OR 30/6 30/6 30/6 30/6 1983 1982 1981 1980 (89854) 1027300 1376984 462334 2065818 1534358 1471132 651726 = -0.04 =0.67 =0.94 =0.71 2065818 1534358 1471132 651726 (89854) 1027300 1376984 462334 ) -22.99 1.49 1.06 1.41
CAPITAL GEARING RATIO
Total debt (Liabilities) = Total Equity (shareholders Funds
Proprietary Ratio
This ratio reflects the extent of the proprietors (shareholders) equity to external sources of funds (total liabilities) used to finance the enterprise. The trend of the ratio show that over the 3 year period, the Corporation has been relying heavily on external sources of funds. Shareholders have not matched the extent of borrowing from external suppliers of funds.
This could lead to the assumption that shareholders are not willing and prepared to take the risk of financing the enterprise. For a high risk enterprise, such as a fishing Corporation, the shareholders should take the full risk of financing the enterprise, then only can external suppliers of finance express an interest in financing the enterprise further if need be. The proprietary ratio also reflects on the working capital ratio. The higher the proprietary ratio the greater the working capital will be.