of the RV makes the assessment of the RV mechanical activation sequential pattern challenging. Accordingly, the aim of the present study was to characterize the temporal sequence of RV free wall deformation in healthy subjects on 2-D speckle tracking echocardiography and tissue Doppler imaging.
Methods
SubjectsA total of 60 consecutive healthy children (mean age, 2.8±1.4 years; range, 1.0-5.0 years) were prospectively examined between December 2013 and January 2016. Participants were included in this study only if they were between 1 and 5 years of age. All protocols were approved by the Institutional Review Board of the Tokushima University Hospital and conformed to the ethics guidelines of the Declaration of Helsinki (1975). The parents of all subjects provided written, informed consent for their chil-dren to participate in the study.
Standard Echocardiography
All echocardiography was performed with commercially available echocardiography systems equipped with 1–5
R
ight ventricular (RV) dyssynchrony is frequent inpulmonary arterial hypertension and is an inde-pendent predictor of clinical worsening, and may regress with effective treatment.1,2 Abnormalities in the
temporal pattern of RV mechanical activation have been proposed as one of the determinants of RV dysfunction in patients with surgically repaired congenital heart disease (CHD).3,4 Cardiac resynchronization therapy (CRT) has
shown benefits for patients with CHD and for those with medically refractory RV failure.5,6 It can compensate for
electrical and mechanical dyssynchrony in patients who have intraventricular conduction and mechanical delay. To evaluate RV dyssynchrony, the normal RV contractile pattern must be determined first. Then, the structural-functional relationship of the RV can be assessed, which would be helpful in directing CRT for patients with RV failure. Consequently, accurate determination of RV sequential contraction is important in the management of various cardiac diseases with congestive heart failure.
Temporal differences in the motion between the RV inlet and outlet in healthy subjects have been reported,4,7 but
characterization of the RV mechanical activation sequence with different imaging techniques has provided conflicting data.4,7,8 The complex geometry and myofiber arrangement
Received March 10, 2017; revised manuscript received April 23, 2017; accepted May 4, 2017; released online June 6, 2017 Time for primary review: 39 days
Department of Pediatrics, University of Tokushima, Tokushima, Japan
Mailing address: Yasunobu Hayabuchi, MD, Department of Pediatrics, University of Tokushima, 3-18-15 Kuramoto-cho, Tokushima 770-8503, Japan. E-mail: [email protected].
ISSN-1346-9843 All rights are reserved to the Japanese Circulation Society. For permissions, please e-mail: [email protected]
Temporal Sequential Pattern of Right Ventricular
Free Wall Contraction in Normal Children
Yasunobu Hayabuchi, MD; Akemi Ono, MD; Yukako Homma, MD; Shoji Kagami, MD
Background: The temporal sequence of right ventricular (RV) deformation is related to RV dysfunction. The sequence of RV free wall contraction was investigated.
Methods and Results: In this prospective study, strain profiles using speckle-tracking echocardiography and tissue Doppler-derived pulmonary and tricuspid annular motion were assessed in 60 normal children. Circumferential RV free wall strain of 3 individual seg-ments (anterior, lateral, and inferior) was evaluated. Longitudinal strain was assessed in 3 individual segseg-ments (RV outflow tract [RVOT], apical, and RV inflow tract [RVIT]). The isovolumetric contraction time (ICT) and the time interval between the onset of the QRS wave to the peak s’ wave were measured for pulmonary and tricuspid annular motion velocities. The time to peak circumfer-ential strain was significantly lower in the anterior than in the lateral and inferior segments (339.1±19.5, 358.3±21.8, and 366.6±22.4 ms, respectively; P<0.0001). Longitudinal deformation of the RVOT segment occurred before the apical and RVIT seg-ments (351.8±23.1, 366.3±20.1, and 369.2±21.3 ms, respectively; P<0.0001). The ICT and the time to peak s’ were significantly shorter in pulmonary than in tricuspid annular motion (49.4±10.1 vs 58.0±13.2 ms; and 104.7±12.2 vs. 160.5±27.1 ms; P<0.0001 for each).
Conclusions: Longitudinal deformation of RVOT precedes RVIT. Circumferential deformation occurs in the anterior segment before the lateral and posterior segments. The presence of mechanical time heterogeneity appears important for RV performance. Key Words: Children; Right ventricle; Speckle tracking; Tissue Doppler imaging
tudinal free wall was divided into 3 segments: RV outflow tract (RVOT), apical, and RV inflow tract (RVIT) segments.9
After optimization of the gain, dynamic range, and time gain compensation, the digitized echocardiographic movie images were digitally stored with a frame rate ranging from 79 to 120 frames/s. Special care was taken to fine-tune the region of interest using visual assessment during cine loop playback to ensure that segments were tracked appropri-ately. All imaging data were digitized and stored on a hard disk in the ultrasound unit and then transferred to a per-sonal computer for further analysis. Image analysis was performed using a novel customized software program with 2-D speckle tracking (US Image Viewer 2.0, Hitachi-Aloka Medical) containing a pattern-matching algorithm that tracks tissue pixels. A tracking point is selected in the first frame of a 2-D echocardiographic image, and the algorithm then searches the next frame for the region that is assumed to be the closest to the selected point, according to the distribution of pixel intensity. The total movement of the selected point was traced by repeating this process frame by frame throughout the whole cardiac cycle, and these data were then recorded as coordinates. The move-ment of the tracking point can be visualized on the screen during analysis, and the trace of the point can be visually confirmed (Figure 1A,B). When mistracking compared with the actual wall motion was judged visually, new points were set, and tracking was resumed. Points of inter-est were tracked several times, confirmed visually, and the average tracking pattern was selected for further analysis. and 3–7-MHz sector transducers (Preirus digital
ultra-sound system; Hitachi-Aloka Medical, Tokyo, Japan). All data were acquired from subjects in the left lateral decubi-tus position during shallow respiration or end-expiratory apnea. Left ventricular end-diastolic dimension (LVEDD) and LV end-systolic dimension (LVESD) were measured in the parasternal long-axis view. Pulsed Doppler LV and RV inflows were recorded in the apical 4-chamber view, placing the sample volume at the level of the tips of the leaflets. LV ejection fraction (LVEF) was calculated from apical 2-chamber and 4-chamber images using the biplane Simpson’s technique. All measurements were performed in 3 cardiac cycles and then averaged.
2-D Speckle Tracking Echocardiography
Circumferential 2-D RV Free Wall Deformation Circum-ferential RV free wall strain was evaluated from the sub-costal LV short axis view. A region of interest was traced on the endocardium at end-diastole in the RV free wall from the LV short axis view at the level of the papillary muscles (Figure 1A). The RV free wall was divided into 3 segments (i.e., anterior, lateral, and inferior segments),9,10
and 3 corresponding time-strain curves were evaluated. Longitudinal 2-D RV Free Wall Deformation Longitudinal RV free wall deformation was assessed using the images acquired with a subxiphoid right anterior oblique view of the RV (Figure 1B). The images were obtained by inclining the head and rotating the transducer counterclockwise from the usual subxiphoid 4-chamber view. The RV
longi-Figure 1. (A) Speckle tracking image of a healthy 2-year-old girl showing repre-sentative recordings of right ventricular (RV) free wall circumferential deforma-tion. The RV free wall is divided into 3 segments: anterior (Ant), lateral (Lat), and inferior (Inf). Points of interest are placed on the endocardium at end-dias-tole in the RV free wall, and these are automatically tracked during the cardiac cycle. (B) Speckle tracking image show-ing longitudinal deformation of the RV free wall in a healthy 2-year-old girl. LVOT, left ventricular outflow tract; PA, pulmonary artery; RA, right atrium; RVIT, RV inflow tract; RVOT, RV outflow tract. (C) Representative recording of pulmo-nary annular motion on tissue Doppler imaging in a healthy 2-year-old boy. The long-axis view of the RVOT and main PA (MPA) is visualized, and the sample vol-ume is positioned on the RV free wall side of the pulmonary annulus (yellow arrow). Ao, aorta; LPA, left pulmonary artery; RPA, right pulmonary artery. (D) Schematic diagram of RV contraction assessment. The temporal sequence of RV free wall contraction is evaluated using circumferential strain on speckle tracking (A; green arrow), longitudinal strain on speckle tracking (B; red arrow), and pulmonary annular (C; purple) and tricuspid annular (D; purple) motion velocities on tissue Doppler imaging.
RV Free Wall Circumferential Strain
A representative recording of the profile of the RV free wall circumferential deformation in a normal subject is shown in Figure 2. The RV free wall was divided into 3 segments (anterior, lateral, and inferior segments). The time-strain curves of circumferential deformation for the 3 individual segments are shown in Figure 2A. The circumferential strain was significantly lower in the anterior segment than in the lateral and inferior seg-ments (18.9±3.6%, 24.7±4.0%, and 25.4±4.9%, respectively; P<0.0001; Figure 2B), and the time interval between the onset of the QRS complex and the peak strain was sig-nificantly shorter in the anterior segment (339.1±19.5, 358.3±21.8, and 366.6±22.4 ms, respectively; P<0.0001; Figure 2C). Movie S1 shows the RV circumferential strain pattern in slow motion. On visual observation the motion and contraction are earlier for the anterior segment than for the lateral and posterior segments.
RV Free Wall Longitudinal Strain
The representative time-strain curves for the 3 segments of the RV free wall are presented in Figure 3A. The RV lon-gitudinal free wall was divided into 3 segments (RVOT, apical, and RVIT segments). The strain was significantly lower for the RVOT segment than for the apical and RVIT segments (21.8±4.1%, 24.1±4.5%, and 26.0±5.4%, respec-tively; P<0.0001; Figure 3B). The RVOT segment had an earlier peak strain time than the other 2 segments (351.8±23.1, 366.3±20.1, and 369.2±21.3 ms, respectively; diastole, defined as the Q wave, on a simultaneously
recorded electrocardiogram.
Pulmonary Annular and Tricuspid Annular Motion
Pulmonary annular motion velocity was measured using tissue Doppler imaging (TDI) in the long-axis view of the RVOT and pulmonary artery.11 Guided by the 2-D images,
a sample volume with a fixed length of 5.0 mm was placed on the pulmonary annulus of the RV free wall side (yellow arrow, Figure 1C). Furthermore, tricuspid annular motion was recorded in the apical 4-chamber view. The ultrasound beam was positioned parallel to the direction of the pulmo-nary and tricuspid annular motions. All tissue Doppler parameters were measured during 3 consecutive heart cycles, and the means calculated. The pulmonary annular and tricuspid annular motion velocities evaluated on TDI reflect RVOT contraction and RVIT contraction, respec-tively.
Temporal Sequence of RV Contraction
The assessment method of RV free wall contraction is shown in Figure 1D. The RV sequential contraction was evaluated by circumferential strain using the speckle track-ing method (A; green arrow), the longitudinal strain ustrack-ing the speckle tracking method (B; red arrow), and the pul-monary annular (C; purple) and tricuspid annular (D; purple) motion velocities using TDI. In order to analyze the temporal sequence, the time interval between the onset of the QRS wave to the peak strain was measured for RV free wall strain. Furthermore, the isovolumetric contrac-tion time (ICT) and the time interval between the onset of the QRS wave and the peak s’ wave were also measured for pulmonary annular and tricuspid annular motion veloci-ties evaluated on TDI.
Statistical Analysis
All data are expressed as mean ± SD or as median (5th–95th percentiles). Statistical significance was determined using Mann-Whitney U-test or the Kruskal-Wallis test, followed by Dunn’s test, as appropriate. All statistical calculations were performed using Microsoft Excel 2007 (Microsoft Corporation, Redmond, WA, USA), Prism version 6.0 (GraphPad Software, San Diego, CA, USA) or JMP 11 (SAS Institute, Cary, NC, USA) installed on a desktop computer. P<0.05 was considered significant. The interob-server and intraobinterob-server variabilities of RV deformation and TDI measurements were assessed on Bland-Altman analysis in a blind manner. Data were recorded and assessed at 5-min intervals by observers 1 and 2 from 20 randomly selected participants. For intraobserver variabil-ity, data were analyzed twice, 8 weeks apart. Interobserver variability was assessed by analyzing data from 2 separate observers blinded to each other’s results.
Results
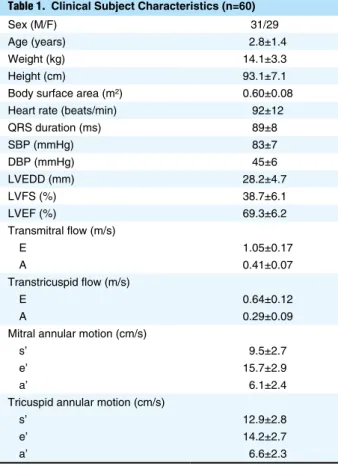
Participant CharacteristicsNo subjects were excluded from the subsequent analyses due to suboptimal recording from poor echocardiographic imaging. Accordingly, the study group included 60 healthy children (mean age, 2.8±1.4 years; range, 1.0–5.0 years). Clinical, echocardiographic, and hemodynamic data are listed in Table 1.
Sex (M/F) 31/29 Age (years) 2.8±1.4 Weight (kg) 14.1±3.3 Height (cm) 93.1±7.1 Body surface area (m2) 0.60±0.08
Heart rate (beats/min) 92±12 QRS duration (ms) 89±8 SBP (mmHg) 83±7 DBP (mmHg) 45±6 LVEDD (mm) 28.2±4.7 LVFS (%) 38.7±6.1 LVEF (%) 69.3±6.2 Transmitral flow (m/s) E 1.05±0.17 A 0.41±0.07 Transtricuspid flow (m/s) E 0.64±0.12 A 0.29±0.09 Mitral annular motion (cm/s)
s’ 9.5±2.7 e’ 15.7±2.9 a’ 6.1±2.4 Tricuspid annular motion (cm/s)
s’ 12.9±2.8 e’ 14.2±2.7 a’ 6.6±2.3 Data given as n or mean ± SD. DBP, diastolic blood pressure; LVEDD, left ventricular end-diastolic dimension; LVEF, left ventricular ejection fraction; LVFS, left ventricular fractional shortening; SBP, systolic blood pressure.
Pulmonary Annular and Tricuspid Annular Motions
Pulmonary annular motion and tricuspid annular motion velocities were assessed to evaluate RVOT and RVIT per-formance. Pulmonary annular velocity was evaluated on P<0.0001). On the slow-motion movie of RV
longitudi-nal deformation, the movement and deformation of the RVOT are earlier than for the apical and RVIT seg-ments (Movie S2).
Figure 2. (A) Circumferential strain curves for the 3 individual seg-ments (anterior, Ant; lateral, Lat; and inferior, Inf) for an entire heart cycle. (B) Peak strain and (C) time interval between the onset of the QRS wave and peak strain for the 3 segments of the right ventricle (RV) free wall. Boxes, IQR; central line, median. Whiskers, 5th–95th percentiles. *P<0.0001 vs. lateral and inferior segments.
Figure 3. (A) Longitudinal strain curves for the 3 individual seg-ments (right ventricular outflow tract, RVOT; apex; and RV inflow tract, RVIT) for an entire heart cycle. (B) Peak strain and (C) time interval between the onset of the QRS wave and peak strain for the 3 segments of the RV free wall. Boxes, IQR; central line, median. Whiskers, 5th–95th percentiles. (D) *P<0.05 vs. apical segment, P<0.0001 vs. RVIT segment. (C)
†P<0.001 vs. apical segment,
Figure 4. (A) Pulmonary annular motion and (B) tricuspid annular motion velocity on tissue Doppler imaging. ICT, isovolumetric contraction time; IRT, isovolumetric relaxation time. (C) Peak velocity of systolic waves. (D) ICT; (E) time interval between the onset of QRS wave to the peak s’ wave. Boxes, IQR; central line, median; whiskers, 5th–95th percentiles. (C) *P<0.0001 vs. peak velocity of pulmonary s1’ wave and tricuspid S’ wave. (D,E) †P<0.0001 vs. tricuspid annulus.
Table 2. Inter- and Intraobserver Reproducibility
Parameters Interobserver variability Intraobserver variability
Circumferential strain
Peak strain of the anterior segment (%) −0.32±2.34 −0.35±1.87 Peak strain of the lateral segment (%) −0.33±2.21 −0.26±1.97 Peak strain of the inferior segment (%) 0.36±2.71 −0.30±1.27 Time to peak strain of the anterior segment (ms) 5.35±19.89 −4.25±16.31 Time to peak strain of the lateral segment (ms) −6.12±20.36 −4.77±17.78 Time to peak strain of the inferior segment (ms) −5.67±19.88 4.15±14.61
Longitudinal strain
Peak strain of the RVOT segment (%) −0.38±2.74 −0.35±2.25 Peak strain of the apical segment (%) −0.31±2.11 −0.30±1.89 Peak strain of the RVIT segment (%) 0.27±1.79 −0.29±1.89 Time to peak strain of the RVOT segment (ms) 6.35±20.18 −4.75±19.08 Time to peak strain of the apical segment (ms) −5.35±17.77 −4.05±17.11 Time to peak strain of the RVIT segment (ms) −5.98±19.19 3.97±16.01
Pulmonary annular motion
Peak velocity of s1’ (cm/s) −0.43±0.65 −0.40±0.58 Peak velocity of s2’ (cm/s) 0.07±0.31 −0.03±0.29 ICT (ms) 0.07±3.99 0.10±3.71 Time to peak S’ velocity (ms) −0.89±4.98 −0.90±4.73
Tricuspid annular motion
Peak velocity of s’ (cm/s) −0.35±0.96 −0.25±0.72 ICT (ms) −0.23±5.12 −0.16±4.01 Time to peak S’ velocity (ms) 1.09±8.69 −0.89±6.63 Data given as bias ±2 SD (i.e., 95% CI). ICT, isovolumetric contraction time; RVIT, right ventricular inflow tract; RVOT, right ventricular outflow tract.
assess the temporal sequential pattern of RV free wall cir-cumferential and longitudinal deformations using the com-bination of speckle tracking, TDI, and visual observation. Longitudinal RVOT deformation was found to occur before RVIT deformation, which seems to conflict with the theory of a peristalsis-like contraction pattern of the RV segments.8,17 This peristalsis theory, postulating that the
RVIT contracts before the RVOT, was originally derived from experimental animal data using sonomicrometry to assess RV motion. In several reports, a peristalsis-like pat-tern of RV contraction was not observed in the longitudi-nal direction, but it was observed in the transverse direction (RV cavity dimension), with contraction of the RVIT fol-lowed by contraction of the RVOT.7,18 The temporal
sequence of RV deformation with different imaging tech-niques provided conflicting data.4,7,8,17,18 In the present
study of circumferential strain, the anterior segment pre-ceded the lateral and inferior segments. Recently, Atsumi et al demonstrated, using 3-D speckle tracking imaging, that contraction timing of the apical anterior wall and of the septal wall was earlier than of other segments.19 The
mean frame rate in their study was 19.7±1.7 frames/s, which is considered to be low for obtaining accurate tem-poral sequences. Their 3-D strain imaging study, however, was compatible with the present results. Differences in regional deformation of the RV free wall may be due to structural reasons, such as fiber direction, or due to differ-ences in forces and geometry. Fiber orientation and electrical propagation are presumed to affect the regional differ-ence.20–23
Durrer et al investigated the time course and distribu-tion of the excitatory process of the normal human heart,24
and showed that RV endocardial activation starts near the insertion of the anterior papillary muscle, approximately 5–10 ms after the onset of the LV cavity potential. Then, rapid invasion of the septum and the adjoining RV free wall occurs, resulting in epicardial breakthrough in the area pretrabecularis after approximately 20 ms. This agrees with the present results for the temporal sequence of cir-cumferential strain. In contrast, the present results for longitudinal deformation conflict with the Durrer et al results. In the present study, pulmonary annular motion and RVOT longitudinal deformation occurred before tri-cuspid annular motion and RVIT longitudinal deforma-tion, whereas in the Durrer et al study the activation proceeded in a regular, more or less tangential way, reach-ing ultimately the pulmonary conus (at 60–70 ms) and the posterobasal area (at 60–70 ms).24 These differing results
might be explained by the RV anatomy and electrical propagation. The RV wall is mainly composed of superfi-cial and deep muscle layers.22,25 The fibers of the superficial
layer are arranged more or less circumferentially in a direc-tion parallel to the atrioventricular groove. The deep mus-cle fibers of the RV are longitudinally aligned base to apex.22,25 The myocardial segment closer to the anterior
papillary muscle of the RV free wall contracts earlier than the remainder of the RV. In the free wall of the outflow tract, the segment closer to the anterior papillary muscle contracts longitudinally at the beginning of the contrac-tions, and the segment nearer the pulmonary annulus might contract circumferentially at the end of the contrac-tion, according to the myocardial architecture and the excitatory process from the endocardial to the epicardial direction. As a result, the time to peak longitudinal strain of the RVOT is not compatible with the electrical propaga-TDI (Figure 4A). The tricuspid annular motion is
com-pared with the pulmonary annular velocity waveform in Figure 4B. The systolic wave was monomodal (s’) for the tricuspid annular velocity and bimodal (s1’ and s2’) for the pulmonary annular motion velocity. The shapes of the e’ and a’ waves in diastole were similar. There was no significant difference between the peak velocity of the pul-monary s1’ wave and the tricuspid s’ wave (11.9±2.6 and 12.9±2.8 cm/s), whereas the peak velocity of the pulmonary s2’ wave was significantly lower than that of the other 2 waves (4.1±1.1 cm/s; P<0.0001 for each; Figure 4C). The ICT measured at the pulmonary annulus was significantly lower than the ICT measured at the tricuspid annulus (49.4±10.1 and 58.0±13.2 ms; P<0.0001; Figure 4D). The time interval between the onset of the QRS wave and the peak systolic waveform was significantly lower on the pul-monary annular velocity curve than on the tricuspid annu-lar velocity curve (104.7±12.2 and 160.5±27.1 ms; P<0.0001; Figure 4E).
Reproducibility
On investigation of intraobserver and interobserver repro-ducibility with regard to myocardial deformation and TDI on Bland-Altman analysis of 20 randomly selected partici-pants (Table 2), minimal bias and substantial agreement for reproducibility were noted.
Discussion
The present study analyzed the temporal sequence of RV free wall contraction in healthy children. On speckle track-ing analysis of RV free wall circumferential deformation, the contraction of the anterior segment occurs before con-traction of the lateral and inferior segments. The presence of a time delay in RV longitudinal myocardial deformation between the RVOT and RVIT components in normal sub-jects was also demonstrated. Furthermore, in the analysis of TDI, the ICT and the time to peak s’ wave were signifi-cantly lower in pulmonary annular motion than in tricus-pid annular motion. Pulmonary and tricustricus-pid annular motion velocities themselves do not directly indicate RVOT and RVIT deformation. The fact, however, that pulmonary annular motion precedes tricuspid annular motion supports and coincides with the results on longitu-dinal deformation. RVOT deformation was seen to occur before RVIT deformation (Movie S2). A time delay of contraction between the anterior segment and the lateral and inferior segments was also seen in the slow-motion movie of circumferential deformation (Movie S1).
Two-dimensional speckle tracking strain imaging is a recently introduced echocardiographic imaging modality that permits angle-independent multidirectional assess-ment of myocardial deformation.12,13 Speckle tracking
echocardiography enables the assessment of the temporal occurrence of regional myocardial deformation.14,15 There
are some limitations, however, in speckle tracking strain imaging. Given that it uses a pattern-matching algorithm, errors in early frames can become amplified through sub-sequent frames.16 Thus, the acquisition of high-quality
echocardiographic images is essential, especially the first frame at end-diastole. Nevertheless, the speckle tracking strain analysis was compatible with TDI evaluation and visual observation. This indicates that the present temporal sequence of the RV free wall is accurate and reliable.
ments. It will be important to determine whether these time delays are reasonable and useful indicators of RV perfor-mance.
Conflict of Interest
The authors declare no conflict of interest.
References
1. Badagliacca R, Reali M, Poscia R, Pezzuto B, Papa S, Mezzapesa M, et al. Right intraventricular dyssynchrony in idiopathic, her-itable, and anorexigen-induced pulmonary arterial hypertension: Clinical impact and reversibility. JACC Cardiovasc Imaging 2015; 8: 642 – 652.
2. Kong D, Shu X, Dong L, Pan C, Cheng L, Yao H, et al. Right ventricular regional systolic function and dyssynchrony in patients with pulmonary hypertension evaluated by three-dimensional echocardiography. J Am Soc Echocardiogr 2013; 26: 649 – 656. 3. van der Hulst AE, Roest AA, Delgado V, Holman ER, de Roos
A, Blom NA, et al. Relationship between temporal sequence of right ventricular deformation and right ventricular performance in patients with corrected tetralogy of Fallot. Heart 2011; 97: 231 – 236.
4. Uebing A, Gibson DG, Babu-Narayan SV, Diller GP, Dimopoulos K, Goktekin O, et al. Right ventricular mechanics and QRS duration in patients with repaired tetralogy of Fallot: Implications of infundibular disease. Circulation 2007; 116: 1532 – 1539. 5. Sakaguchi H, Miyazaki A, Yamada O, Kagisaki K, Hoashi T,
Ichikawa H, et al. Cardiac resynchronization therapy for various systemic ventricular morphologies in patients with congenital heart disease. Circ J 2015; 79: 649 – 655.
6. Janousek J, Gebauer RA, Abdul-Khaliq H, Turner M, Kornyei L, Grollmuss O, et al. Cardiac resynchronisation therapy in paediatric and congenital heart disease: Differential effects in various anatomical and functional substrates. Heart 2009; 95: 1165 – 1171.
7. Matsui H, Satomi G, Yasukochi S, Kaneko S, Haseyama K. Evaluation of right ventricular contraction by myocardial strain in children using a two-dimensional tissue tracking method.
Pediatr Cardiol 2008; 29: 377 – 381.
8. Geva T, Powell AJ, Crawford EC, Chung T, Colan SD. Evaluation of regional differences in right ventricular systolic function by acoustic quantification echocardiography and cine magnetic resonance imaging. Circulation 1998; 98: 339 – 345.
9. Rudski LG, Lai WW, Afilalo J, Hua L, Handschumacher MD, Chandrasekaran K, et al. Guidelines for the echocardiographic assessment of the right heart in adults: A report from the American Society of Echocardiography endorsed by the European Association of Echocardiography, a registered branch of the European Society of Cardiology, and the Canadian Society of Echocardiography.
J Am Soc Echocardiogr 2010; 23: 685 – 713.
10. Hayabuchi Y, Sakata M, Kagami S. Right ventricular myocar-dial deformation patterns in children with congenital heart dis-ease associated with right ventricular pressure overload. Eur Heart
J Cardiovasc Imaging 2015; 16: 890 – 899.
11. Hayabuchi Y, Ono A, Kagami S. Pulmonary annular motion velocity assessed using Doppler tissue imaging: Novel echocar-diographic evaluation of right ventricular outflow tract function.
Circ J 2016; 80: 168 – 176.
12. Amundsen BH, Helle-Valle T, Edvardsen T, Torp H, Crosby J, Lyseggen E, et al. Noninvasive myocardial strain measurement by speckle tracking echocardiography: Validation against sono-micrometry and tagged magnetic resonance imaging. J Am Coll
Cardiol 2006; 47: 789 – 793.
13. Sugano A, Seo Y, Ishizu T, Watabe H, Yamamoto M, Machino-Ohtsuka T, et al. Value of 3-dimensional speckle tracking echo-cardiography in the prediction of microvascular obstruction and left ventricular remodeling in patients with ST-elevation myocar-dial infarction. Circ J 2017; 81: 353 – 360.
14. Delgado V, Ypenburg C, van Bommel RJ, Tops LF, Mollema SA, Marsan NA, et al. Assessment of left ventricular dyssyn-chrony by speckle tracking strain imaging comparison between longitudinal, circumferential, and radial strain in cardiac resyn-chronization therapy. J Am Coll Cardiol 2008; 51: 1944 – 1952. 15. Chan YH, Kuo CT, Wu LS, Wang CL, Yeh YH, Hsu LA, et al.
Combined global longitudinal strain and intraventricular same mechanism.
The presence of mechanical and timing heterogeneity in the structurally and functionally normal RV has important clinical implications for future treatment of RV dysfunc-tion, in particular with CRT. Importantly, the concept that mechanical time heterogeneity is important for RV con-traction is in contrast to reported data on LV performance, in which LV dyssynchronous contraction leads to LV systolic dysfunction. In the case of LV failure, CRT improves LV function by restoring the synchronous LV contraction pattern.26 Based on the present study, however,
in which a mechanical time delay was identified in longitu-dinal and circumferential deformations of the healthy RV, these assumptions may not be applicable to RV motion patterns. The effects of CRT have been evaluated in patients with surgically corrected tetralogy of Fallot and RV dysfunction.27,28 A better understanding of the RV
mechanical activation patterns and the presence of a phys-iological RV deformation time delay, however, may be essential to maximizing the benefits of CRT. A schematic diagram of the RV free wall deformation sequence and annular motion is shown in Movie S3. The anterior segment of the RV free wall deformation occurs first, and pulmonary annular motion and RV longitudinal contraction are pro-duced. Tricuspid annular motion follows and continues until end-systole. This mechanism is similar to that of the Japanese traditional water gun. Although pulmonary annular and RVOT deformations are seen in early systole, contraction of the anterior segment is essential. Pulmonary annular longitudinal contraction and subsequent tricuspid annular motion are important, and the time gap is suitable for RV ejection (Movie S3, second half). The presence of a mechanical timing delay might be an important factor for effective RV performance.
Study Limitations
This study covered a small number of participants in a prospective single-center study. Echocardiography was obtained from the subcostal and subxiphoid approaches. It should be noted that this image can be obtained only in children, not in adults. Therefore, further studies of larger populations, including adults and patients with RV failure, are necessary to determine the RV free wall deformation pattern. Second, although the heart deforms in 3-D space, 2-D speckle tracking echocardiographic data were used. In current 3-D tissue tracking imaging, however, the frame rate is presumed to be too low for acquisition of an accu-rate deformation pattern. Therefore, RV free wall defor-mation was assessed in circumferential and longitudinal directions. In the future, it will be useful to develop 3-D-speckle tracking echocardiography equipment with a higher frame rate. Next, although the annular motions are presumed to reflect RV regional performance, the adjacent structures, including LV contraction, the pulmonary arte-rial wall, and right atarte-rial condition, also affect TDI evalu-ation. Further studies are needed to determine the utility of pulmonary annular and tricuspid annular motions for the determination of RV time sequence and dyssynchrony.
Conclusions
Mechanical time heterogeneity is present in the normal RV. Longitudinal deformation of the RVOT precedes that
28. Dubin AM, Feinstein JA, Reddy VM, Hanley FL, Van Hare GF, Rosenthal DN. Electrical resynchronization: A novel ther-apy for the failing right ventricle. Circulation 2003; 107: 2287 – 2289.
Supplementary Files
Supplementary File 1
Movie S1. Right ventricular circumferential strain pattern in slow motion. The replay speed is one-tenth of the original record. On visual observation the motion and contraction are earlier for the anterior segment than for the lateral and posterior segments. Tracking points are selected in the first frame of a 2-D echocar-diographic image. The movement of the tracking points can be visualized on the screen during analysis, and the trace of the points can be confirmed.
Supplementary File 2
Movie S2. Right ventricular (RV) longitudinal strain pattern in slow motion. The replay speed is one-tenth of the original record. On visual observation the movement and deformation are earlier for the RV outflow tract than for the apical and RV inflow tract segments. LVOT, left ventricular outflow tract.
Supplementary File 3
Movie S3. Schematic diagram of the right ventricular (RV) free wall deformation sequence and the pulmonary and tricuspid annular motion. The anterior segment of RV free wall deforma-tion occurs first, and pulmonary annular modeforma-tion and RV longi-tudinal contraction are produced. Tricuspid annular motion follows and continues until end-systole. The mechanics of RV contraction are similar to those of the Japanese traditional water gun. Although pulmonary annular and RV outflow tract defor-mations are seen in early systole, the contraction of the anterior segment of the RV free wall is essential and induces them. Pulmonary annular motion followed by subsequent tricuspid annular motion is a reasonable mechanism. The time gap is appropriate for RV ejection. The presence of a mechanical tim-ing delay might be an important factor for effective RV perfor-mance.
Please find supplementary file(s); http://dx.doi.org/10.1253/circj.CJ-17-0273 mechanical dyssynchrony predicts long-term outcome in patients
with systolic heart failure. Circ J 2016; 80: 177 – 185.
16. Toyoda T, Baba H, Akasaka T, Akiyama M, Neishi Y, Tomita J, et al. Assessment of regional myocardial strain by a novel automated tracking system from digital image files. J Am Soc
Echocardiogr 2004; 17: 1234 – 1238.
17. Meier GD, Bove AA, Santamore WP, Lynch PR. Contractile function in canine right ventricle. Am J Physiol 1980; 239: H794 – H804.
18. Santamore WP, Meier GD, Bove AA. Effects of hemodynamic alterations on wall motion in the canine right ventricle. Am J
Physiol 1979; 236: H254 – H262.
19. Atsumi A, Ishizu T, Kameda Y, Yamamoto M, Harimura Y, Machino-Ohtsuka T, et al. Application of 3-dimensional speckle tracking imaging to the assessment of right ventricular regional deformation. Circ J 2013; 77: 1760 – 1768.
20. Buckberg GD; RESTORE Group. The ventricular septum: The lion of right ventricular function, and its impact on right ventricu-lar restoration. Eur J Cardiothorac Surg 2006; 29: S272 – S278. 21. Anderson RH, Ho SY, Redmann K, Sanchez-Quintana D,
Lunkenheimer PP. The anatomical arrangement of the myocar-dial cells making up the ventricular mass. Eur J Cardiothorac
Surg 2005; 28: 517 – 525.
22. Ho SY, Nihoyannopoulos P. Anatomy, echocardiography, and normal right ventricular dimensions. Heart 2006; 92: i2 – i13. 23. Hristov N, Liakopoulos OJ, Buckberg GD, Trummer G. Septal
structure and function relationships parallel the left ventricular free wall ascending and descending segments of the helical heart.
Eur J Cardiothorac Surg 2006; 29: S115 – S125.
24. Durrer D, van Dam RT, Freud GE, Janse MJ, Meijler FL, Arzbaecher RC. Total excitation of the isolated human heart.
Circulation 1970; 41: 899 – 912.
25. Haddad F, Hunt SA, Rosenthal DN, Murphy DJ. Right ven-tricular function in cardiovascular disease, part I: Anatomy, physiology, aging, and functional assessment of the right ven-tricle. Circulation 2008; 117: 1436 – 1448.
26. Leclercq C, Kass DA. Retiming the failing heart: Principles and current clinical status of cardiac resynchronization. J Am Coll
Cardiol 2002; 39: 194 – 201.
27. Bordachar P, Iriart X, Chabaneix J, Sacher F, Lafitte S, Jais P, et al. Presence of ventricular dyssynchrony and haemodynamic impact of right ventricular pacing in adults with repaired tetral-ogy of Fallot and right bundle branch block. Europace 2008; 10: 967 – 971.