日本企業における特許出願が生存率に与える 効果の実証分析
~オープンイノベーション時代の創造的破壊に関する一考察~
2017 年 3 月
文部科学省 科学技術・学術政策研究所 第1研究グループ
池内健太 元橋一之
本DISCUSSION PAPERは、所内での討論に用いるとともに、関係の方々からの御意見を頂く ことを目的に作成したものである。
また、本DISCUSSION PAPERの内容は、執筆者の見解に基づいてまとめられたものであり、
必ずしも機関の公式の見解を示すものではないことに留意されたい。
【執筆者】
池内健太 独立行政法人経済産業研究所 研究員
文部科学省科学技術・学術政策研究所 客員研究官
元橋一之 東京大学大学院工学系研究科 教授
文部科学省科学技術・学術政策研究所 客員研究官 独立行政法人経済産業研究所 ファカルティ・フェロー
【 】
本報告書の引用を行う際には、以下を参考に出典を明記願います。
池内健太・元橋一之(2017) 「日本企業における特許出願が生存率に与える効果の実証分析~
オープンイノベーション時代の創造的破壊に関する一考察~」,NISTEP DISCUSSION PAPER,
No.143,文部科学省科学技術・学術政策研究所.
日本企業における特許出願が生存率に与える効果の実証分析~オープンイノベーション 時代の創造的破壊に関する一考察~
文部科学省 科学技術・学術政策研究所 第1研究グループ 要旨
本稿では、日本企業に関する経済センサスとIIPパテントデータベースを接続したデータセッ トに基づき、特許出願をイノベーションの指標として活用し、若い企業のイノベーションと生 存率の間の関係性を分析する。発明における外部連携と連携相手のタイプのようなイノベーシ ョン活動の組織に関する指標を構築し、イノベーション活動に対する2つの競合する要因、す なわち技術能力(企業の生存率に対して正の影響)と商業化のリスク(企業の生存率に対して 負の影響)の効果を区別して分析する。本研究では、イノベーションが企業の生存率に与える 正の影響は一般的に負の影響を上回り、この傾向は出願された特許がより大きな潜在的な市場 価値を持つ場合に強くなることがわかった。加えて、大学との連携がある企業の生存率は高く、
その一方で他企業との連携が生存率に与える効果は企業規模に依存することがわかった。この 結果から、連携の利益を獲得するには、オープンイノベーションの複雑性を乗り越えるための 一定規模の経営資源が必要であることが示唆される。
First Theory Oriented Research Group, National Institute of Science and Technology Policy (NISTEP), MEXT
ABSTRACT
This paper uses patent filing as an indicator of innovation and investigates the relationship between innovation and the survival of young firms, based on a dataset linking the Economic Census and IIP Patent Database for Japanese firms. We have constructed indicators showing the organization of innovative activities, such as external collaboration on inventions and the type of collaborative partners, and disentangled two competing factors on innovative activities, i.e. technological capability (positive influencing firm survival) and commercial risk (negative influencing firm survival). We have found that positive impacts surpass negative ones in general, and this tendency strengthens when patents have relatively greater potential market value. In addition, collaboration with universities always leads to higher probability of survival, while the impact of collaboration with other firms depends on firm size, that is, a certain level of managerial resources to overcome the complexity involved in open innovation is required to achieve gains from collaboration.
本DISCUSSION PAPERは、文部科学省科学技術・学術政策研究所(NISTEP)と独立行政法人経
済産業研究所(RIETI)との共同研究プロジェクトの成果の一部である。
概要
i
1.
はじめに
生産性の上昇や経済成長にとって、新しい企業の参入が引き起こす創造的破壊によるイ ノベーションの重要性は認識されている。そのため、企業家活動の促進は日本を含む世界 各国で重要な政策課題の一つとなっている。日本においても、アベノミクスの政策目標の 一つとして参入率の倍増が掲げられている。一方、そのような企業の誕生から時間を通じ て、その経済成長への寄与については、先行研究では充分に明らかになっていない。理論 的には、若い企業は生存率が低いが、企業の技術的な能力はその企業の生存率を高める重 要な要因であると考えられている(Jovanovic 1982; Ericson and Pakes 1995)。実証研究では、
イノベーションと企業の存続の関係については、研究開発費やイノベーション調査のイノ ベーションの成果を用いた研究で正の関係性が見られているが、比較的最近の特許データ を用いた研究では負の関係性を示すものもある(Buddlemeyer et al. 2010; Boyer and Blazy 2014)。ただし、これら先行研究の結果は、「生存バイアス」の影響を受けている可能性が 指摘されている(Hyytinen et al. 2015)。
先行研究では初期時点以降に出願・登録された特許の情報も含めて、特許が生存率に与 える効果を分析している(図 1のAP1とSV01の関係)。しかしながら、特許の出願や登録 は企業が生存していることが必要条件であるため、初期時点以降に出願・登録された特許 を含めてしまうと、特許が生存率に与える効果を過大に推定することになってしまう。こ の問題を「生存バイアス」という。したがって、本研究においては、企業の存在が最後に 確認された時点までの特許出願の情報(AP0)を用いることで、生存バイアスの問題を回避 する。
本研究では、経済センサスと特許データベースを企業レベルで接続したデータセットを 用いて、比較的若い新規開業企業の生存と特許の関係性を実証的に分析する。本研究の特 徴は主に2つ挙げられる。まず第1に、「事業所・企業統計調査」及び「経済センサス」と いった日本の企業全体の母集団情報を用いて、特許出願が企業の生存率に与える効果を分 析していることである。母集団情報を用いることの利点は、サンプル・セレクション・バ イアスの影響を受けないことである。その上で、前述のとおり、生存バイアスの影響を取 り除くため、企業の生存の有無を判定する期間の前までに出願された特許と生存率との関 係性を統計的に分析する。加えて、出願された特許が早期(例えば 1 年)に登録されたか どうかを区別することにより、特許の質が生存率に与える効果も分析する。
第 2 に、特許の共同出願の情報を用いて、イノベーション活動における外部組織との連 携の効果についても詳細に分析していることである。近年のオープンイノベーションの時 代には、多くの企業が他の企業との連携で研究開発活動を実施するようになっていること が知られている(Chesbrough 2003)。イノベーション活動における外部連携は特許の発明と 生存の間の関係性に影響があると考えられる。例えば、他企業との連携は商業化のリスク
ii
と金融的なリスクを低減することによって、生存に正の効果があると考えられる。しかし 同時に、イノベーション活動のマネジメントの複雑性を増大させ、生存にはマイナスの効 果もあると考えられる(Rosenbusch et al. 2011)。これらイノベーション活動に於ける外部連 携の2つの相反する効果のトレードオフを分析する。
図 1:分析のフレームワーク
2.
分析に用いたデータ
本研究では2001年及び2006年の「事業所・企業統計調査」(総務省)及び2012年の「経 済センサス(活動調査)」(総務省)の企業レベルの個票データを特許の出願人に接続した データセットを用いて分析する。本研究では特に、若い企業に注目し、2001年時点及び2006 年時点で設立後5年以内の企業を対象とし、それぞれ 2006年時点及び2012年時点での生 存の有無の状況を分析した。約500 万社の全企業のうち、分析に用いた設立後 5 年以内の 若い企業は2001年時点で約80万社、2006年時点では約66万社である。
「事業所・企業統計調査」及び「経済センサス」は、農林漁業の個人事業など一部を除 く、日本のほぼ全ての事業所を対象とする総務省の基幹統計調査である。調査対象は事業 所であるが、企業レベルに名寄せすることが可能であり、事業所単位では時系列の接続が 可能である。事業所単位の接続情報を用いて、企業レベルでのパネルデータを構築するこ とにより、企業の存続・退出を識別した。また、事業所レベルでの接続情報を利用するこ とによって、企業の退出を、企業の全ての事業所が消滅した場合(dissolution)と一部また
T0~T1の生存有無 [SV01]
T0~T1の特許出願 [AP01]
調査年 T0
T0以前の特許出願 [AP0]
出願(T0以前)からX年の 特許登録 [AP0_GR_X_YR]
特許出願効果
特許の質の効果
T1以前の特許出願 [AP1=AP0+AP01]
調査年 T1
他企業との共同出願 [d.firm0]
5年間
大学との共同出願 [d.univ0]
…2つの効果を識別できない
外部連携の効果
(オープンイノベーション)
iii
は全ての事業所が他企業に吸収された場合(acquired)を区別することができる。本研究で は、他企業に吸収される場合の退出は主な分析から除き、企業が消滅しなかった場合を企 業の「生存」として分析を行う。
特許データとしては、「IIPパテントデータベース」(知的財産研究所)を用いた。「IIPパ テントデータベース」は日本の特許庁が1 か月に 2 回の頻度で公開している「整理標準化 データ」をもとに構築されたデータベースである(Goto and Motohashi 2007)。「IIPパテント データベース」には、特許ごとの出願番号や登録番号、出願日や登録日、出願人の名称と 住所、発明者の名称と住所、引用情報などの情報が収録されている。本研究では、1964 年 1月から2014年3月までの情報が収録されている最新版の「IIPパテントデータベース」(2015 年版)を用いた。特許データの出願人の名称及び住所情報と「事業所・企業統計調査」及 び「経済センサス」の名簿に収録されている各企業の企業名及び事業所の住所情報を用い て、両データを接続した。詳細はIkeuchi et al. (2016)を参照されたい。
3.
分析結果
特許出願が企業の生存率に与える効果の分析結果は図 2 に示されている。生存バイアス を含む効果では、特許出願によって生存率は3.3%上昇するが、生存バイアスを除去すると、
その効果は1.2%に低下することがわかる。ただし、生存バイアスを除いても、特許出願は 企業の生存率に対して統計的に有意な正の効果を持っている。
図 2:特許出願が企業の生存率に与える効果の期待値(1):生存バイアスの有無別
次に、出願された特許の質の効果を分析するために、出願から 1 年以内に登録(grant) された特許とそうでない特許の出願の効果を区別した分析結果は図 3 に示されている。出 願から 1 年以内に登録された特許を出願している企業の生存率は特許出願のない企業と比 べておよそ8%高いのに対し、1年以内に登録のない特許を出願した企業の生存率と特許出 願のない企業の生存率の差は極めて小さいことがわかる。
0.0%
+3.3%
0.0%
+1.2%
0.0%
+0.5%
+1.0%
+1.5%
+2.0%
+2.5%
+3.0%
+3.5%
+4.0%
特許出願なし
(ベース)
特許出願あり 特許出願なし
(ベース)
特許出願あり 生存バイアス含む 生存バイアス含まない
iv
図 3:特許出願が企業の生存率に与える効果の期待値(2):出願から1年の登録の有無別
(生存バイアスなし)
次に、他企業及び大学との共同出願された特許の有無が企業の生存率に与える効果の分 析結果は図 4 に示されている。サンプル企業全体でみると、共同出願がない場合と比較し て、他企業との共同出願がある企業は約1%生存率が高く、大学との共同出願がある企業は
約5%生存率が高いことがわかる。また、他企業や大学との共同出願が生存率に与える効果
は、企業規模が大きい程、強くなることがわかる。例えば、従業者数が50人未満の比較的 小規模な企業では他企業や大学との特許の共同出願があっても生存率はほとんど変わらな い(統計的に有意な差は見られない)。一方、従業者規模が 50 人以上の比較的大規模な企 業では大学との共同出願がある場合にはそうでない場合と比較して生存率が 20%高く、他 企業との共同出願がある場合にはそうでない場合と比較して生存率が約 6%高いことがわ かった。
図 4:他企業及び大学との特許の共同出願が企業の生存率に与える効果の期待値
(生存バイアスなし)
0.0% +0.7%
+7.9%
0.0%
+2.0%
+4.0%
+6.0%
+8.0%
+10.0%
なし あり
特許出願なし(ベース) 出願から1年以内の登録有無
+1.1% +0.3%
+6.4%
+5.3%
-1.1%
+20.0%
-5%
0%
+5%
+10%
+15%
+20%
+25%
全体 1-49人 50人以上
企業規模 他企業との共同出願あり
大学との共同出願あり
v
4.
結論と含意
本研究では、設立から 5 年以内の比較的若い企業に注目し、経済センサスと特許データ を出願人・企業レベルで接続したデータセットを用いて、日本の新規開業企業における特 許出願と生存率の関係性を分析した。主な分析結果は次のとおりである。
(1) 特許出願をしている企業は特許出願のない企業と比べて生存率が高く、特に出願から 早期に登録された特許出願がある場合に生存率が顕著に高くなる。
(2) 大学との特許共同出願があると企業の生存率が高くなる。
(3) 規模の大きい企業ほど、他企業や大学との共同出願があると生存率が高くなる。
これらの結果は、イノベーションに積極的なハイテク・スタートアップ企業の参入を促 進することが政策目標として妥当であることを示唆している。しかしながら、本研究の分 析結果によれば、小規模な企業では大学や他企業との連携は生存率との関係はほとんど見 られず、オープンイノベーションは常にポジティブな影響につながる訳ではないことに注 意が必要である。本研究の分析結果は、比較的規模の大きい企業のイノベーション活動に おける企業間の連携及び産学連携を促進する政策の妥当性を示すとともに、小規模企業の 他企業や大学との外部連携の効果を高めるような政策の必要性を示唆していると考えられ る。
参考文献
Boyer, T., and R. Blazy (2014). Born to be Alive? The Survival of Innovative and Non-innovative French Micro-startups, Small Business Economics 42(4): 669-683.
Buddelmeyer, H., P. Jensen and E. Wesbster (2010). Innovation and the Determinants of Company Survival, Oxford Economic Papers 62(2): 261-285.
Chesbrough, H. (2003). Open Innovation: The New Imperative for Creating and Profiting from Innovation. Harvard Business School Press: Cambridge, MA.
Ericson, R., and A. Pakes (1995). Markov-Perfect Industry Dynamics: A Framework for Empirical Work, Review of Economic Studies 62(1): 53-82.
Goto A. and K. Motohashi (2007). Construction of a Japanese Patent Database and a first look at Japanese patenting activities, Research Policy 36(9): 1431-1442.
Hyytinen, A., M. Pajarinen and P. Rouvinen (2015). Does Innovativeness Reduce Startup Survival Rates? Journal of Business Venturing 30(4): 564-581.
Ikeuchi, K., K. Motohashi, R. Tamura and N. Tsukada (2016). Science intensity of industry by using linked dataset of science, technology and industry, mimeo.
vi
Jovanovic, B. (1982). Selection and the Evolution of Industry, Econometrica 50(3): 649-670.
Rosenbusch, N., J. Brinckmann and A. Bausch (2011). Is Innovation Always Beneficial? A Meta-Analysis of the Relationship between Innovation and Performance in SMEs, Journal of Business Venturing 26(4): 441-457.
本文(英語)
1
1. Introduction
Productivity increase is an important factor for economic growth in developed nations. It has been found that 20%-40% of productivity in the OECD countries is attributable to new high-growth startups (OECD, 2003). The importance of entrepreneurship for economic growth is stressed by Schumpeter, who defines
“innovation” as the new combination of five types of activities, including new product development and new process adaption (Schumpeter, 1934). Schumpeter also argues that “creative destruction” is an essential element of capitalism (Schumpeter, 1942).
The concept of creative destruction, in which firms that successfully innovate increase market share while firms whose productivity is low withdraw from the market, has made a significant contribution to discussions about economic expansion for long time (Baumol, 2010).
Along this line, the view that small and medium-sized enterprises (SMEs) are a source of innovation is shared in every country around the world. However, empirical research on firm dynamics and its contribution to economic development shows mixed results. First, research has found that the survival rate of new firms is low. According to Bartelsman et al.. (2005), in a study of 10 OECD countries, 20%-40% of new companies disappear within two years after establishment. Furthermore, it is also understood that there is a positive correlation between entry and exit of firms that occurs in conjunction with macroeconomic fluctuations (Bartelsman et al.., 2005). As a result of the churning effect resulting from market fluctuations, generation and dissolution of small inefficient firms that have not reached a sufficient scale occurs simultaneously. This phenomenon can be viewed as firms simply moving through a revolving door (Santarelli and Vivarelli, 2010).
A theoretical model of firm exit or survival is based on new and existing players in the market, taking into account heterogeneous firm capabilities. A passive learning model explains the industrial dynamics of the process through which a firm learns its own initially endowed capabilities, which it was not aware of at the time of entry (Jovanovic, 1982). By contrast, there is also an active learning model which holds that firm capability is not only determined by its initial endowment, but also subsequent investments (Ericson and Pakes, 1995). In both models, young firms are more likely to exit the market, but they suggest that firm technological capability is an important predictor of survival and growth.
Empirically, a large number of studies point to a positive relationship between a firm’s survival and its innovation and patents. Different studies have posited a variety of indicators reflecting innovation, such as R&D expenditures (Esterve-Perez and Manez-Castillejo, 2008), patents (Cockburn and Wager, 2007; Helmers and Rogers,
2
2010) and successful innovation output as collected in Community Innovation Survey data (Cefis and Marsili, 2005; Cefis and Marsili, 2006), but all of these studies show a positive impact from innovation on survival. However, recent studies have revealed that this positive relationship is context based, and this relationship turns into negative in some cases (Hyytinen et al., 2015). For example Buddlemeyer et al. (2010) shows that patent stock (a reflection of technological capability) is positively related to firm survival, but patent application has a negative influence due to the higher risks associated with new technology development. Boyer and Blazy (2014) also show a negative relationship, particularly for young firms, since market application challenges presented by new technology are riskier for young inexperienced firms. Hyytinen et al.
(2015) argue that the results of past studies are largely affected by a survival bias (survival for innovation, instead of innovation for survival), and find that the positive relationship between innovation and survival turns negative once statistical controls are adopted to eliminate such bias.
In this paper, we empirically investigate the relationship between patents and the survival of young firms by using datasets linking the Japanese economic census and patent database. First, we carefully controlled for selection bias. Because our empirical results are based on census data, which covers entire population of firms located in Japan, we are able to provide sound evidence for the relationship between innovation and survival without fear of selection bias. In addition, we also control for possible survivorship bias of ideas (Hyytinen et al., 2015). That is, if output measures for innovation such as new products are used, commercial success of innovation may be achieved because a firm can survive longer (survival for innovation, instead of innovation for survival). We use patent application as a proxy for firms’ innovation activities, while controlling for patent quality by using the timing when patents are granted.
The second contribution of our study is to look in detail at the organization of innovation activities, i.e., whether firms engage in innovation by themselves or do they collaborate with other firms or universities. We do this by measuring joint patent applications. In the era of open innovation, more and more firms collaborate with other firms to facilitate R&D (Chesbrough, 2003). Collaboration in innovation activities affects the relationship between patents and firm survival in two different ways.
Collaborating with other firms may mitigate the commercial and financial risks associated with innovation (positive impact on firm survival). At the same time, collaborating with other firms may increase the complexity of innovation management, which has a negative impact on survival (Rosenbusch et al., 2010). We investigate this tradeoff with respect to open innovation. In addition, since we are able to identify in our datasets the manner in which firms exit, i.e. whether the exit is due to acquisition
3
by another firm or firm dissolution, we exclude instances of exits due to M&A, which may cause potential bias on account of the positive association with joint patent application.
This paper is structured as follows. First, we introduce theoretical aspects of industrial dynamics and empirical literature to explain the relationship between firm innovation and survival. In addition, hypotheses are offered of the relationship between patents and firm survival according to the way in which innovation is organized. Then, we follow with a description on the dataset for this study, which comprises the Enterprise and Establishment Census data and the JPO patent database. Next, we show the results of a quantitative analysis to test the hypotheses developed in the section 2.
Finally, we summarize our findings and provide a discussion and policy implications.
2. Theory and Hypotheses
The theoretical models of firm exit or survival are based on competition between new and existing players in the market, taking into account firms’ heterogeneous capabilities. The passive learning model explains the industrial dynamics of the process through which a firm learns its own initially endowed capabilities, which it was not aware of at the time of entry (Jovanovic, 1982). In accordance with the Bayesian inference of past market experience, a firm has to make a decision during each period on whether to continue or exit based on a belief on its capability. When a firm overestimates its capability, it may overinvest to grow faster, but this increases the probability of failure and market exit. Therefore, the rate of exit decreases along with a firm’s age as it learns the level of its own capabilities through market experience over time.
The active learning model, instead, takes into account the fact that firms’
capabilities are not only determined by their initial endowment, but subsequent investments (Ericson and Pakes, 1995). Here as well, in every period, a firm has to make a decision whether to continue or exit, but it also decides on the level of investment when it decides to continue to operate. In this model, there are two state variables, the level of competency (positively correlated with firm outcome) and the number of firms with the same level of competency (negative correlated with firm outcome). The Markov process is assumed in dynamics, in the sense that a firm’s perception of own and its competitors’ states is based only on the previous period. The level of investment for next period is determined by dynamic optimization to maximize firm value with an exit option. An exit option is executed when the value of firm becomes less than an opportunity cost of staying in the market (outside value of the firm). There are also entrants to this market, when the expected value of entry exceeds the fixed cost of entry.
4
The pattern of industry dynamics, referring to entry, continuation and exit, appears quite different in the passive learning and active learning models. In the former, firm growth patterns are described as the path that firms take to reach a certain scale, depending upon their endowed capacity (larger endowment leads to larger size) amid continuous entry and exit flux, particularly among young firms which do not precisely know their capabilities. In terms of the relationship between innovation and survival, the passive learning model assumes that firms gradually learns their capabilities, so that their survival rate increases over time, and firm capability levels and survival rates are generally positively correlated. In contrast, the active learning model illustrates a more dynamic picture with continuous changes in firms’ relative positions and firm may exit regardless of their age. Technological capability is attained through investment, but the survival rate of firms depends also on market environment, so that risky investments in technology may turn out to be unfavorable in some cases.
The reality is, of course, in between these two. Firm level analyses of productivity studies show the ranking order of productivity is persistent over time (Baily et al., 1992; Bartelsman and Doms, 2000), and exit is likely to occur more among younger firms (Bartelsman et al., 2005). However, a firm’s growth cannot be solely determined by its initial endowment, but also is serially correlated to efforts to improve capabilities over the long term. The assumption of Markov process in Ericson and Pakes (2005) is too strong, the impact of investment stays over time does not disappear instantly after the subsequent investment. But it does not stay over firm’s entire life, suggested by the theory in Javanovic (1982), either.
Empirically, the relationship between innovation and survival is positive in many studies. Esteve-Perez and Manez-Castillejo (2008) and Orgega-Argiles and Moreno (2007), which use R&D as an index for technological capability, show a positive relationship between R&D and company survival, which has especially been seen in the hi-tech industry. Moreover, Cockburn and Wagner (2007) and Helmers and Rogers (2010) use patents as an indicator of innovation, and both studies found a positive relationship. Cefis and Marsili (2005), which was based on Dutch Community Innovation Survey data, found that successful innovation by firms leads to a higher survival rate, particularly in the case of process innovation.
However, recent studies have made revealed that this positive relationship is context based, and this relationship turns into negative in some cases (Hyytinen et al., 2015). For example, Buddelmeyer et al. (2010) analyzes the impact of patent application and patent stock separately, and finds a negative impact from recent patent applications on firm survival, after controlling for the impact of patent stock (with its positive relationship with firm survival). They argue that the uncertainly involved in radical innovations surpasses the capability effect implied by patenting. A negative
5
relationship between patents and firm survival has also been found by Motohashi (2016) and Pederzoli et al. (2011). Since a patent should involve any technological contents new to the world is developed, its applicant firm is supposed to conduct substantial “exploration” activities, rather than “exploitation” activities, which does involve technological and/or commercial risks (March, 1991). Therefore such risky investments may lead to less survival rate for firms with patenting activities.
Broadly speaking, there are two types of uncertainty associated with innovation:
technological risk and commercial risk. Technological risk is found in research and development as such activities do not always lead to a successful conclusion. When a firm reaches the point of filing for a patent, it has overcome such technological risk, but commercial risk is still present in that not all patents result in commercial successes. Therefore, the findings in Buddelmeyer et al. (2010), Motohashi (2016) and Pedezoli et al. (2011) may be explained mainly due to the substantial commercial risk entailed in patented technologies. However, firms filing more patents are also more likely to have superior technological capabilities. This is particularly true in cases where a firm’s patents has a high commercial value. It has been found that a patenting entrepreneur is more likely to receive venture capital financing. Patenting may have a signaling effect to potential investors that also improve the firm’s survival rate (Haeussler et al., 2009). A positive relationship between patenting and survival has also been found in empirical literature (Helmers and Rogers, 2010). Therefore, out hypotheses on the relationship between patenting and firm survival are:
H1: The impact of patenting on a firm’s survival is determined by balancing the level of uncertainty in innovation (negative) and technological capability (positive).
H1a: When a firm has strong technological capabilities, patent filing is likely to have a positive impact on the firm’s survival.
H1b: When a firm files a patent which is sufficiently valuable in the market, a positive impact from the patent filing on firm survival is more likely, since commercial risk is relatively smaller.
Moreover, open innovation, which is external collaboration with other firms on R&D, may mitigate the risk associated with innovation, since both technological and commercial risks can be share with the partner. Zheng et al. (2010) explains two types of benefits from inter-firm networks for entrepreneurs: (1) transferred benefit and (2) perceived benefit. A higher failure rate for young firms can be explained by the fact that they have yet to fully develop a routine and policy for managing business uncertainty. Transferred benefit refers to the “pipe” through which partners transfer information and knowledge to overcome uncertainty. In addition, there is a perceived
6
benefit from inter-firm network, which works as a “prism” signaling the quality of firms’ management of partner relationships (Zheng et al., 2010).
However, R&D collaboration induces more complexity into innovation management such that the rate of success tend to decrease (Rosenbusch et al., 2010).
Bederbos et al. (2010) shows the negative relationship between the degree of co-patenting and firm value. They argued that potential R&D collaboration disadvantages, such as coordination costs and reduced potential future revenue due to co-ownership of technology, may surpass potential benefits, such as access to new technologies and lower technology commercialization risk. This is particularly true in cases where a firm is young, has limited management resources and less experience managing alliances. Therefore, our hypotheses about R&D collaboration and firm survival are:
H2: The impact of open innovation on firm survival is determined by the balance between positive factors, such as risk sharing and transferred benefit, and negative factors, such as management complexity and coordination cost.
H2a: Positive factors surpass negative factors when firm size is larger, since management complexity can be overcome with more resources.
H2b: Positive factors surpass negative factors when a firm’s capability for technological development is greater, since the firm’s absorptive capacity allows it to capture more transferred benefits from its partner.
3. Dataset and descriptive statistics
In order to conduct an empirical analysis of patenting and firm survival, we have constructed the dataset linking Japan’s Statistics Bureau’s Enterprise and Establishment Census and the IIP Patent Database, complied by using the JPO’s patent information.
The Enterprise and Establishment Census encompasses all business establishments in Japan. Along with providing basic statistical data such as the number of establishments and employees, it is also used as the survey body information set for the other governmental statistical surveys. This survey is conducted twice every five years, and was known as the Establishment Census until July 1991. With the October 1996 survey, the name was changed to the Enterprise and Established Census. Also, since the October 1996, the addition of “head office address” as a survey item allows for grouping of business establishments by company name and address. The Enterprise and Establishment Census was conducted every 5 years (and one preliminary survey
7
in-between 5 year period) until 2006, when the Japanese government decided to use the “The Economic Census,” which is based on the concept of firm level identification of economy activities instead of establishment level, for the next round. In 2009, a similar preliminary survey was conducted, which was called the “Preliminary Economic Census Survey,” after which the first Economic Census was conducted in 2012.
The IIP Patent Database is compiled based on Consolidated Standardized Data, which is made public twice a month by the Japan Patent Office. The Consolidated Standardized Data includes patent information recorded as a text file with SGML and XML tags. In this study, we use the IIP Patent Database in which the text files released by the JPO are converted to an SQL database to allow easier statistical processing of the data. As of December 2016, this included information made public from January 1964 until March 2014, which was able to be downloaded on the Institution of Intellectual Property (IIP) website (http://www.iip.or.jp). The IIP patent filings, publicly released data in CSV-format, includes patent application data (application number, application date, examination request date, technological field, number of claims, etc.); patent registration data (registration number, rights expiration date, etc.);
applicant data (applicant name, applicant type, country/prefecture code, etc.); rights holder data (rights holder name, etc.); citation information (citation/cited patent number, etc.); and inventor data (inventor name, address) (Goto and Motohashi, 2007).
Linkage between the Enterprise and Establishment Census and IIP Patent Database used identical company names (standardized one) and locations1. In this study, because firm level establishment identification was not complete in the surveys before 2001, we use two Enterprise and Establishment Census surveys, one from 2001 and one from 2006, as well as the Economic Census from 2012. The number of all firms in this dataset is 5,336,971 in 2001, 4,897,132 in 2006, and 4,608,794 in 2012, and the number of firms with patent applications is 84,035 (1.57%) in 2001, 82,471 (1.68%) in 2006, and 72,648 (1.58%) in 2012.
Since the Economic Census provides longitudinal information at the establishment level instead of the firm level, we have to construct firm dynamics, i.e., entry, exit and continuation, between survey periods. At the establishment level, longitudinal linkage information between two periods is available, and firm level information identifying each establishment (for firms with multiple establishments) is also available in each survey. We utilize the following rules to identify the same firm in
1 A detailed description of the linkage of census and patent data can be found in Ikeuchi et al.
(2017).
8
two successive surveys: (1) if all establishments belonging to one firm in a survey can be connected to all establishments belonging to one firm in the subsequent survey, then these two firms are identical, and (2) if establishments belonging to a firm in a survey belong to two or more firms in the subsequent survey, we regard the firm with the largest number of establishments linked in the subsequent survey as being identical to the previous one.
A novel feature of this dataset is the distinguishability of the type of firm exit, i.e.
whether it is a complete shutdown (dissolution) or acquisition by another firm (acquisition). When a firm is completely shut down, all establishments belonging to the firm disappear in the subsequent period. However, when a firm is acquired by another firm, some of the establishments belonging to the acquired firm are expected to belong to the other firm in the subsequent period.
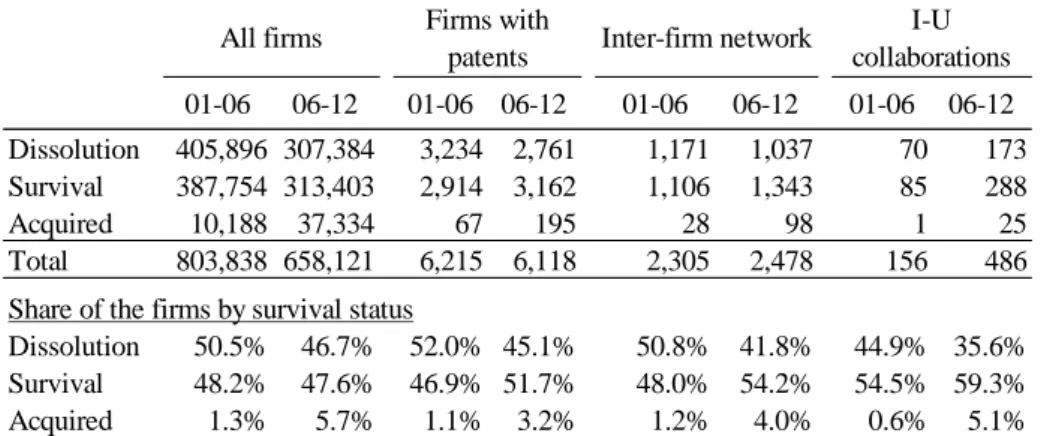
Table 1 shows the sample size of the dataset used. Our focus is on young firms’
patenting and survival, so we selected firms that were no more than 5 years old, which amounted to approximately 650,000 to 800,000 firms, out of roughly 5 million firms located in Japan. Among these selected young firms, those with patent applications numbered approximately 7,000. For example, 6,118 (3,162 surviving, 2,761 dissolved, and 195 acquired) firms filed patents out of a total of 658,121 (313,403 surviving, 307,384 dissolved, and 37,334 acquired) firms in 2006. The share of surviving firms is higher for firms with patents because the average size is greater for firms in that sample. Table 1 also shows that the sample size of the firms filing joint patent applications with other firms (inter-firm networks) and those collaborating on patents with universities (Industry-University (IU) collaborations). The share of surviving firms collaborating on patents is higher than that of the firms holding patents in general, but the share of acquisitions is also higher for firms with inter-firm networks and IU collaboration.
(Table 1)
Table 2 shows patents and survival by firm size, which is measured by the number of a firm’s employees at the beginning of periods. The survival rate increases as firms become larger in the case of firms holding patents in both sample periods, while the survival rates of larger firms (those with more than 100 employees) are relatively low, particularly in the later period from 2006 to 2011.
(Table 2)
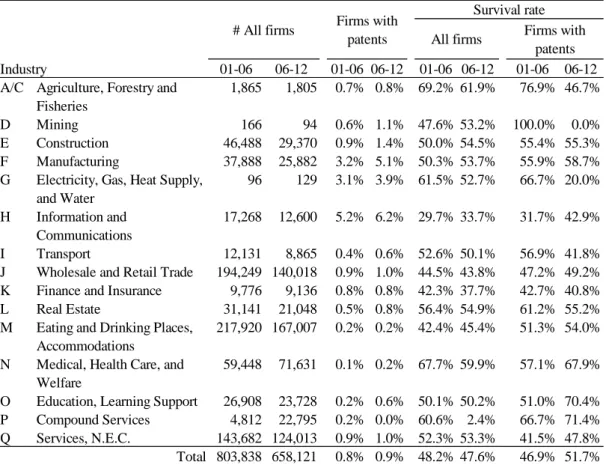
Tables 3 shows firm distribution by industry. The industries, in which a high number of patent applications are held, are the information and communications, the
9
manufacturing, and the electricity, gas, heat supply and water industry. Moreover, the share of patenting firms has increased across all industries. When we look at survival rates, we see that patenting firms have higher survival rates in almost all industries in 2001 with the exception are service N.E.C. and medical service. However, in the period from 2006 to 2012, patenting firms showed more exits in several industries, including agriculture, forestry and fisheries and the electricity, gas, heat supply and water industry.
(Table 3)
4. Econometric Analysis
In this chapter, an econometric analysis is conducted to test the hypotheses laid out in Section 2. Our dataset has three data points (2001, 2006 and 2012), and the basic strategy is to compare firm survival and exit in two periods (2001-2006 and 2006-2012) using firms’ patenting activities at the beginning (2001 or 2006)2. Specifically, the dependent variable in our econometric model is a binary variable using either 1 (for survive) or 0 (for exit), and we pool all samples in two period to run probit regression with several explanatory variables, which is explained later. It should be noted that there is no overlap of samples in these two periods because we use firms that are no more than 5 years old at the beginning (a firm established before 2001 is already more than 5 years old at the time of the 2006 survey, so it is not included with the samples for the 2006-2012 period).
The key explanatory variables in this study are constructed using patent data. In order to avoid any survival bias caused by patenting (survival for patenting, instead of patenting for survival), we use a dummy variable (d.ap0) for whether a firm applies for any patents prior to the beginning time (T0). Most of studies investigating the relationship between patenting and survival use patent applications (and/or stock of registered patents) at the time of firm exit (Helmers and Rogers, 2010; Cockburn and Wagner, 2010). In this case, the longer a firm survives, the more likely it is to apply for patents. Therefore, the relationship between patent and survival tends to be positive (Hyytinen et al. 2015). In order to avoid such reverse causality, we set a starting line for all firms, and take into account only patents applied before this time so that we may more clearly observe the impact of patent on survival. We also control for firm size
2 The timing of the surveys is October 1 for the 2001 and 2006 surveys, and February 1 for the 2012 survey. Therefore, it should be noted that the first period spans only 5 years while the second is a bit longer at 5 years and 4 months.
10
(log of employment), log of firm age and its cross term at the beginning time (T0).
In order to identify a patent that have potential market viability, we construct additional patent statistics using patent grant time (Figure 1). Under Japan’s patent system, a patent applicant has to request a patent examination in order for the patent to be granted within 3 years after application3. However, if an applicant perceives great potential in terms of the patent’s market applications, the applicant is supposed to request an earlier examination so that this patent to be granted as soon as possible.
Therefore, patents granted soon after application tend to have greater market potential that those granted later. In addition, such patents may be superior in terms of technology as well. A short duration between patent application and grant means that the patent passed examination without any refusal actions initiated on the initial application. Therefore, we use the variable d.ap0_grXyr, which refers to a dummy variable if a patent is granted before X years have passed since its application.
(Figure 1)
It should be noted that d.ap0_grXyr can be positively biased toward surviving firms because when X is lengthened, surviving firms have more time for their patents to be granted. Figure 2 shows how d.ap0_grXyr changes when X gets longer. It should be noted that d.ap0_grXyr values across survival status diverge when X gets longer.
The difference, particularly after X is 5 years and longer, between firm survival and exit, may reflect a survival bias (survival for patent grant) in this indicator. We will come back to this point again when discussing the regression analysis results.
(Figure 2)
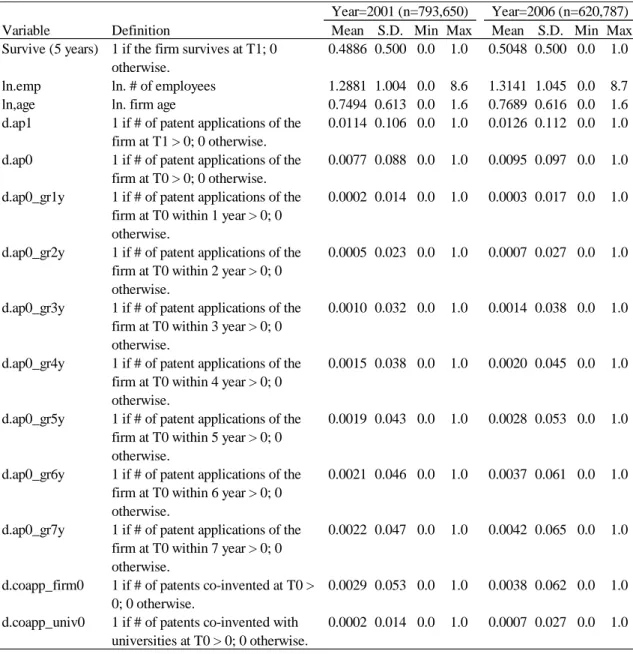
In addition, we have constructed two types of variables from the patent database:
a dummy variable for joint applications or joint inventions with universities (d.univ0) and a dummy variable for joint applications with other firms (d.firm0). The former variable can be used as a proxy for firm technological capability. The share of firms jointly working together with universities increases from 0.02% in 2001 to 0.07% in 2006, reflecting the incorporation of national universities in 2004 (Motohashi and Muramatsu, 2012). These firms are a small set which have enough technological capability (absorptive capacity) to collaborate with academia. In contrast, joint patent application with other firms has not much increased (0.3% in 2001 and 0.4% in 2006).
This variable reflects collaboration on innovation for business. Table 4 shows
3 The duration of this period used to be 7 years, but it was shortened for patents applied for after October 1, 2001.
11
descriptive statistics for these variables.
(Table 4)
We run regressions for pooled datasets for two time periods (2001-2006 and 2006-2012), and include the interactions of time dummies and industry dummies in our regression models in order to control for the different impact of macro-economic changes over time by industry. Just as with the patent-related variables explained above, we control for firm size according to the number of employees as well as firm age and the interaction of these two at the beginning of the observation period. Probit regression results in all tables are converted to marginal effect. As is seen in the Model (1) in Table 5, the coefficient of d.ap0 (ex-ante patent application dummy) is positive and statistically significant at 1%. However, it should be noted that firm exits due to acquisition are included in this model. A start-up firm with higher technological capability can be an attractive target in the M&A market. The differences in firm exit antecedents between dissolution and acquisition have been investigated in the past (Mitchell, 1994: Grilli et al., 2010). Srinivasan et al. (2008) extends these studies by taking into account firms’ technology management strategies, and finds a positive relationship between the a firm’s technological capability and firm exit due to acquisition, while such relationship turns negative for firm exit due to dissolution.
When we ran regression separately for firm exits due to acquisition (Model (2)) and dissolution (Model (3)), we found that the impact of d.ap0 is larger for acquisition sample (0.0667), as compared to the one for and not dissolution sample (0.0117), which is consistent with past literature.
(Table 5)
Hereafter, we focus on the survival rate, comparing exit due to dissolution (excluding the acquisition sample) to investigate the vulnerability of young firms more precisely. First, we test the possibility of survival bias by using patent application at the time of exit. We do not have precise information on exit timing, so we use a dummy variable for patent applied through year end (d.ap1). As expected, the coefficient of d.ap1 is positive and statistically significant (Model (4)), and when we include both d.ap0 and d.ap1, then the coefficient of d.ap0 turns out to be negative and statistically significant (Model (5)). We have confirmed a survival bias associated with d.ap1 (survival for patenting, instead of patenting for survival), which also affects the coefficient of d.ap0. Hereafter, we focus on ex-ante patenting activities in the observation period for firm survival. In Models (6), (7) and (8), we include dummy variables for collaboration on inventions. Generally speaking, university collaboration as a representation of firms’ technological capability has a positive impact on firm survival as long as the coefficient of collaboration with other firms is positive, but it is
12
hard to say that this is statistically significant.
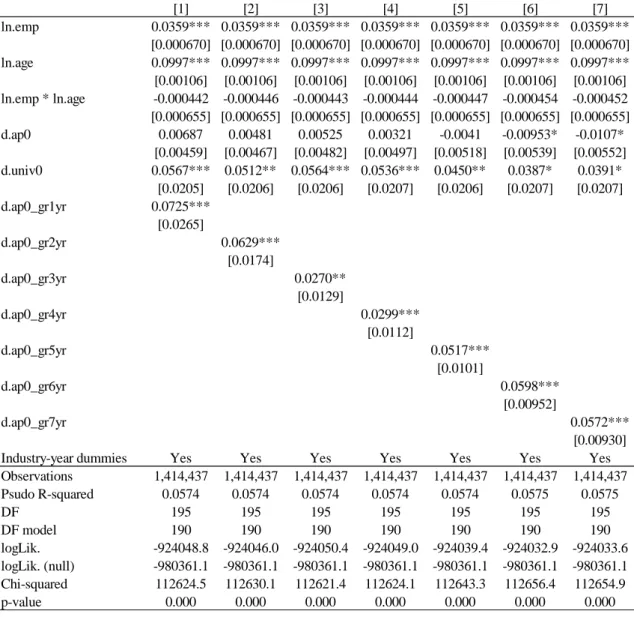
Table 6 shows regression results including for d.ap0_grXyr, a dummy variable expressing whether or not an application patent before T0 is granted within X years after application, as well as a dummy variable expressing whether firms collaborate with universities (d.univ0), which is a reflection of firms’ technological capability (absorptive capacity). First, all of coefficients of d.univ0 are positive and statistically significant, so that H1a is supported. In addition, positive and statistically significant coefficients are found with all variables of d.ap0_grXyr. In addition, the coefficient of d_ap_grXyr decreases as X increases up to X=3. This is consistent with the view that patents with a shorter grant lag have a relatively greater potential market value such that H1b is supported. The reason why the coefficient of d_ap_grXyr increases again after X=4 is that the degree of survival bias becomes larger as X gets longer (survival for patent grants, instead of patent grants for survival). As is discussed earlier with regard to Figure 2, this bias becomes greater, particularly after X is more than 4 years.
(Table 6)
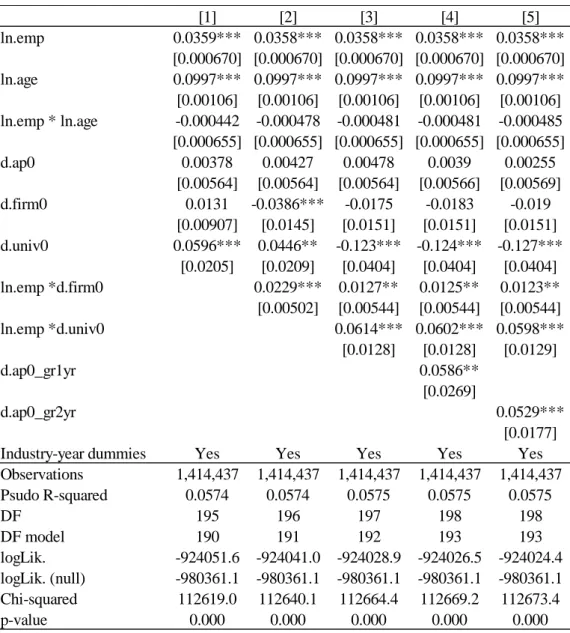
Table 7 shows regression results including collaborative patent variables. Here, d.firm0 and d.univ0 interact with ln.emp, and a moderation effect is observed of ex-ante firms’ management resources with firm survival during the observation period in terms of the relationship between open innovation and survival. When we include only interaction of d.firm0 and firm size, then the coefficient of these cross terms is positive and statistically significant, while the coefficient of d.firm0 is negative and statistically significant (Model (7)). This means that joint technological development with other firms has a negative impact on survival of very small firms, while it is positive for larger firms. When the interaction of d.univ0 and firm size are also included (Model (3)), a similar patterns for joint technological development with universities emerges, while the negative coefficient of ap.firm0 is not statistically significant. We have consistent results even when controlling for potential market value (d_ap0_grXyr variables) (Models (4) and (5)). Therefore, the resource requirements to make collaborative projects successful is more intense for university collaboration than for collaboration with other firms.4
(Table 7)
4 When we divide the sample according to firm size, the effects of collaboration with a university or other firm on survival are positive and statistically significant for firms with 50 or more employees, while they are not significant for small firms with less than 50 employees (see Appendix Table 1).
13
As for d.firm0, firms reduce liability related to novelty by collaborating with other firms in a sense that they may be able to rely on the counterpart’s managerial resources (market channels, financial resources etc.). On the other hand, collaborating with other firms increases the complexity of managing innovation. Such negative factors decrease as firm size increases, so that the overall effect of collaboration with other firms turns positive for larger firms, and vice versa (supporting H2a). In terms of d.univ0, reflecting firms’ technological capability, larger firms will be able to capture market opportunities from technology sourcing from universities more easily because such firms tend to have a better capability to absorb and appropriate fundamental knowledge from academia (supporting H2b). In addition, a stronger moderation effect due to firm size with university collaboration may suggest that innovation with universities is riskier both technologically and commercially.
5. Discussion and Conclusion
This paper uses a dataset linking the Economic Census and IIP Patent Database for Japanese firms to conduct a systematic analysis of the relationship between patenting and firm survival. We have disentangled two competing factors associated with innovation, which are technological capability (positive influencing firm survival) and commercial risk (negative influencing firm survival), and found that positive impacts generally surpasses negative ones, and such tendency is stronger when patents have relatively greater potential market value, even after controlling for various possible causes of survival bias.
In addition, we have investigated whether collaboration with universities and/or other firms helps firm survival in terms of innovation. We found that collaboration with universities reflect firms’ technological capability to absorb scientific knowledge from the academic sector and leads to higher probability of survival, while the requirement of complementary resources for successful innovation is quite intense and the survival rate is even smaller for small firms engaging in university collaboration. In comparison with university collaboration, the impact of collaboration with other firms on survival is modest, and, again, firm size positively moderates the relationship between patenting and survival. That is, a certain level of managerial resources for overcoming complexity associated with open innovation is required to gain from such collaboration.
Innovation is essential to firms’ growth and productivity, but failure of a risky investment may lead to failure of the firm itself. We would expect a learning effect from innovation even of it ends in failure, but when a firm exits due to dissolution, the experience gained from such innovation is lost as well. Therefore, we expect a substantial social welfare loss associated with exit of firms investing in risky R&D
14
projects (Knott and Pose, 2005). However, our finding of a positive impact on survival from patenting, even for fragile young firms, is encouraging for policy makers promoting high-tech entrepreneurship. While the survival rate for young firms is relatively lower and many young firms simply go through the revolving door of the market, firms engaging in innovation are more likely to stay in the market and serve as a source for job growth.
However, it should be noted that open innovation, as understood in terms of joint technological development with other firms, does not always lead to a higher likelihood of survival. The resource requirement for university collaboration is intense, so engaging in innovation with universities is more likely to have negative consequences for small firms. This may be due to the fact that a project involving university may take longer to reach the market, requiring substantial financial resources. Our results suggest the existence of financial and labor market failures associated with young firms involved in collaborative projects with universities, which are likely to be university based start-ups, and some policy action is advised to correct market imperfections.
Collaboration with other firms is more commonly observed in our sample, but we found that obtaining value from joint technological development requires that firms have a certain minimum amount of managerial resources as well. One difference between inter-firm collaboration and university collaboration is that the former tends to focus more on market application, and may be beneficial for young firms by benefiting from a partner’s assistance to reduce market risk. However, joint innovation involves substantial management complexity (Rosenbusch et al., 2011), and managing such a process is particularly difficult for young firms with less experiences and resources (Kale at. al, 2002). Therefore, possible policy actions include managerial advice on open innovation and collaborative R&D projects sharing best practices for young and small firms.
Finally, we conclude this paper with some limitations. First, because this study is based on periodically conducted survey data (5-year spans), information detailing the exact time of firm dissolution is not available. Therefore, survival bias cannot be completely controlled. Results on the relationship between innovation and firm survival that are inconsistent with past empirical studies are largely explained in terms of the treatment of survival bias (Hyytinen et al., 2015). This is the reason why we made a substantial effort to employ patent examination process data, but a more systematic study could be done if information on firms’ exit timing were included, which might be found, for example, in administrative records on tax reporting. Second, we use patent information as a proxy for innovation. At the patenting stage, technological risks still remain as well as commercial risks until the innovation results
15
in new product sales. Additional information on innovation, such as product innovation, would allow us to disentangle commercial risk from technological risks in our analysis, which would have more precise implications for management policy.
16
References
Baily, M. N., C. Hulten and D. Campbell (1992). Productivity dynamics in manufacturing plants, Brookings Papers on Economics Activity, Microeconomics 1992: 187-249.
Bartelsman, E., and M. Doms (2000). Understanding productivity: lessons from longitudinal microdata, Journal of Economic Literature, 38(3): 569-594.
Bartelsman, E., S. Scarpetta and F. Schivardi (2005). Comparative analysis of firm demographics and survival: evidence from micro-level sources in OECD countries, Industrial and Corporate Change 14(3): 365-391.
Baumol, W. J., (2010). The Microtheory of Innovative Entrepreneurship, Princeton University Press.
Belderbos, R., D. Faems, B. Lenten and B. V. Looy (2010). Technological activities and their impact on the financial performance of the firm: Exploitation and exploration within and between firms, Journal of Product Innovation Management 27(6): 869-882.
Boyer, T., and R. Blazy (2014). Born to be alive? The survival of innovative and non-innovative French micro-startups, Small Business Economics 42(4), 669-683.
Buddelmeyer, H., P. Jensen and E. Wesbster (2010). Innovation and the determinants of company survival, Oxford Economic Papers 62(2): 261-285.
Cerfis E. and O. Marsili (2005). A matter of life and death: innovation in firm’s survival, Industrial and Corporate Change 14(6): 1167-1192.
Cerfis E. and O. Marsili (2006). Survivor: the role of innovation in firm’s survival, Research Policy 35, 626-641.
Chesbrough, H., (2003). Open innovation: the new imperative for creating and profiting from innovation. Harvard Business School Press: Cambridge, MA.
Cockburn, I. and S. Wagner (2007). Patents and the survival of internet-related IPOs, NBER Working Paper #13146, Cambridge MA.
Ericson, R. and A. Pakes (1995). Markov-perfect industry dynamics: A framework for empirical work, Review of Economic Studies 62(1): 53-82.
17
Esterve-Perez, S., and J. A. Manez-Castillejo (2008). The resource-based theory of the firm and firm survival, Small Business Economics 30(3): 231-249.
Goto A. and K. Motohashi (2007). Construction of a Japanese Patent Database and a first look at Japanese patenting activities, Research Policy 36(9): 1431-1442.
Grilli, L., E. Piva and C. R. Lamastra (2010). Firm dissolution in high-tech sectors: An analysis of closure and M&A,Economics Letters 109(1): 14–16.
Haeussler, C., D. Harhoff, and E. Mueller (2009). To be financed or not: The role of patents for venture capital financing, ZEW Discussion Paper No. 09-003, Center for European Economic Research, Manheim Germany.
Helmers, C., and M. Rogers (2010) Innovation and the survival of new firms in the UK, Review of Industrial Organization 36(3): 227-248.
Hyytinen, A., M. Pajarinen and P. Rouvinen (2015). Does innovativeness reduce startup survival rates? Journal of Business Venturing 30(4): 564-581.
Ikeuchi, K., K. Motohashi, R. Tamura and N. Tsukada (2017). Science intensity of industry by using linked dataset of science, technology and industry, mimeo.
Jovanovic, B., (1982). Selection and the evolution of industry, Econometrica 50(3):
649-670.
Kale, P., J. H. Dyer, and H. Singh (2002). Alliance capability, stock market response, and long term alliance success: The role of the alliance function, Strategic Management Journal 23(8): 747-767.
Knott, A. M., and H. E. Posen (2005). Is failure good? Strategic Management Journal, 26(7): 617-641.
March, J. G., (1991). Exploration and exploitation in organizational learning, Organization Science 2(1): 71-87.
Mitchell, W., (1994). The dynamics of evolving markets: The effects of business sales and age on dissolutions and divestitures, Administrative Science Quarterly 39(4): 572-602.
Motohashi, K., (2016). Innovation and entrepreneurship: A first look at the linkage data of Japanese Patent and Enterprise Census, Seoul Journal of Economics, 29(1): 69-94.
18
Motohashi, K. and S. Muramatsu (2012). Examining university industry collaboration policy in Japan by patent analysis, Technology in Society 34(2): 149-162.
OECD (2003). The Sources of Economic Growth in OECD countries, OECD Paris.
Orgega-Argiles, R. and R. Moreno (2007). Firm competitive strategies and the likelihood of survival: the Spanish case, Discussion Paper on Entrepreneurship, Growth and Public Policy 2007-05, Max-Planck Institute of Economics, Jena Germany.
Pederzoli, C., G. Thona and C. Torricelli (2011). Modeling credit risk for innovative firms: the role of innovation measures, mimeo.
Rosenbusch, N., J. Brinckmann and A. Bausch (2011). Is innovation always beneficial?
A meta-analysis of the relationship between innovation and performance in SMEs, Journal of Business Venturing 26(4): 441-457.
Santarelli, E., and M. Vivarelli (2007). Entrepreneurship and the process of firms’ entry, survival and growth, Industrial and Corporate Change 16(3): 455-488.
Schumpeter, J. A., (1934). The Theory of Economic Development, Harvard University, MA, USA.
Schumpeter, J. A., (1942). Capitalism, Socialism, and Democracy, Harper, NY, USA.
Srinivasan, R., G. L. Lilien and A. Rangaswamy (2008). Survival of high tech firms:
The effects of diversity of product-market portfolios, patents and trademarks, International Journal of Research in Marketing, 25(2): 119-128.
Zheng, Y., Liu, J. and G. George (2010). The dynamic impact of innovative capability and inter-firm network on firm valuation: A longitudinal study of
biotechnology start-ups, Journal of Business Venturing 25(6): 593–609.
19
Figure 1: Construction of patent variables
Figure 2: Share of firms with a patent application granted after X year(s) by survival status
0.00%
0.05%
0.10%
0.15%
0.20%
0.25%
0.30%
0.35%
0.40%
≦1 year ≦2 years ≦3 years ≦4 years ≦5 years ≦6 years ≦7 years Difference between application and grant
Survive Dissolution Acquired