Analysis of Small Crack Model within Singular Stress Field in A Three-Dimensional Joint
Kouki YOKOYAMA
1, Naoki KIMURA
1, Hideo KOGUCHI
21
Department of Mechanical Engineering, Graduate School of Nagaoka University of Technology
Kamitomioka 1603-1, Nagaoka, Niigata 940-2188, JAPAN
[email protected]2
Department of Mechanical Engineering, Nagaoka University of Technology Kamitomioka 1603-1, Nagaoka, Niigata 940-2188, JAPAN
[email protected]
Advanced electronic device packaging has several kinds of joint structures of metal, ceramic and polymer. It is well known that the stress singularity occurs at the cross point and line of free surface and interface. Then, a crack initiates from the vertex and the joint fails. Hence, a lot of studies on the joints have been carried out theoretically and experimentally. In the previous study, two-dimensional joints are extensively investigated, however, few studies on three-dimensional joint structures have been carried out until now. For instance, CSP has a three-dimensional bonded structure of IC chip and polymers, and delamination occurs frequently at an interface between IC and a resin. Therefore, a method for estimating the strength of interface at the vertex based on the three dimensional intensity of singularity is needed. In the present paper, energy release rate at an initial step of crack growth for four kinds of crack shape in a three-dimensional joint is calculated and discussed. Boundary element method and eigen analysis are used for evaluating the intensity of stress singularity and displacements in the crack surface.
Eigen analysis
The order of stress singularity, λ, which characterizes stress field is determined using an eigen equation which is formulated on the basis of FEM as follows.
(p2[A]+ p[B]+[C]){u}= 0
(1)
where
λ=1-Re(p),p is a root of Eq.(1), [A], [B] and [C] are matrices consisted of elastic moduli and the geometry of joints, {u} represents a nodal displacement vector. When 0<λ<1, the stress field has a stress singularity, and when l < λor λ<0, the stress singularity disappears.
Firstly, the order of stress singularity is determined using Eq.(1). The mesh division for eigen
analysis is shown in Fig.1. This figure represents a developed mesh on the
θ-φ plane of thesphere. Material properties used in the analysis are shown in Table 1. In this analysis, mesh
size of
θand
φcoordinates is
θ×φ=7.5
o×7.5oand a mesh involving an interface and stress
singularity lines is equally divided by five
θ×φ=1.5o×1.5o. In order to assume a crack, the
eigen value of crack model is calculated by making distinct nodes on an interface between
silicon and resin (see Fig.1 (b)). A small crack is introduced at the interface of vertex. Crack
shapes are shown in Fig.3. Triangular, quarter circular, concave and quasi-concave shapes are
chosen as crack geometries. These shapes are referred to as Type A, Type B, Type C and
Type D, respectively. Type D is produced from the contour of stress
σzz, and a crack front
does not ideally intersect the stress singular line, although it intersects far from the vertex.
Therefore, evaluation in eigen value analysis is performed by Type A, Type B, and Type C.
Results of eigen analysis are shown in Table 2. The eigen value of Type B is the largest in three types. The angle between a crack front and a singular line is small in Type B.
(a) A mesh on a unit sphere
(b) A mesh on the developed θ
×φ planewith an origin at a vertex
Fig.1 Finite element model for eigen analysis
Fig.2 Shape of crack
Table 1 Material properties for analysis
Table 2 Eigen value of each crack shape
Type A Type B Type C
Real Image Real Image Real Image
λ1
0.451 0.000 0.664 0.000 0.318 0.000
λ2
0.306 0.000 0.501 0.000 - -
Type A Type B Type C Type D
!’=90 !’=175
!’=135
Material Young’s
modulus, GPa Poisson’s ratio
Silicon 169.1 0.26
Resin 2.97 0.38
Interface q
e 0
//2
/
Resin
//2 /
Silicon
Various node
Silicon
Resin
Interface Stress singularity point
y z
x
O
Three-dimensional boundary element method
The boundary integral equation can be expressed as follows.
cij (P) ui (p)= {Uij(P,Q) tj (Q)-Tij(P,Q) uj(Q)}ds(Q)
"
! (2)where c
ij(P) represents a constant depending on the shape of boundary, P and Q are an observation point and a source point locating on the boundary G , and U
ijand T
ijrepresent the fundamental solutions for displacement and traction. Here, Rongved's solution which is the Green function for two-phase isotropic materials is used as the fundamental solution for calculating the stress fields at the vertex in three-dimensional joints. Stress distribution in the domain for analysis is evaluated using Hooke's law and the following equation.
ui,k
( )
p ="
!{
Uij,k(
p,Q)
tj( )
Q -Tij,k(
p,Q)
uj( )
Q}
ds Q( )
(3)where U
ij,kand T
ij,kare the derivatives of fundamental solutions of displacement and traction with respect to p.
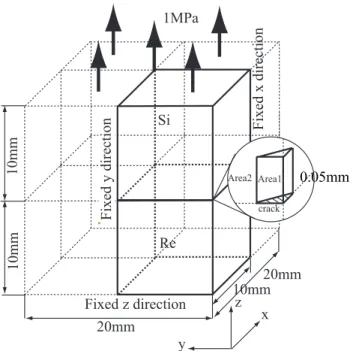
A model for BEM analysis is consisted of Si and resin, and is shown in Fig.3. Crack shapes are shown in Fig.2. Areas for all crack models are equal to each other. The singular stress field near the vertex is investigated under a tensile load.
Fig. 3 Three-dimensional bonded structures with small crack on vertex
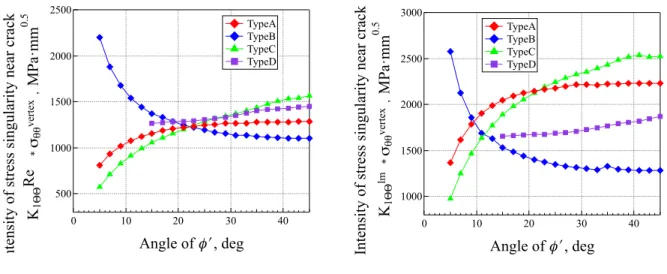
The intensity of singularity at the vertex in the crack model is shown in Fig.4. As a result, the variation of the stress intensity factor, K
I, against the angle measured from the side surface depends on the shape of crack. The values of
K!""Re
and
K!""Im
in Type B increases near the side surface more than that in the others. The values of
K!""Re
and
K!""Im
in Type A, Type C and Type D decrease near the side surface. This is attributed to the smaller value of the order of stress singularity at the cross point of crack front and side free surface than that at the crack tip. The values of the order of stress singularity at the cross point of crack front and the side
20mm
Fixed z direction
10mm Fixed y direction 20mmFixed x direction
x y
z Si
Re 1MPa
10mm
10mm
Area1 Area2
crack
0.05mm
surface are 0.45 for Type A, 0.66 for Type B and 0.32 for Type C. Once a crack initiates in a quarter circular shape, the crack grows near the free surface. When a crack initiates in a concave shape, the crack grows around the center of the crack front line.
Fig.4 Distribution of
K!""Re K!""
Im
against angle of
!!Energy release rate
Energy release rate for each crack shape was calculated by using the following equation based on a virtual crack extension method.
Gtotal = (!""vertex(r,#)u"(r,#)+!r"vertex(r,#)ur(r,#)+!#"vertex(r,#)u#(r,#))r dr d#
""
!(4)
Energy release rate is shown in Table3. As a result, Type D has the largest energy release rate.
As possible initial shape of crack, the concave shape was appropriate.
Table 3 Energy release rate Shape of
crack Energy release rate Crack length
Type A 4.51×10
-15[J] 0.264[µm]
Type B 3.61×10
-15[J] 0.215[µm]
Type C 5.05×10
-15[J] 0.305[µm]
Type D 1.15×10
-13[J] 2.18[µm]
References
[1] JR. Reedy and T. R. Guess: Interface corner failure analysis of joint strength-Effect of adherend stiffness, Int. J. Fracture, Vol.88, pp.305-314,1997.
[2] H. Koguchi and T. Muramoto: The Order of Stress Singularity near the Vertex in Three-Dimensional Joints, Int. J. Solids Structures, Vol.37, pp.4737-4762, 2000.
[3] H. Koguchi: Stress singular analysis in three-dimensional bonded, Int. J. Solids Struc, Vol.34, pp.461-480, 1997.
2500
2000
1500
1000
500
Intensity of stress singularity near crack K1!!Re * "##vertex , MPa!mm0.5
40 30
20 10
0
Angle of !" , deg
TypeA TypeB TypeC TypeD
3000
2500
2000
1500
1000
Intensity of stress singularity near crack K1!!lm *
"##vertex , MPa!mm0.5
40 30
20 10
0
Angle of !" , deg
TypeA TypeB TypeC TypeD