InterComparison Experiments for Greenhouse Gases Observation (iceGGO) in 2012–2016
BY
K. Tsuboi, T. Nakazawa, H. Matsueda, T. Machida, S. Aoki, S. Morimoto, D. Goto, T. Shimosaka, K. Kato, N. Aoki, T. Watanabe, H. Mukai, Y. Tohjima, K. Katsumata, S. Murayama, S. Ishidoya, T. Fujitani, H.
Koide, M. Takahashi, T. Kawasaki, A. Takizawa and Y. Sawa
気象研究所技術報告 第 79 号
2012 年から 2016 年に実施された
温室効果ガス観測に関する相互比較実験(iceGGO)
坪井一寛、中澤高清、松枝秀和、町田敏暢、青木周司、森本真司 後藤大輔、下坂琢哉、加藤健次、青木伸行、渡邉卓朗、向井人史 遠嶋康徳、勝又啓一、村山昌平、石戸谷重之、藤谷徳之助、小出寛
髙橋正臣、川﨑照夫、滝沢厚詩、澤庸介
気象研究所
METEOROLOGICAL RESEARCH INSTITUTE, JAPAN
March 2017
Senior Director for Research Affairs: Dr. Kazuo Saito Senior Director for Research Coordination: Mr. Yoshiaki Takeuchi
Forecast Research Department Director: Mr. Ko Koizumi
Climate Research Department Director: Dr. Tomoaki Ose
Typhoon Research Department Director: Mr. Isao Takano
Atmospheric Environment and
Applied Meteorology Research Department Director: Dr. Izuru Takayabu Meteorological Satellite and
Observation System Research Department Director: Mr. Osamu Suzuki Seismology and Tsunami Research Department Director: Dr. Kenji Maeda Volcanology Research Department Director: Dr. Hitoshi Yamasato Oceanography and Geochemistry Research Department Director: Dr. Tsurane Kuragano
1-1 Nagamine, Tsukuba, Ibaraki, 305-0052 Japan
TECHNICAL REPORTS OF THE METEOROLOGICAL RESEARCH INSTITUTE
Editor-in-chief: Tomoaki Ose
Editors: Wataru Mashiko Masayoshi Ishii Masahiro Sawada
Yuji Kitamura Hanako Inoue Hiroaki Tsushima
Shinya Onizawa Norihisa Usui Managing Editors: Rai Okabe, Miyuki Kawamata
The Technical Reports of the Meteorological Research Institute has been issued at irregular intervals by the Meteorological Research Institute (MRI) since 1978 as a medium for the publication of technical report including methods, data and results of research, or comprehensive report compiled from published papers. The works described in the Technical Reports of the MRI have been performed as part of the research programs of MRI.
©2017 by the Meteorological Research Institute.
The copyright of reports in this journal belongs to the Meteorological Research Institute (MRI). Permission is granted to use figures, tables and short quotes from reports in this journal, provided that the source is acknowledged. Republication, reproduction, translation, and other uses of any extent of reports in this journal require written permission from the MRI.
In exception of this requirement, personal uses for research, study or educational purposes do not require permission from the MRI, provided that the source is acknowledged.
TECHNICAL REPORTS OF THE METEOROLOGICAL RESEARCH INSTITUTE No.79
I nterComparison Experiments for Greenhouse Gases Observation (iceGGO) in 2012–2016
BY
K. Tsuboi
1, T. Nakazawa
2, H. Matsueda
1, T. Machida
3, S. Aoki
2, S. Morimoto
2, D. Goto
4, T. Shimosaka
5, K. Kato
5, N. Aoki
5, T. Watanabe
5, H. Mukai
3, Y.
Tohjima
3, K. Katsumata
3, S. Murayama
6, S. Ishidoya
6, T. Fujitani
7, H. Koide
8, M. Takahashi
8, T. Kawasaki
8, A. Takizawa
8and Y. Sawa
11
Meteorological Research Institute, Tsukuba, Japan
2
Tohoku University, Sendai, Japan
3
National Institute for Environmental Studies, Tsukuba, Japan
4
National Institute of Polar Research, Tokyo, Japan
5
National Metrology Institute of Japan, Tsukuba, Japan
6
National Institute of Advanced Industrial Science and Technology, Tsukuba, Japan
7
Office for Coordination of Climate Change Observation, Tsukuba, Japan
8
Japan Meteorological Agency, Tokyo, Japan
i
序
気象研究所海洋・地球化学研究部は、大気・海洋に存在する各種の化学物質の時間的・
空間的な変動を把握し、地球環境変動を化学的に解明するための研究を行っている。特に、
大気中の二酸化炭素等の温室効果ガスの長期観測を重点課題の一つとして実施し、その変 動を正確に捉えるための基準となる標準ガスに基づく観測スケールの開発と維持管理手法 の確立も行ってきた。これまでの研究実績を活用し、気象庁が実施する温室効果ガス観測 や較正業務の向上を図ってきた。観測スケールの運用や観測データの品質管理に対して技 術支援を行い、より精度の高い定常観測の運営に貢献している。
平成22年度に地球観測連携拠点(温暖化分野)の枠組みの下、気象研究所等温室効果 ガス観測を実施する国内研究機関や現業観測を行っている気象庁に加えて、国家計量機関 も参画した「温室効果ガス観測データ標準化ワーキンググループ」が設置された。この活 動では、国内各機関の観測データを統合し解析するための第一歩として、相互の観測スケ ールの差異を把握することを目的として、標準ガスの巡回比較実験を行うことが合意され た。実験は、平成24年度から約5年間にかけて7つの機関が参加して行われた。これら 一連の実験では、国内の観測スケールの比較に留まらず、気象庁が維持する世界気象機関
(WMO)スケールとの差異を示す新たな知見も得られ、国内外の学会でも発表された。ま た、測定原理や分析計機種の違いによる測定誤差についても精密な評価を行い、観測デー タの品質向上に繋がる重要な研究成果が得られた。
本技術報告は、国内観測機関と計量機関の連携による標準ガス巡回比較実験の詳細とそ の結果を取りまとめたものである。今後、各機関の観測データを比較・統合し、データ標 準化を図る際の有益な指針となることが期待される。
気象研究所海洋・地球化学研究部長
倉賀野 連
ii
2012年から2016年に実施された温室効果ガス観測に関する相互比較実験(iceGGO)
坪井一寛1, 中澤高清2, 松枝秀和1, 町田敏暢3, 青木周司2, 森本真司2, 後藤大輔4, 下坂琢哉5, 加
藤健次5, 青木伸行5, 渡邉卓朗5, 向井人史3,遠嶋康徳3, 勝又啓一3, 村山昌平6, 石戸谷重之6, 藤
谷徳之助7, 小出寛8, 髙橋正臣8, 川﨑照夫8, 滝沢厚詩8, 澤庸介1
1気象研究所, 2東北大学, 3国立環境研究所, 4国立極地研究所, 5計量標準総合センター, 6産業技術 総合研究所, 7地球温暖化観測推進事務局, 8気象庁
地球温暖化観測を実施している日本の主要な研究・行政機関は「地球観測連携拠点(温 暖化分野)」の活動に参画し、この枠組みのもと「温室効果ガス観測データ標準化ワーキ ンググループ」が発足し、国内において標準ガス比較実験を共同実施することが合意され た。比較実験は、長期の観測データの品質向上と高精度の統合データベース化を達成する ことを目指して、各機関が保有する標準ガス・スケールの差異を明らかにすることを主要 な目的とした。この活動には国家計量機関である産業技術総合研究所の計量標準総合セン ター(NMIJ: National Metrology Institute of Japan)も参加し、2012年から総合的な プ ロ ジ ェ ク ト 「 温 室 効 果 ガ ス 観 測 に 関 す る 相 互 比 較 実 験 」(InterComparison Experiments for Greenhouse Gases Observation: iceGGO)が実現することになった。
気 象 庁 (JMA: Japan Meteorological Agency) は 世 界 気 象 機 関 (WMO: World Meteorological Organization)の全球大気監視(GAW: Global Atmosphere Watch)
計画の下で運営している全球大気監視較正センター(WCC: World Calibration Center)
の活動の一環として、 アジア及び南西太平洋地区のメタン巡回比較実験を継続的に実施 しており、iceGGOとも連携し国内における比較実験を行った。
iceGGOには NMIJとJMA のほか、東北大学(TU: Tohoku University)、国立極地研 究所(NIPR: National Institute of Polar Research)、国立環境研究所(NIES: National
iii
Institute for Environmental Studies)、産業技術総合研究所(AIST: National Institute of Advanced Industrial Science and Technology)、気象研究所(MRI: Meteorological Research Institute)を含めて合計7つの機関が参加した。また、実験の立案・実行と結 果のとりまとめについては、「地球観測連携拠点(温暖化分野)」の活動の一部として、連 携拠点を運営する地球温暖化観測推進事務局(OCCCO: Office for Coordination of Climate Change Observation)の全面的な協力を受けた。このようなオール・ジャパン 体制による本格的な共同実験は初めての試みであり、その成果は国内外の研究集会や論文 として発表すると同時に、JMAを通してWMOにも報告された。本報告は、2012年から 2016 年の5 年間に実施された実験結果の詳細をまとめたもので、今後の地球温暖化の研 究や温暖化対策の立案の基盤となる情報として有効に活用されることが期待される。
iceGGOでは、地球温暖化観測にとって重要な二酸化炭素(CO2)、メタン(CH4)、一 酸化炭素(CO)、一酸化二窒素(N2O)の 4 種類の微量気体を対象ガスとし、それらを大 気濃度レベルに充填した高圧ガス容器を巡回して、各機関で測定を行い、結果を比較する 手法を採用した。実験は 6 回のシリーズに分けて実施し、それぞれ iceGGO-1(CH4)、
iceGGO-2(CO2)、iceGGO-3(CO2)、iceGGO-4(CO)、iceGGO-5(N2O)、iceGGO-
6(CH4)とした。さらに 7 回目の実験として、米国海洋大気庁(NOAA: the National Oceanic and Atmospheric Administration)からCO測定比較のために輸入された6本 の高圧ガス容器についても iceGGO の一環として測定を実施したことから、NOAA-ICP
(InterComParison)として本報告に加えることとした。なお、NOAA-ICP の 2 本の容 器 は 、WMO/IAEA が 主 催 す る 第 6 回 国 際 巡 回 比 較 実 験
(http://www.esrl.noaa.gov/gmd/ccgg/wmorr/index.html)としても位置付けられ た。
iv
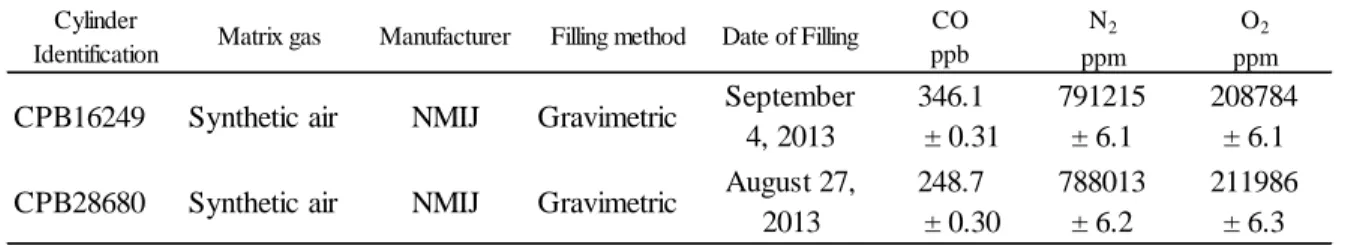
本研究で実施された合計7回のシリーズの実験概要を下記の表にまとめた。巡回した比 較ガス容器は合計36本で、その内の10本は NMIJにおいてISO-6142に基づいた質量 比混合法で調製された。
表-I. iceGGOで実施された合計7回のシリーズの比較実験の概要。
実験全体を通して、オール・ジャパン体制による連携により明らかにできた主要な成果に ついて以下に要約する。
1)比較実験の結果
合計 7 回のシリーズの比較実験結果を図―I、図―II、図―III に示す。図の濃度値は、
基準となる機関との測定濃度の差(偏差)を示し、観測機関のエラー・バーは各機関の測 定誤差(1σ)を±の幅で示し、NMIJ のエラー・バーは質量比混合法の拡張不確かさ(k
= 2)を示す。図中の点線は、WMO による観測データの統合目標の濃度範囲を表わして
いる。
Total
(NMIJ) Range of concentration Analytical method Laboratories (Standard scale) iceGGO-1 (CH4) 6 1660 - 2240 ppb CH4 GC/FID AIST,JMA,MRI,NIES,NIPR,TU,NMIJ
(2) (AIST, MRI, NIES94, NIPR, TU2008, WMO X2004)
iceGGO-2 (CO2) 9 340 - 450 ppm CO2 NDIR AIST,JMA,NIES,NIPR,TU (δ13C≑-9‰ & +55‰) (LI6252, VIA500R,VIA510R) (NIES09, TU2010, WMO X2007) iceGGO-3 (CO2) 3 380 - 420 ppm CO2 NDIR AIST,JMA,MRI,NIES,TU,NMIJ
(3) (δ13C≑-9‰, δ18O≑-13‰(LI6252, VIA500R,VIA510R) (NIES09, MRI1987,TU2010, WMO X2007) iceGGO-4 (CO) 2 250 & 350 ppb CO GC/HgO, GC/FID, VURF JMA,MRI,NIES,TU,NMIJ
(2) (NIES09, MRI, TU2010, WMO X2004)
iceGGO-5 (N2O) 6 280 - 340 ppb N2O GC/ECD, ICOS AIST,JMA,MRI,NIES,TU,NMIJ
(1) (AIST, MRI2014, NIES96, TU2006, WMOX2006A)
iceGGO-6 (CH4) 4 1800 - 2200 ppb CH4 GC/FID, CRDS AIST,JMA,MRI,NIES,TU,NMIJ
(2) (AIST, MRI, NIES94, TU2008, WMO X2004)
NOAA-ICP 6 50 - 350 ppb CO NOAA, Empa, AIST,JMA,MRI,NIES,TU
(CO, CO2, CH4, N2O) 355 - 420 ppm CO2
1570 - 2030 ppb CH4 320 - 328 ppb N2O
Total 36
(10)
v
図-I a) iceGGO-1実験のCH4濃度の比較結果。JMAの測定値からの偏差。 b) iceGGO-2実験の軽い炭素同位体 比(~ -30‰)をもつ6本のCO2濃度の比較結果。NIESの測定値からの偏差。 c) iceGGO-2実験の重い炭素同位体 比(-9‰ & +57‰)をもつ3本のCO2濃度の比較結果。NIESの測定値からの偏差。d) iceGGO-3実験のCO2濃度測 定の結果。NIESの測定値からの偏差。
vi
図-Ⅱ a) iceGGO-4実験のCO濃度の比較結果。NMIJの質量比混合法値からの偏差。 b) iceGGO-5実験のN2O 濃度の比較結果。NMIJの質量比混合法値とNOAAの測定値からの偏差。 c) iceGGO-6実験のCH4濃度の比較結 果。NMIJの質量比混合法値とNOAAの測定値からの偏差。
vii
図-III a) NOAA-ICP実験のCO2濃度の比較結果。NIESの測定値からの偏差。b) NOAA-ICP実験のCH4濃度の比 較結果。JMA の測定値からの偏差。c) NOAA-ICP 実験の CO 濃度の比較結果。NOAA の測定値からの偏差。d) NOAA-ICP実験のN2O濃度の比較結果。JMAの測定値からの偏差。
2)測定精度の評価
報告された全濃度測定データの分析誤差の平均は、CO2で 0.014ppm(n=104)、CH4
で1.4ppb(n=84)、COで0.37ppb(n=34)、N2Oで0.31ppb(n=42)であった(図
-IV)。本研究の実験に参加したすべての観測機関の測定は高い精度で実施され、観測精 度は世界トップレベルの水準で維持されていることが分かった。測定に用いられた主な分 析計は以下の通りである。CO2は非分散型赤外分析計(NDIR)、CH4は水素炎イオン化型 検出器を備えたガスクロマトグラフ(GC/FID)、CO は還元ガス型検出器を備えたガスク ロマトグラフ(GC/RGD)と真空紫外共鳴蛍光法(VURF)、N2O は電子捕獲型検出器を 備えたガスクロマトグラフ(GC/ECD)であった。
viii
図-IV CO2、CH4、CO及びN2Oの測定精度。図の頻度分布は、合計7回のシリーズの実験における全機関のすべ ての測定値について報告された測定誤差を用いた。COの白抜きのカラムはGC/FID法の測定誤差分布を示す。
3)濃度スケール差とその補正
CO2、CH4、COの測定値は機関間に大きな違いがあり、WMOによるデータの統合目標 の濃度範囲(CO2は± 0.1ppm、CH4は± 2ppb、COは± 2ppb)を超える差が認められ
ix
た(図―V の上段)。これらの差は日本の各機関が独自に保有する濃度標準スケールの違 いを主に反映しており、機関間の測定値の違いを比較解析することによって濃度スケール 差に系統的な関係があることが把握できた。これらの関係を用いて、基準となるスケール の差を補正した結果、 各機関の測定濃度が WMO のデータ統合目標の範囲内にほぼ収束 することが分かった(図―V の下段)。これによって、日本の主要な観測機関の観測デー タを高精度で統合する方法が確立できた。
図-V CO2、CH4、COのスケール補正前(上段)と補正後(下段)の測定データの差の分布。赤線は、WMOが目標と するデータの統合目標の濃度範囲(CO2は± 0.1ppm、CH4は± 2ppb、COは±2ppb)。
N2O については、従来の GC/ECD 法による比較実験では、WMO が掲げる観測データ の統合目標(± 0.1ppb)で、濃度スケールの差を正確に補正するのは困難であることが 確認された。これは世界の観測ネットワークでも十分に達成されていない重要な課題であ
x
る。今回の実験では、次世代の高精度 N2O 観測装置である中赤外レーザー分光型分析計 による試験的な測定も報告された。さらに、N2O測定精度向上に向けた日本の連携した取 組みの継続が期待される。
4)メタン・スケールの妥当性
日本の各機関が独自に保有する CH4 の濃度スケールは、WMO の世界基準(WMO
X2004 スケール)に依るJMA の値に対して濃度依存性をもった違いがあることが明瞭に
示された(図―VI)。この傾向は、NMIJ による質量比混合法で決定された標準ガス濃度 とも整合的であった。濃度スケールの差異は、1800-1900ppb の濃度範囲で 2~4ppb、
2000-2300ppbの濃度範囲で4~6ppb程度と評価された。この結果は、世界基準となっ ているWMOスケールのより確度の高い改訂が必要であることを示す重要な知見と言える。
図-VI WMO X2004スケールに依るJMAと各機関のCH4測定値の差と濃度の関係。図中のデータは、iceGGO- 1(CH4)、iceGGO-6(CH4)、NOAA-ICP(CH4)における測定結果を用いた。
xi 5)二酸化炭素測定の器差(同位体効果)
全参加機関が採用している化石燃料起源 CO2 から調製した標準ガスを用いて大気試料 の CO2 濃度を測定する際、NDIR 分析計固有の器差が生じ、その幅は-0.18ppm~
+0.08ppm と評価された(図―VII)。器差の主な要因の一つとして、標準ガスと測定試
料の同位体組成の違いが影響を与えていることが解析された。各機関のNDIRについては
13CO2 の測定結果が得られ、器差を低減するためのデータ補正に有効に活用できることが 分かった。
図-VII CO2測定におけるNDIRの器差評価の結果。器差は、各機関の濃度スケールをNIESスケールに変換した CO2測定値を算出した後、同位体補正をしたNIESの測定値と比較した際に生じる濃度差と定義した。
xii
Abstract
The Office for Coordination of Climate Change Observation in Japan has established a national alliance of the laboratories of seven organizations: the Japan Meteorological Agency, the Tohoku University, the National Institute for Environmental Studies, the National Institute of Advanced Industrial Science and Technology, the National Institute of Polar Research, the Meteorological Research Institute, and the National Metrology Institute of Japan. The mission of the alliance is to compare the standard gas scales used for measurements of atmospheric greenhouse gases (GHGs). Within the framework of this alliance, a working group committee (Chair: T. Nakazawa from Tohoku University) has organized and initiated a plan: InterComparison Experiments for Greenhouse Gases Observation (iceGGO). The purpose of the iceGGO is to examine the differences between the GHG standard gas scales used for atmospheric observations as well as to evaluate the consistency of the scales with the International System of Units traceable standard gases prepared by the gravimetric method of the National Metrology Institute of Japan. The iceGGO program performed six round-robin experiments for carbon dioxide (CO
2), methane (CH
4), carbon monoxide (CO), and nitrous oxide (N
2O) during the period 2012–
2016. An additional iceGGO experiment was also carried out using round-robin cylinders
provided by the National Oceanic and Atmospheric Administration. Details of experimental
methods and results for all experiments are reported herein. Throughout the seven
experiments, the iceGGO program was successful in precisely determining the differences
between the GHG standard gas scales. This report provides information that will facilitate
combining atmospheric GHG measurements made by different Japanese laboratories into
an integrated observation database based on a common standard gas scale consistent with
the compatibility criteria recommended by the World Meteorological Organization.
xiii
Table of contents
1. Introduction ... 1
2. iceGGO-1 (CH
4) ... 4
2.1. Round-robin cylinders (iceGGO-1) ... 4
2.2. Measurement methods (iceGGO-1) ... 6
2.3. Results of iceGGO-1 ... 7
3. iceGGO-2 (CO
2) ... 10
3.1. Round-robin cylinders (iceGGO-2) ... 10
3.2. Measurement methods (iceGGO-2) ... 11
3.3. Results of iceGGO-2 ... 12
4. iceGGO-3 (CO
2) ... 16
4.1. Round-robin cylinders (iceGGO-3) ... 16
4.2. Measurement methods (iceGGO-3) ... 18
4.3. Results of iceGGO-3 ... 19
5. iceGGO-4 (CO) ... 21
5.1. Round-robin cylinders (iceGGO-4) ... 21
5.2. Measurement methods (iceGGO-4) ... 22
5.3. Results of iceGGO-4 ... 23
6. iceGGO-5 (N
2O) ... 26
6.1. Round-robin cylinders (iceGGO-5) ... 26
6.2. Measurement methods (iceGGO-5) ... 27
6.3. Results of iceGGO-5 ... 28
7. iceGGO-6 (CH
4) ... 31
7.1. Round-robin cylinders (iceGGO-6) ... 31
7.2. Measurement methods (iceGGO-6) ... 32
7.3. Results of iceGGO-6 ... 33
8. NOAA-ICP ... 36
8.1. Round-robin cylinders (NOAA-ICP) ... 36
8.2. Measurement methods (NOAA-ICP) ... 37
xiv
8.3. Results of NOAA-ICP ... 40
8.3.1. Results for CO (NOAA-ICP) ... 40
8.3.2. Results for CO2 (NOAA-ICP) ... 42
8.3.3. Results for CH4 (NOAA-ICP) ... 44
8.3.4. Results for N2O (NOAA-ICP) ... 45
9. Discussion ... 47
9.1. Measurement precisions ... 47
9.2. CH4 scale adjustment ... 49
9.3. CO scale adjustment ... 53
9.4. CO2 scale adjustment ... 57
9.5. CO2 isotope effect ... 60
9.6. N2O scale adjustment ... 66
Acknowledgements ... 67
References ... 68
1
1. Introduction
Carbon dioxide (CO
2) and other greenhouse gases (GHGs) in the atmosphere have been increasing since the beginning of the industrial age due to the rapid growth of human activities. There is now sufficient scientific evidence to show that this increase in atmospheric GHGs is the main cause of the observed global warming and changes in climate. How well we can predict the future state of the earth therefore depends very much on how well we understand the global cycle of GHGs. The major approach of this study has been to examine the detailed temporal and spatial variations of the concentrations of GHGs in the atmosphere.
Monitoring of the atmospheric burden of CO
2was initiated at Mauna Loa on Hawaii and at the South Pole on Antarctica more than half a century ago. Since then, the observing system has been expanded to include other GHGs and many sites worldwide (e.g., WMO, 2016a). Estimating sources and sinks with various top-down inverse calculation methodologies is an essential use of the observation data, and for that purpose, measurements made by different laboratories must be combined into an integrated measurement database to expand spatial and temporal coverage. A fundamental requirement for the GHG observations is careful and continuous calibration of measuring devices, including intercomparisons of calibration scales among different laboratories.
To compare the standard gas scales used for measurements of GHGs in Japan, the
Office for Coordination of Climate Change Observation (OCCCO) established a national
alliance with six observation laboratories of the Japan Meteorological Agency (JMA),
2
Tohoku University (TU), National Institute for Environmental Studies (NIES), National Institute of Advanced Industrial Science and Technology (AIST), National Institute of Polar Research (NIPR), and the Meteorological Research Institute (MRI). The National Metrology Institute of Japan (NMIJ), which is part of the AIST, also participated this alliance under the collaboration with two international organizations, the World Meteorological Organization (WMO) and le Comité International des Poids et Mesures (CIPM). Within the framework of this alliance, a working group committee (Chair: T.
Nakazawa from TU) was organized in 2012 and has initiated a program designated InterComparison Experiments for Greenhouse Gases Observation (iceGGO). The purpose of the iceGGO is to compare the standard gas scales used by observation laboratories as well as to evaluate their consistency with the International System of Units (SI) traceable standard gases. For this purpose, the NMIJ prepared standard gases with a gravimetric method according to ISO 6142:2001; the concentrations of the standard gases are calculated from the weight of the filled gases, the concentrations of the components in the filled gases, and the molar masses of the components. The uncertainties of the fractions computed with the gravimetric method are calculated based on propagation of uncertainty.
Six round-robin experiments for CO
2, methane (CH
4), carbon monoxide (CO), and
nitrous oxide (N
2O) were performed for the iceGGO program during 2012–2016. An
additional intercomparison experiment was made using round-robin cylinders provided by
Dr. Paul Novelli of the National Oceanic and Atmospheric Administration (NOAA)
(Novelli, 2016). Details of the experimental methods and results for all experiments are
reported here, although some of them have been published elsewhere (Takahashi et al.,
3
2013, 2014; Kawasaki et al, 2016; Tsuboi et al., 2016). More information about analytical method is available on referring to publications of TU (Tanaka et al., 1983; Aoki et al., 1992; Machida et al., 1995; Yashiro et al., 2009), AIST (Aoki et al., 1992; Murayama et al., 2003; Murayama et al., 2010), NIES (Machida et al., 2008; Machida et al., 2011;
Katsumata et al., 2011), JMA (Matsueda et al., 2004a; Matsueda et al., 2004b; Tsuboi et al., 2013), and MRI (Matsueda, 1993; Matsueda and Inoue, 1996; Matsueda et al., 1998).
Throughout the seven iceGGO experiments, our aim has been to achieve the WMO recommended compatibility goal of measurements within ±0.1 ppm for CO
2(Northern Hemisphere), ±2 ppb for CH
4, ±2 ppb for CO, and ±0.1 ppb for N
2O (WMO, 2016b).
In accord with a report of the WMO (2016b), the following definitions and units have been used throughout this document. Mole fractions of substances in dry air (dry air includes ALL gaseous species except water):
ppm = μmol/mol = 10
–6mole of trace substance per mole of dry air
ppb = nmol/mol = 10
–9mole of trace substance per mole of dry air
In addition, we have used the term “concentration” instead of “amount-of-substance
fraction” because we are concerned about communicating with the general public, and the
latter term is unfamiliar to most members of the general public. We have reported
concentrations and their associated analytical precisions from all laboratories in all tables to
the same number of figures; in some cases this was accomplished by rounding off.
4
Isotopic ratio measurement results are here expressed as deviations from an agreed- upon international reference measurement standard in per mil (‰) units. δ
13C and δ
18O of CO
2are defined as follows:
( ) ( )
1 1000st 12 13
sa 12 13
13 ×
−
=
C C
C C
δ C
, (1)
( )
( )
1 100016 st 18
16 sa 18
18 ×
−
= O O O O
δ O
, (2)
where the subscripts sa and st denote the sample and the standard, respectively. In this study, all measured δ
13C and δ
18O values of CO
2are reported based on the Vienna Pee Dee Belemnite (VPDB) scale.
2. iceGGO-1 (CH
4)
2.1. Round-robin cylinders (iceGGO-1)
The first experiment (2012–2013), the iceGGO-1, focused on a comparison of CH
4standard gas scales by circulating high-pressure gas cylinders. Details of the six sample
cylinders used in this round-robin experiment are listed in Table 1. Four cylinders were
commercially available CH
4standard gases, which were filled by Japan Fine Products (JFP;
5
formerly Nippon Sanso Corporation, Japan). These four gases were prepared using purified natural air as a matrix gas, and their CH
4concentrations ranged from ~1660 ppb to ~1920 ppb. Two of the four cylinders (CPB13002 and CPB13003) had been used previously by the JMA during 2008–2011 for the third round-robin experiment of the Global Atmosphere Watch (GAW) World Calibration Centre (WCC) for CH
4in Asia and the southwest Pacific region (http://ds.data.jma.go.jp/wcc/ch4/rusult_3rd.html). The other two standard gases (CPB28218 and CPB28042), with CH
4concentrations of about 1810 ppb and 2240 ppb, were prepared gravimetrically with a four-step dilution from pure N
2, O
2, Ar, and CO
2, and CH
4(Table 2). These gases are SI-traceable standards prepared by the gravimetric method of the NMIJ. The expanded uncertainties of the gravimetric values, ~1.3 ppb (k = 2), were associated mainly with the determination of the concentration of CH
4in the matrix gases (pure O
2and N
2). Details of the NMIJ gravimetric method have been reported elsewhere (Flores et al., 2015).
Table 1. The six cylinders used for the iceGGO-1.
Cylinder Identification
CH4 Concentration
(ppb) Matrix gas Manufacturer Filling
method Date of filling CPB13002 1664.2* Purified natural air JFP Gravimetric April, 1, 2008 CPB00786 1779.6* Purified natural air JFP Gravimetric November 16, 1999 CPB13003 1844.8* Purified natural air JFP Gravimetric April, 1, 2008 CPB00787 1918.8* Purified natural air JFP Gravimetric November 16, 1999 CPB28218 1813.8** Synthetic air$ NMIJ Gravimetric May 31 - June 1, 2012 CPB28042 2240.1** Synthetic air$ NMIJ Gravimetric September 4-6, 2012
*Measured by JMA
**Gravimetric value from NMIJ
$Detailed composition in Table 2
6
Table 2. Details of the compositions of two cylinders prepared with the NMIJ gravimetric method. These values were calculated according to ISO-6142:2001. The numbers after the ± symbols indicate the expanded uncertainty (k = 2).
2.2. Measurement methods (iceGGO-1)
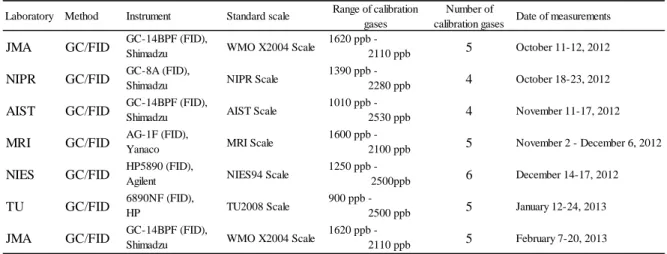
Six laboratories (JMA, NIPR, AIST, MRI, NIES, and TU) participated in the iceGGO-1 round-robin experiment from October 2012 to February 2013. Table 3 provides details of the CH
4analytical methods used by the six laboratories. All participants used a gas chromatograph equipped with a flame ionization detector (GC/FID) to measure CH
4concentrations; the instruments, however, differed between laboratories. Five laboratories carried out the measurements using different standard gas scales (NIPR, AIST, MRI, NIES94, and TU2008), which were independently developed and maintained for a long period of time. In contrast, the JMA measurements were based on the WMO X2004 scale, which has been propagated from the Global Monitoring Division (GMD) of the NOAA Earth System Research Laboratory (Dlugokencky et al., 2005; Tsuboi et al., 2016). The calibration gases used by the NIPR, AIST, NIES, and TU cover a relatively wide range of CH
4concentrations, whereas the range of the JMA and MRI calibration gases was not wide enough to measure the highest concentration in the round-robin cylinder. To evaluate the
Cylinder Identification
CH4 ppm
CO2 ppm
N2 ppm
O2 ppm
Ar ppm CPB28218 1.81381
±0.00133
390.209
±0.092
774381
±6.68
215882
±6.82
9344.69
±0.7579 CPB28042 2.24013
±0.00134
390.677
±0.087
773710
±6.31
216277
±6.43
9619.48
±0.7198
7
drift of the CH
4concentration during the experimental period, the JMA measured all cylinders at the beginning and end of the round-robin experiment.
2.3. Results of iceGGO-1
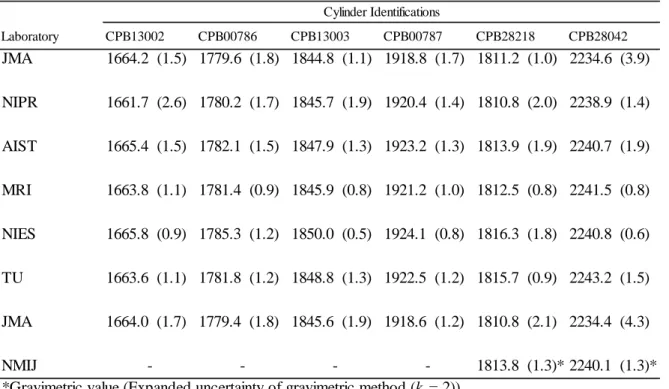
The CH
4concentrations in the six gas cylinders reported by the six laboratories are given in Table 4. The analytical precision of most of the measurements from all laboratories was less than ~2 ppb. The relatively large analytical precision reported by the JMA for the cylinder with the highest CH
4concentration reflects extrapolation of the calibration curve.
The JMA measurements showed that the differences in concentrations between the beginning and end of the experiment for all four cylinders were less than 0.8 ppb, which is smaller than the JMA analytical precision. Thus, no correction for drift during the experimental period has been applied to the concentrations reported by the laboratories.
Table 3. The six laboratories and the analytical methods, instruments, and calibration scales they used to measure CH4
during the iceGGO-1 experiment.
Laboratory Method Instrument Standard scale Range of calibration gases
Number of
calibration gases Date of measurements JMA GC/FID GC-14BPF (FID),
Shimadzu WMO X2004 Scale 1620 ppb -
2110 ppb 5 October 11-12, 2012 NIPR GC/FID GC-8A (FID),
Shimadzu NIPR Scale 1390 ppb -
2280 ppb 4 October 18-23, 2012 AIST GC/FID GC-14BPF (FID),
Shimadzu AIST Scale 1010 ppb -
2530 ppb 4 November 11-17, 2012 MRI GC/FID AG-1F (FID),
Yanaco MRI Scale 1600 ppb -
2100 ppb 5 November 2 - December 6, 2012 NIES GC/FID HP5890 (FID),
Agilent NIES94 Scale 1250 ppb -
2500ppb 6 December 14-17, 2012 TU GC/FID 6890NF (FID),
HP TU2008 Scale 900 ppb -
2500 ppb 5 January 12-24, 2013 JMA GC/FID GC-14BPF (FID),
Shimadzu WMO X2004 Scale 1620 ppb -
2110 ppb 5 February 7-20, 2013
8
Table 4. CH4 concentrations (ppb) reported by the indicated laboratories as a part of the iceGGO-1. Reported analytical precisions are indicated in parentheses.
Figure 1 shows the differences between the CH
4concentrations measured in the six round-robin cylinders by each laboratory (Laboratory X) and by the JMA. The differences (Laboratory X minus JMA) among the laboratories ranged from –2 ppb to +9 ppb. This range of differences reflects mainly differences in the reference CH
4standard scales among the laboratories. The differences of the concentrations reported by all five laboratories and the JMA concentrations clearly increased with increasing CH
4concentration. These increased differences often exceeded the criterion for compatibility of CH
4measurements (±2 ppb) recommended by the WMO (WMO, 2016b). The gravimetric values determined by ISO 6142:2001 for the two cylinders were higher than the JMA measurements based on
Laboratory CPB13002 CPB00786 CPB13003 CPB00787 CPB28218 CPB28042
JMA 1664.2 (1.5) 1779.6 (1.8) 1844.8 (1.1) 1918.8 (1.7) 1811.2 (1.0) 2234.6 (3.9) NIPR 1661.7 (2.6) 1780.2 (1.7) 1845.7 (1.9) 1920.4 (1.4) 1810.8 (2.0) 2238.9 (1.4) AIST 1665.4 (1.5) 1782.1 (1.5) 1847.9 (1.3) 1923.2 (1.3) 1813.9 (1.9) 2240.7 (1.9) MRI 1663.8 (1.1) 1781.4 (0.9) 1845.9 (0.8) 1921.2 (1.0) 1812.5 (0.8) 2241.5 (0.8) NIES 1665.8 (0.9) 1785.3 (1.2) 1850.0 (0.5) 1924.1 (0.8) 1816.3 (1.8) 2240.8 (0.6) TU 1663.6 (1.1) 1781.8 (1.2) 1848.8 (1.3) 1922.5 (1.2) 1815.7 (0.9) 2243.2 (1.5) JMA 1664.0 (1.7) 1779.4 (1.8) 1845.6 (1.9) 1918.6 (1.2) 1810.8 (2.1) 2234.4 (4.3)
NMIJ - - - - 1813.8 (1.3)* 2240.1 (1.3)*
Cylinder Identifications
*Gravimetric value (Expanded uncertainty of gravimetric method (k = 2))
9
the WMO X2004 scale. The differences between the two gravimetric scales tended to increase with increasing CH
4concentration. These results agree well with the difference between the NMIJ and WMO X2004 scales for the CCQM-K82 comparison as a part of the CIPM program (Flores et al., 2015). Tsuboi et al. (2016) have reported more details about the differences between the two scales.
Figure 1. Differences (Laboratory X minus the JMA) of CH4 concentrations for each round-robin cylinder measured as a part of the iceGGO-1. The error bars represent the ± measurement precision reported by each laboratory, although the error bar of the NMIJ indicates the ± expanded uncertainty of the gravimetric method (k = 2). The dashed lines around the zero line identify the WMO recommended criterion (±2 ppb) for CH4 measurement compatibility.
10
3. iceGGO-2 (CO
2)
3.1. Round-robin cylinders (iceGGO-2)
The second experiment (2012), the iceGGO-2, focused on a comparison of CO
2standard gas scales by circulating high-pressure cylinders. Details of the nine sample cylinders used for this round-robin experiment are listed in Table 5. Six cylinders filled by JFP using a volumetric method were provided by TU for the iceGGO-2 experiment. These six cylinders were prepared using purified natural air as a matrix gas, and their CO
2concentrations ranged from about 340 ppm to 409 ppm. The parent CO
2gas in these cylinders was derived from combusted petroleum; the δ
13C values of their CO
2were deduced to be around –30 ‰.
Three other cylinders containing relatively high
13CO
2concentrations were provided by NIES to examine isotope effects of CO
2analyzers, because such effects would confound interpretation of apparent differences in the isotopic compositions of round-robin samples and calibration gases. Two cylinders (CPB16443 and CPB29524) were filled with dry natural air, including CO
2at concentrations of about 405 ppm and 410 ppm, respectively.
The δ
13C values of the CO
2in these cylinders were measured by the NIES to be –8.8 ‰ and –9.0 ‰, respectively. A third cylinder (CPB28548) was specially prepared using an enriched
13CO
2gas ( δ
13C = +57.3 ‰) in purified natural air with a CO
2concentration of
~370 ppm (Tohjima et al., 2009).
11 Table 5. The nine cylinders used in the iceGGO-2 experiment.
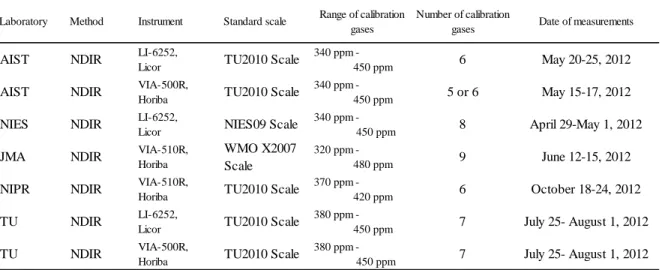
3.2. Measurement methods (iceGGO-2)
Five laboratories (AIST, NIES, JMA, NIPR, and TU) participated in the iceGGO-2 round-robin experiment from May to August 2012. Table 6 provides details of the CO
2analytical methods used by the five laboratories. All participants used a non-dispersive infrared (NDIR) analyzer to measure CO
2concentrations. However, the models of the NDIR instruments differed: the AIST, NIES, and TU used a LI-6252 model (LI-COR); the AIST and TU used a model VIA-500R (Horiba); and the JMA and NIPR used a model VIA-510R (Horiba).
The JMA measurements were based on the WMO X2007 scale (Zhao and Tans, 2006), which has been propagated from the NOAA/GMD. The NDIR analyzers differ from the JMA and NOAA, although no consideration is given to associated isotope effects on the WMO scale transfer from the NOAA to the JMA. Three laboratories, TU, AIST, and NIPR,
Cylinder Identification
CO2 Concentration*
(ppm) Matrix gas Manufacturer Filling
method
δ13C of CO2
(‰) CPB10204 339.93 Purified natural air JFP Volumetric
CPB10206 369.80 Purified natural air JFP Volumetric CPB10208 390.02 Purified natural air JFP Volumetric CPB10210 409.91 Purified natural air JFP Volumetric CPB10213 429.72 Purified natural air JFP Volumetric CPB10216 449.95 Purified natural air JFP Volumetric
CPB28548 370.06 Purified natural air NIES +57.3&
CPB16443 406.02 Dry natural air NIES -8.8#
CPB29524 409.31 Dry natural air NIES -9.0#
*Measured by NIES
#Measured by Cavity Ring-Down Spectroscopy (CRDS) of NIES
&
Measured by isotope ratio mass spectrometry (IRMS) of NIES (Tohjima et al., 2009)
12
used the same TU2010 scale, which was developed recently by the TU. The NIES09 scale was based on eight cylinders prepared by a one-step dilution method with a precision of 0.04 ppm (Machida et al., 2011). All laboratories used a gas mixture that included CO
2derived from combustion of fossil fuel ( δ
13C of about –30 ‰) in purified natural air as a calibration gas.
Table 6. The five laboratories and the analytical methods, instruments, and calibration scales they used to measure CO2
during the iceGGO-2 experiment.
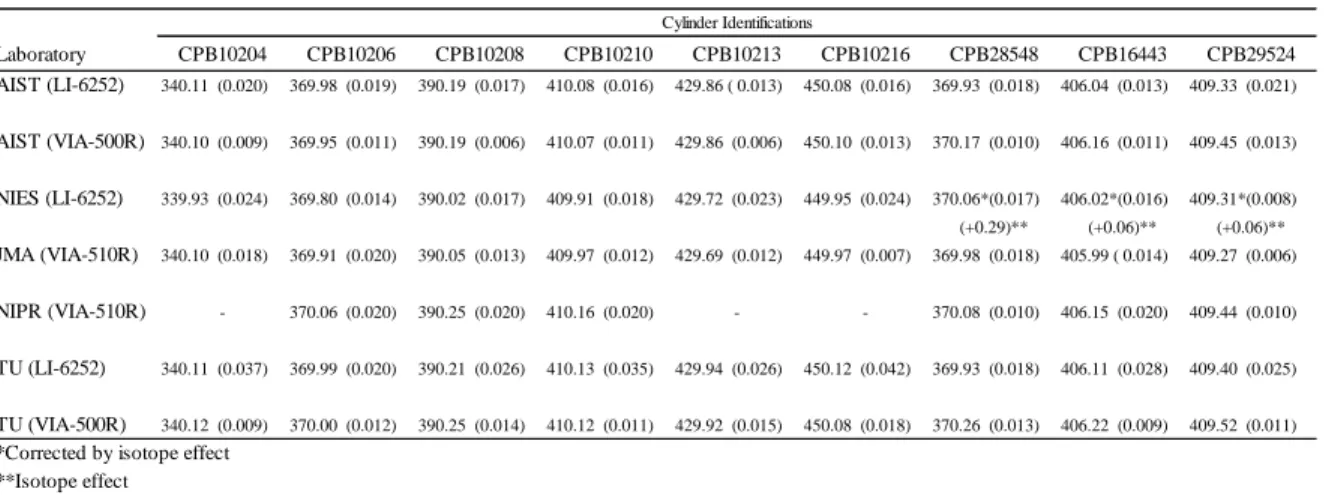
3.3. Results of iceGGO-2
Table 7 summarizes the CO
2concentrations measured in the nine round-robin cylinders by five laboratories using three different NDIR models. The analytical precision of most of the measurements in all laboratories was less than 0.04 ppm, although the TU and AIST results indicated that the precision was higher for measurements made with the VIA-500R than with the LI-6252. The TU assayed six cylinders containing combusted
Laboratory Method Instrument Standard scale Range of calibration gases
Number of calibration
gases Date of measurements
AIST NDIR LI-6252,
Licor TU2010 Scale 340 ppm -
450 ppm 6 May 20-25, 2012
AIST NDIR VIA-500R,
Horiba TU2010 Scale 340 ppm -
450 ppm 5 or 6 May 15-17, 2012
NIES NDIR LI-6252,
Licor NIES09 Scale 340 ppm -
450 ppm 8 April 29-May 1, 2012
JMA NDIR VIA-510R,
Horiba
WMO X2007 Scale
320 ppm -
480 ppm 9 June 12-15, 2012
NIPR NDIR VIA-510R,
Horiba TU2010 Scale 370 ppm -
420 ppm 6 October 18-24, 2012
TU NDIR LI-6252,
Licor TU2010 Scale 380 ppm -
450 ppm 7 July 25- August 1, 2012
TU NDIR VIA-500R,
Horiba TU2010 Scale 380 ppm -
450 ppm 7 July 25- August 1, 2012
13
petroleum CO
2at both the beginning and the end of the experiment to evaluate the stabilities of the CO
2contents during the experimental period. No significant drift of CO
2concentration was observed in any of the six cylinders. The results for three other cylinders examined by the NIES were found to be stable during the experimental period. Thus, no correction for drift has been applied to the measurement results reported by any of the laboratories. The CO
2concentrations of three cylinders reported by the NIES were corrected for isotope effects of +0.06 ppm for CPB16443 and CPB29524 and of +0.29 ppm for CPB28548 in accord with the method of Tohjima et al. (2009). The reported values from all other laboratories, however, were not corrected for isotope effects.
Table 7. CO2 concentrations (ppm) and reported analytical precisions in parentheses during the iceGGO-2.
Figure 2 shows differences in CO
2concentrations measured by each laboratory (Laboratory X) and NIES for the six cylinders containing combusted petroleum CO
2. The differences (Laboratory X minus NIES) among the laboratories ranged from –0.03 ppm to +0.26 ppm. The differences for the TU, AIST, and NIPR exceeded +0.1 ppm, whereas the
Laboratory CPB10204 CPB10206 CPB10208 CPB10210 CPB10213 CPB10216 CPB28548 CPB16443 CPB29524 AIST (LI-6252) 340.11 (0.020) 369.98 (0.019) 390.19 (0.017) 410.08 (0.016) 429.86 ( 0.013) 450.08 (0.016) 369.93 (0.018) 406.04 (0.013) 409.33 (0.021) AIST (VIA-500R) 340.10 (0.009) 369.95 (0.011) 390.19 (0.006) 410.07 (0.011) 429.86 (0.006) 450.10 (0.013) 370.17 (0.010) 406.16 (0.011) 409.45 (0.013)
NIES (LI-6252) 339.93 (0.024) 369.80 (0.014) 390.02 (0.017) 409.91 (0.018) 429.72 (0.023) 449.95 (0.024) 370.06*(0.017) 406.02*(0.016) 409.31*(0.008) (+0.29)** (+0.06)** (+0.06)**
JMA (VIA-510R) 340.10 (0.018) 369.91 (0.020) 390.05 (0.013) 409.97 (0.012) 429.69 (0.012) 449.97 (0.007) 369.98 (0.018) 405.99 ( 0.014) 409.27 (0.006) NIPR (VIA-510R) - 370.06 (0.020) 390.25 (0.020) 410.16 (0.020) - - 370.08 (0.010) 406.15 (0.020) 409.44 (0.010) TU (LI-6252) 340.11 (0.037) 369.99 (0.020) 390.21 (0.026) 410.13 (0.035) 429.94 (0.026) 450.12 (0.042) 369.93 (0.018) 406.11 (0.028) 409.40 (0.025)
TU (VIA-500R) 340.12 (0.009) 370.00 (0.012) 390.25 (0.014) 410.12 (0.011) 429.92 (0.015) 450.08 (0.018) 370.26 (0.013) 406.22 (0.009) 409.52 (0.011)
*Corrected by isotope effect
Cylinder Identifications
**Isotope effect
14
difference between the JMA and NIES depended largely on the CO
2concentration. The concentrations measured with the two different instruments (VIA-500R and LI-6252) by the TU and AIST were in good agreement, although there was a small systematic difference (less than ~0.05ppm) between the two laboratories. These results mainly reflect differences in the standard gas scales for the CO
2calibrations among the laboratories. Isotope effects are ruled out because the same combusted petroleum CO
2was the CO
2source in both the round-robin samples and the calibration gas cylinders.
Figure 2. Differences (Laboratory X minus NIES) of CO2 concentrations for six round-robin cylinders measured for the iceGGO-2. The error bars represent the ± measurement precision reported by each laboratory. The dashed lines around the zero line identify the WMO criterion (±0.1 ppm) in the Northern Hemisphere for network compatibility.
15
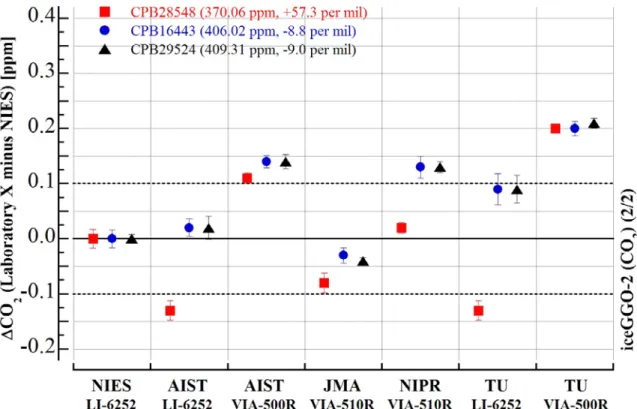
Figure 3 shows differences in CO
2concentrations measured by each laboratory (Laboratory X) and the NIES for natural air samples in the CPB16443 and CPB29524 cylinders and the CPB28548 (
13CO
2enriched) cylinder. The isotopic compositions of CO
2in these three cylinders were different from those in the CO
2calibration gases used in all laboratories to examine the isotope effect on the NDIR analysis. The differences (Laboratory X minus NIES) among the laboratories and NDIR models ranged from –0.15 ppm to +0.21 ppm in these three cylinders. The measurements of the two natural air sample cylinders agreed well within the analytical precision in all laboratories. However, there was a large difference (±0.1 ppm) between the concentrations determined with the VIA-500R and LI-6252 analyzers for two natural air samples analyzed by the TU and AIST. The deviations of the analyses were larger for the enriched
13CO
2sample cylinder than for the two natural air sample cylinders. These results reflect not only differences in CO
2calibration standard scales but also isotope effects associated with the NDIR models.
16
Figure 3. Differences (Laboratory X minus NIES) of CO2 concentrations for three round-robin cylinders measured for the iceGGO-2. The error bars represent the ± measurement precisions reported by each laboratory. The dashed lines around the zero line identify the WMO criterion (±0.1 ppm) in the Northern Hemisphere for network compatibility.
4. iceGGO-3 (CO
2)
4.1. Round-robin cylinders (iceGGO-3)
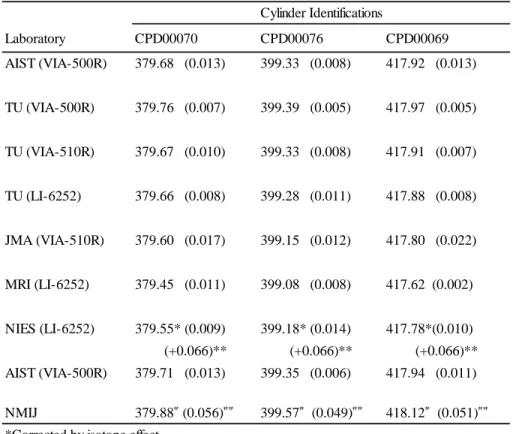
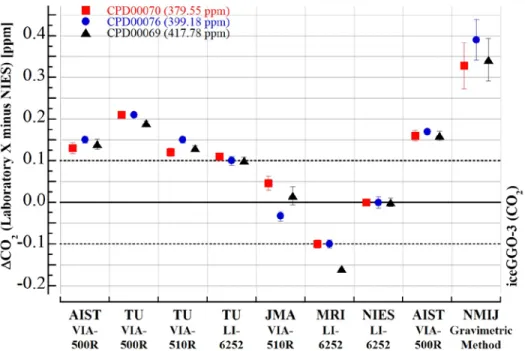
The third experiment (iceGGO-3), which took place in 2014, was a comparison of CO
2concentrations in high-pressure cylinders. Table 8 provides details about the three sample cylinders used in the round-robin experiment. The samples in these three cylinders contained CO
2at concentrations of about 380 ppm, 400 ppm, and 418 ppm, respectively.
The samples were prepared from pure CO
2and purified natural air with a three-step
17
dilution by the gravimetric method in accordance with ISO 6142:2001 during the time interval from November 28, 2013, to December 19, 2013. At each step of the dilution, three mixtures were prepared. The CO
2concentrations at each step were 60000 ppm, 5000 ppm, and 400 ppm. The purity of the CO
2and the concentrations of N
2, O
2, and Ar in the purified natural air were determined by gas chromatography, Fourier-transform infrared spectrometry and so on. The expanded uncertainty of the CO
2gravimetric values, about 0.05 ppm, was associated mainly with weighing the filling gas. The δ
13C and δ
18O values of the pure CO
2used to prepare these gases, determined precisely by isotope ratio mass spectrometry (IRMS) at the AIST and TU, were about –8.9 ‰ and –13 ‰, respectively.
This isotopic composition differed from that of the calibration gases prepared with combusted petroleum CO
2(around –30 ‰ for δ
13CO
2) that was used for measurements by all participants.
Table 8. Mean concentrations of gases in the three cylinders used for CO2 analyses during the iceGGO-3. The numbers after the ± symbols indicate the expanded uncertainty (k = 2).
Cylinder Identification
CO2
ppm
N2
ppm
O2
ppm
Ar ppm
δ13C(CO2)*
‰
δ13C(CO2)**
‰
δ18O(CO2)*
‰
δ18O(CO2)**
‰ CPD00070 379.88
±0.056
781049 ±24
209214 ±16
9357 ±18
-8.907
±0.012
-8.881
±0.024
-13.099 ±0.011
-13.006 ±0.056 CPD00076 399.57
±0.049
781044 ±29
209209 ±16
9347 ±24
-8.964
±0.012
-8.874
±0.024
-13.173 ±0.022
-13.064 ±0.027 CPD00069 418.12
±0.051
781017 ±24
209209 ±15
9356 ±18
-8.908
±0.006
-8.897
±0.018
-13.088 ±0.012
-13.048 ±0.011
*Measured by IRMS of AIST
**Measured by IRMS of TU
18
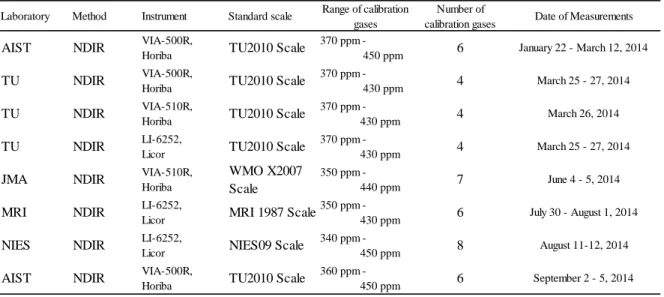
4.2. Measurement methods (iceGGO-3)
Five laboratories (AIST, TU, JMA, MRI, and NIES) participated in the iceGGO-3 round-robin experiment from January to September 2014. Table 9 lists the participating laboratories and details of their CO
2analytical methods.
All participants used a NDIR analyzer to measure CO
2concentrations, but the models of the NDIR instruments differed. The TU used three different NDIR models: VIA-500R (Horiba), VIA-510R (Horiba), and LI-6252 (LI-COR). The other laboratories used only one NDIR model for the CO
2measurements. The CO
2scales were different from each other (Table 9). To check for CO
2concentration drift during the experimental period, the AIST measured the CO
2concentrations in all cylinders at both the beginning and the end of the round-robin experiment.
Table 9. The five laboratories and their analytical methods, instruments, and calibration scales for CO2 during the iceGGO-3.
Laboratory Method Instrument Standard scale Range of calibration gases
Number of
calibration gases Date of Measurements
AIST NDIR VIA-500R,
Horiba TU2010 Scale 370 ppm -
450 ppm 6 January 22 - March 12, 2014
TU NDIR VIA-500R,
Horiba TU2010 Scale 370 ppm -
430 ppm 4 March 25 - 27, 2014
TU NDIR VIA-510R,
Horiba TU2010 Scale 370 ppm -
430 ppm 4 March 26, 2014
TU NDIR LI-6252,
Licor TU2010 Scale 370 ppm -
430 ppm 4 March 25 - 27, 2014
JMA NDIR VIA-510R,
Horiba
WMO X2007 Scale
350 ppm -
440 ppm 7 June 4 - 5, 2014
MRI NDIR LI-6252,
Licor MRI 1987 Scale350 ppm -
430 ppm 6 July 30 - August 1, 2014
NIES NDIR LI-6252,
Licor NIES09 Scale 340 ppm -
450 ppm 8 August 11-12, 2014
AIST NDIR VIA-500R,
Horiba TU2010 Scale 360 ppm -
450 ppm 6 September 2 - 5, 2014
19