16
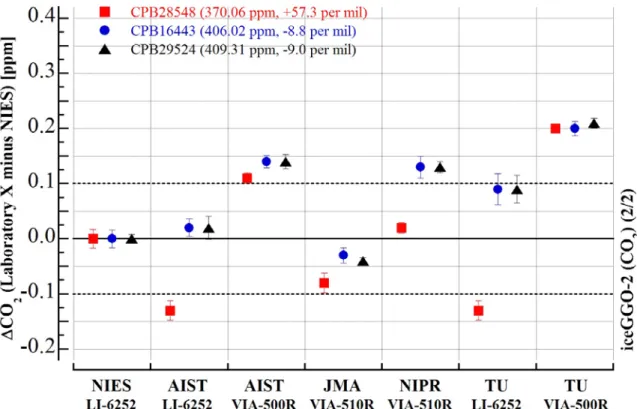
Figure 3. Differences (Laboratory X minus NIES) of CO2 concentrations for three round-robin cylinders measured for the iceGGO-2. The error bars represent the ± measurement precisions reported by each laboratory. The dashed lines around the zero line identify the WMO criterion (±0.1 ppm) in the Northern Hemisphere for network compatibility.
4. iceGGO-3 (CO
2)
4.1. Round-robin cylinders (iceGGO-3)
The third experiment (iceGGO-3), which took place in 2014, was a comparison of CO
2concentrations in high-pressure cylinders. Table 8 provides details about the three sample cylinders used in the round-robin experiment. The samples in these three cylinders contained CO
2at concentrations of about 380 ppm, 400 ppm, and 418 ppm, respectively.
The samples were prepared from pure CO
2and purified natural air with a three-step
17
dilution by the gravimetric method in accordance with ISO 6142:2001 during the time interval from November 28, 2013, to December 19, 2013. At each step of the dilution, three mixtures were prepared. The CO
2concentrations at each step were 60000 ppm, 5000 ppm, and 400 ppm. The purity of the CO
2and the concentrations of N
2, O
2, and Ar in the purified natural air were determined by gas chromatography, Fourier-transform infrared spectrometry and so on. The expanded uncertainty of the CO
2gravimetric values, about 0.05 ppm, was associated mainly with weighing the filling gas. The δ
13C and δ
18O values of the pure CO
2used to prepare these gases, determined precisely by isotope ratio mass spectrometry (IRMS) at the AIST and TU, were about –8.9 ‰ and –13 ‰, respectively.
This isotopic composition differed from that of the calibration gases prepared with combusted petroleum CO
2(around –30 ‰ for δ
13CO
2) that was used for measurements by all participants.
Table 8. Mean concentrations of gases in the three cylinders used for CO2 analyses during the iceGGO-3. The numbers after the ± symbols indicate the expanded uncertainty (k = 2).
Cylinder Identification
CO2
ppm
N2
ppm
O2
ppm
Ar ppm
δ13C(CO2)*
‰
δ13C(CO2)**
‰
δ18O(CO2)*
‰
δ18O(CO2)**
‰ CPD00070 379.88
±0.056
781049 ±24
209214 ±16
9357 ±18
-8.907
±0.012
-8.881
±0.024
-13.099 ±0.011
-13.006 ±0.056 CPD00076 399.57
±0.049
781044 ±29
209209 ±16
9347 ±24
-8.964
±0.012
-8.874
±0.024
-13.173 ±0.022
-13.064 ±0.027 CPD00069 418.12
±0.051
781017 ±24
209209 ±15
9356 ±18
-8.908
±0.006
-8.897
±0.018
-13.088 ±0.012
-13.048 ±0.011
*Measured by IRMS of AIST
**Measured by IRMS of TU
18
4.2. Measurement methods (iceGGO-3)
Five laboratories (AIST, TU, JMA, MRI, and NIES) participated in the iceGGO-3 round-robin experiment from January to September 2014. Table 9 lists the participating laboratories and details of their CO
2analytical methods.
All participants used a NDIR analyzer to measure CO
2concentrations, but the models of the NDIR instruments differed. The TU used three different NDIR models: VIA-500R (Horiba), VIA-510R (Horiba), and LI-6252 (LI-COR). The other laboratories used only one NDIR model for the CO
2measurements. The CO
2scales were different from each other (Table 9). To check for CO
2concentration drift during the experimental period, the AIST measured the CO
2concentrations in all cylinders at both the beginning and the end of the round-robin experiment.
Table 9. The five laboratories and their analytical methods, instruments, and calibration scales for CO2 during the iceGGO-3.
Laboratory Method Instrument Standard scale Range of calibration gases
Number of
calibration gases Date of Measurements
AIST NDIR VIA-500R,
Horiba TU2010 Scale 370 ppm -
450 ppm 6 January 22 - March 12, 2014
TU NDIR VIA-500R,
Horiba TU2010 Scale 370 ppm -
430 ppm 4 March 25 - 27, 2014
TU NDIR VIA-510R,
Horiba TU2010 Scale 370 ppm -
430 ppm 4 March 26, 2014
TU NDIR LI-6252,
Licor TU2010 Scale 370 ppm -
430 ppm 4 March 25 - 27, 2014
JMA NDIR VIA-510R,
Horiba
WMO X2007 Scale
350 ppm -
440 ppm 7 June 4 - 5, 2014
MRI NDIR LI-6252,
Licor MRI 1987 Scale350 ppm -
430 ppm 6 July 30 - August 1, 2014
NIES NDIR LI-6252,
Licor NIES09 Scale 340 ppm -
450 ppm 8 August 11-12, 2014
AIST NDIR VIA-500R,
Horiba TU2010 Scale 360 ppm -
450 ppm 6 September 2 - 5, 2014
19
4.3. Results of iceGGO-3
Table 10 shows results of the CO
2analyses of the three round-robin cylinders by
five laboratories using several NDIR models together with the gravimetric values. The
precision of most of the results was less than 0.02 ppm. The AIST measurements at both the
beginning and the end of the round-robin experiment revealed a slight increase for all three
cylinders of 0.02–0.03 ppm, but this drift was not significant compared to the measurement
precisions. Thus, no correction for drift was applied to the measurement results reported by
the laboratories. The NIES measurements were corrected by the isotope effect (+0.066
ppm) in accord with Tohjima et al. (2009), but the isotope effect was not considered in the
measurements made by other laboratories.
20
Table 10. CO2 concentrations (ppm) determined during the iceGGO-3. The reported precisions are shown in parentheses.
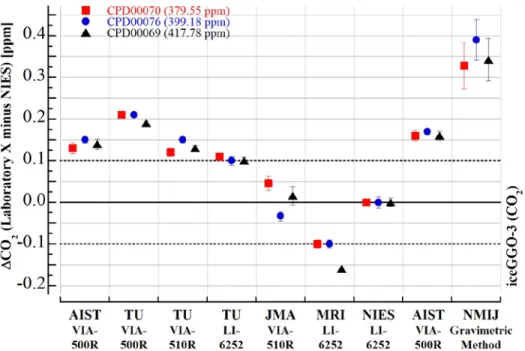
Figure 4 shows differences in the CO2 concentrations measured in the three cylinders by each laboratory (Laboratory X) and the NIES. The differences (Laboratory X minus NIES) among the laboratories and NDIR models ranged from –0.15 ppm to +0.2 ppm for the three cylinders. The gravimetric values from the NMIJ were higher than the CO2 concentrations measured by all the laboratories, but the reason for this difference is unknown. The TU measurements clearly showed a difference among the concentrations determined with the three NDIR models; the concentrations differed by about 0.1 ppm.
These results strongly reflect not only differences in the CO2 calibration standard scales but
Laboratory CPD00070 CPD00076 CPD00069
AIST (VIA-500R) 379.68 (0.013) 399.33 (0.008) 417.92 (0.013) TU (VIA-500R) 379.76 (0.007) 399.39 (0.005) 417.97 (0.005) TU (VIA-510R) 379.67 (0.010) 399.33 (0.008) 417.91 (0.007) TU (LI-6252) 379.66 (0.008) 399.28 (0.011) 417.88 (0.008) JMA (VIA-510R) 379.60 (0.017) 399.15 (0.012) 417.80 (0.022) MRI (LI-6252) 379.45 (0.011) 399.08 (0.008) 417.62 (0.002) NIES (LI-6252) 379.55* (0.009) 399.18* (0.014) 417.78*(0.010)
(+0.066)** (+0.066)** (+0.066)**
AIST (VIA-500R) 379.71 (0.013) 399.35 (0.006) 417.94 (0.011) NMIJ 379.88
#(0.056)
##399.57
#(0.049)
##418.12
#(0.051)
##Cylinder Identifications
*Corrected by isotope effect
**Isotope effect
#
Gravimetric value
##
Expanded uncertainty of gravimetric value (k = 2)
21
also isotope effects between the NDIR models. Details of the isotope effect are described in section 9.5.
Figure 4. Differences (Laboratory X minus NIES) of CO2 concentrations in three round-robin cylinders measured during the iceGGO-3. The error bars represent the ± measurement uncertainty reported by each laboratory, although the error bar for the NMIJ indicates the ± expanded uncertainty of the gravimetric method. The dashed lines around the zero line identify the WMO criterion (±0.1 ppm) in the Northern Hemisphere for network compatibility.