ID:
JJF00280
Title:
On the relationship between earnings quality and the degree of
information asymmetry:
Evidence from Japan
Author:
Ahamed Roshan Ajward
Hitoshi Takehara
Pages:
76-98
Is Part Of:
Japan Journal of Finance
Vol. 31 / No. 1
Jun. 2011
Publisher
Japan Finance Association
■大会特集論文
On the Relationship between Earnings Quality and the Degree of
Information Asymmetry: Evidence from Japan
*Ahamed Roshan AJWARD
(Waseda University)Hitoshi TAKEHARA
(Waseda University)
ABSTRACT
This research empirically investigates the relation between earnings quality and the degree of information asymmetry of listed fi rms, as earnings quality being one of the important aspects of fi nancial reporting function of a fi rm and information asymmetry a key concern in fi nancial markets. The findings indicate a negative relation between earnings quality and the degree of information asymmetry when earnings quality is proxied by using CFO Modified Jones Model (Kasznik, 1999), without controlling for alternative portfolio styles (however, not significant). Contrary to our predictions, however, we observe a positive relation between them when earnings quality is measured using Dechow and Dichev (2002) Model, which is explained as due to the stock market fluctuations during the sample period. Additionally, we also establish a positive and signifi cant relation between earnings quality and liquidity confi rming our prediction in that respect. Furthermore, the hedge portfolio test reveals that the degree of information asymmetry is weakly related with stock returns in a systematic way, without statistical signifi cance.
Key Words: Earnings quality, information asymmetry, liquidity, market microstructure, effi cient market
hypothesis.
1 Introduction
Bhattacharya et al. (2010) indicate that one of the key roles of accounting information is to provide information for effi cient capital allocation in fi nancial markets. They state that due to this fact, the determinants and consequences of quality of accounting information is of major interest for investors, corporate managers and accounting standard setters. In more specifi c terms, as one of
* The authors are grateful to an anonymous referee and Linyu Zhai, the managing editor of the journal. We also thank to Takashi Ebihara, Hiroshi Kojima, Keiichi Kubota, Yoshio Masutani, Katsuhiko Muramiya, Eiko Tsujiyama for their helpful comments on this paper.
the major constituents of accounting information, they indicate that poor earnings quality should be given much research attention in determining the costs and consequences entailed. Deriving from the conclusions of previous studies such as Glosten and Milgrom (1985), Diamond (1985) and Diamond and Verrecchia (1991), as well as empirical evidence from Sloan (1996), they indicate that poor quality of earnings could lead to an increase in asymmetry of information in fi nancial markets. Further, they indicate that even though a limited number of recent research papers investigate the negative consequences of poor earnings quality, the evidence so far is controversial and incomplete. A survey of literature on contemporary extant research on this dimension in the Japanese context is also seen as limited and inconclusive. Hence, this study explicitly takes into consideration the impact of earnings quality on the degree of information asymmetry for the fi rms listed in Tokyo Stock Exchange.
This study distinguishes itself from extant research in many dimensions. First and most importantly, the usage of a more precise proxy to measure the degree of information asymmetry is seen as a key distinguishing aspect. An investigation of contemporary studies reveals that different proxies have been used for the measurement of information asymmetry. Most often used measures are spreads based measures and probability of private informed based trades, so-called PIN variable. We use a precise adjusted version of the PIN variable to measure the degree of information asymmetry, which makes this study distinct. Further, in order to measure earnings quality, we use two well-recognized earnings quality proxies that are based on accounting accruals, i.e., CFO Modified Jones Model (Kasznik, 1999) and Dechow and Dichev – hereafter referred as D&D Model – (2002) based earnings quality proxies1.
In terms of fi ndings of the study, we observe a negative relation between earnings quality and the degree of information asymmetry, when earnings quality is proxied by abnormal accruals estimated using CFO Modifi ed Jones Model, without controlling for alternative portfolio styles, i.e., small vs. large and value vs. growth. The observation, however, is not statistically signifi cant. On the other hand, we fi nd an unexpected positive relation between the earnings quality measure based on the D&D Model and the degree of information asymmetry, which is assumed to be caused by stock market fl uctuations during the sampling period. Ancillary to the above main objective and related findings, in terms of earnings quality (measured by using both accruals based earnings quality proxies indicated above) and liquidity, we find a statistically highly significant positive relation as we had predicted. Finally, we also performed a hedge portfolio test to investigate the relation between the degree of information asymmetry with stock returns when controlled for earnings quality. While controlling for earnings quality by using the accruals based earnings quality proxies alternatively and a trading strategy based on the degree of information asymmetry, we fi nd that
1 Section 2.2 discusses the appropriateness of the usage of accrual based earnings quality proxies over other earnings quality proxies in the context of this research.
information asymmetry of the firms is weakly related with stock returns in a systematic way, although they are not statistically signifi cant.
The findings we obtained in this study are expected to be useful in understanding the role of earnings quality information (i.e., as earnings being a key element in accounting information) on the efficiency of capital markets. As indicated above, Bhattacharya et al. (2010) elaborates that quality of fi nancial information plays a key role in proper capital allocation via fi nancial markets. Therefore, in terms of policy implications, the findings of this study suggest that the quality of earnings needs to be improved for a positive effect on capital markets; and we believe that accounting standard setting could play a key role in achieving this objective.
The remainder of this paper is structured as follows. Section 2 elaborates the research outline while defi ning the key concepts and discussing previous research. The hypotheses proposed under this study are indicated in Section 3. Section 4 indicates the measures utilized under this study with a discussion on their appropriateness. Section 5 explains the main fi ndings, while Section 6 explains briefl y the fi ndings on the hedge portfolio testing. Finally, Section 7 concludes the paper.
2 Research Outline
2.1 Earnings quality and information asymmetry
Financial Accounting Standards Board (FASB, 1980) indicates the quality of accounting information from the viewpoint of decision usefulness to the users. Dechow et al. (2010) view “quality” of earnings as a function of a firm’s fundamental performance and define earnings quality as: “Higher quality earnings provide more information about the features of a firm’s fi nancial performance that are relevant to a specifi c decision made by a specifi c decision-maker” (Dechow et al., 2010, p.344). This definition emphasizes that higher quality of earnings provide “more information” on the features of the fi nancial performance of a fi rm related to a particular
decision context.
While indicating that the above defi nition is of a conceptual nature, they elaborate that they are not in a position to provide a single defi nition on what earnings quality is as “quality” depends on the “context of the decision making.” They further explain that the “fundamental performance” of a firm is not observable. Based on this discussion, it is apparent that empirical researchers have used different proxies to defi ne and measure quality of earnings depending on the “decision context” the researcher is interested. After reviewing over 300 empirical studies, they summarize that extant empirical researchers have used different earnings quality proxies such as accounting accruals, earnings persistence, smoothness, timeliness, loss avoidance, investor responsiveness, as well as external indicators such as re-statement and SEC enforcement releases, to proxy earnings quality. They indicate that these represent different dimensions (i.e., features) of the “fundamental performance” of the fi rm depending on the decision context. In this research, we are interested in the decision context related to the (information efficiency of) capital markets. Since, conceptual and empirical research indicates that accounting accruals do have value relevance and contributes
to information asymmetry in the context of capital markets; we use accounting accruals based proxies to measure earnings quality in this research (Sloan, 1996; Bhattacharya et al., 2010). Accordingly, earnings quality is connoted by higher quality of accounting accruals, which provide more information on the fi nancial performance of the fi rm to make informed decisions by investors (decision context). Thereby, under this study, we use two well-accepted proxies to measure the “accruals quality” to represent quality of earnings, i.e., CFO Modifi ed Jones Model (Kasznik, 1999)
and D&D Model (2002) based proxies2.
In comparison, the concept of “information asymmetry” has been defined concretely, denoting that market participants have unequal sets of information (Lu et al., 2010)3. In other words, information asymmetry indicates that certain investors are more “informed” than other investors are, in making value judgments pertaining to the fi rm4. Literature indicates that the separation of ownership and control within publicly listed fi rms create such asymmetry (Percy, 2000). The next sub-section discusses the literature pertaining to the relation between accruals based earnings quality and information asymmetry, which sets the basis of this research.
2.2 Previous studies on earnings quality and information asymmetry
Kubota et al. (2010) indicate that there are two views on how information asymmetry infl uences the behavior of capital markets; one is the rational view, which indicates that information asymmetry does exist in capital markets (Easley and O’Hara, 2004), and the next is the irrational view, which propagates investors’ fixations (Shleifer, 2000). This research is based on the first postulate that information asymmetry does exist and it infl uences the behavior and constituencies of the capital markets.
Having discussed a defi nition for information asymmetry in Section 2.1 and the postulate that affirms information asymmetry does, in fact, exist in the preceding paragraph; we now move into our primary focus of our paper, i.e., the relation between earnings quality and the degree of information asymmetry. Extant research studies as Glosten and Milgrom (1985), Diamond (1985), and Diamond and Verrecchia (1991) indicate that higher quality disclosures lead to a reduction in information asymmetry. Furthermore, Diamond (1985) indicates that the incentives for acquiring private information by investors are reduced when entities disclose information publicly. In other words, we could discern that higher disclosure quality reduces the incentive to search private information. On the other hand, Diamond and Verrecchia (1991) indicate that revealing public information to reduce information asymmetry can reduce the cost of capital of entities by attracting
2 Section 4.3 elaborates these accruals based earnings quality proxies in more detail.
3 The interested reader is directed towards extant literature: Jensen and Meckling (1976), Ross (1977), Myers and Majluf (1984) for additional enlightenment.
4 Section 4.2 indicates an appropriate proxy measure – Adjusted PIN – that complies with this defi nition to measure information asymmetry.
higher demand from large investors due to increased liquidity of its securities. This fi nding implies that disclosure of public information can increase the liquidity of respective firm’s securities as well. It should be noted that, these research studies, however, relate to “general public disclosure” of information (as against particularly on “earnings” quality), and now we shall focus on literature dealing directly with earnings quality and information asymmetry.
Bhattacharya et al. (2010) indicate that although earnings remain an important public disclosure, extant research does not provide a reasonable basis for inferring a reliable relation between earnings quality and information asymmetry. They note different reasons in arriving at this conclusion such as usage of inadequate or improper proxies to portray core measures, usage of smaller sample sizes and subset of fi rms. Consequently, Bhattacharya et al. (2010) infer the relation between accruals based earnings quality and information asymmetry based on fi ndings of Sloan (1996). Accordingly, they argue that investors less informed may not be able to process information contained in earnings compared to their more sophisticated counterparts – thereby creating an information asymmetry – since findings of Sloan (1996) indicate that marginal investors fail to incorporate fully the mean reverting of the “accruals” of fi rms having high accruals.
Hence, we could infer the relation between (accruals based) earnings quality and information asymmetry as high accruals leads to a poor quality of earnings and thereby higher degree of information asymmetry, which establishes a negative relation between (accruals based) earnings quality and the degree of information asymmetry. On the other hand, in the same token, it could be inferred from the conclusions of Diamond and Verrecchia (1991), that the increased quality of earnings is expected to increase the liquidity of the securities as well (recent empirical evidence can be observed in Bhattacharya et al., 2008), which establishes a positive relationship between earnings quality and liquidity. These two inferences establish the basis of the main hypothesis: H1 and one of the related ancillary hypotheses: H2 elaborated in the Section 3 that are tested under this study5.
Having discussed above the extant literature relating to the association between earnings quality and information asymmetry, liquidity, respectively, we shall now focus on the relation between information asymmetry and stock returns6. Kim and Verrecchia (1991, 1994), indicate that there is
5 The main objective of this research study is to investigate the association between earnings quality and the degree of information asymmetry. However, since the research is based on the context of capital markets, ancillary to this main objective, we also investigate the related association between liquidity – as one of the key issues of capital markets that goes hand in hand with the concept of information asymmetry – and earnings quality. Further, we investigate the related association between the degree of information asymmetry and stock returns.
6 As noted in footnote 5, we investigate this additional relation at this juncture due to the need to link this research in the context of capital markets. Naturally, investors may need to explore the related relation between the degree of information asymmetry and stock returns, in the context of a capital market.
a possibility that certain investors have a better processing ability of earnings related information and may have a superior ability to forecast the information in the future earnings announcement leading to an increase of information asymmetry at the time of such announcement periods than non-announcement periods. This infers that investors of such private information can obtain abnormal returns and this establishes a positive relation between information asymmetry (induced by earnings information) and abnormal stock returns. On the other hand, Lambert et al. (2007) demonstrates that quality of accounting information directly and indirectly affects a fi rm’s cost of capital by utilizing a model that is consistent with Capital Asset Pricing Model (CAPM). Instead of using expected “returns,” they recast the CAPM into expected values and covariances of future expected “cash fl ows.” They indicate that this adjustment provides a better framework that does not depend on “historical” observations of “returns,” which they see as inferior. They demonstrate analytically that higher quality of accounting information influences the assessed covariance with other fi rms, and this effect lowers the fi rm’s cost of capital closer to the risk-free rate. This demonstration as well as evidence of Kim and Verrecchia (1991, 1994) discussed earlier assert that a positive relation can be established between information asymmetry and stock returns, and sets the basis for the fi nal ancillary hypothesis: H3, which is indicated in Section 3.
While, Section 3 summarizes all the hypotheses developed through the current discussion, next sub-section explains the testing methodology adopted by us in this study.
2.3 Testing methodology
In terms of the testing methodology, we identify, number of positive differences of our study with the study of Bhattacharya et al. (2010) and other local studies. First, we use a more precise indicator to measure the degree of information asymmetry (Adjusted PIN) instead of using controversial spread-based measures7. On the other hand, as noted in Section 1, we also use more appropriate measures to proxy earnings quality by utilizing both CFO Modifi ed Jones Model based measure: abnormal accruals (ABNAC) and the D&D Model based measure: variability of short-term total accruals (D&D) as well8. The ABNAC measures the abnormal component of accruals while the D&D measure captures the overall variability in short-term accruals. While we use more precise and appropriate proxies in this study, we also expect to set a precedence of this nature of studies in the Japanese context. We believe that all these factors distinguish this study from local and international extant research.
7 Section 4.2 elaborates on the measures on information asymmetry. We use the proxy: Adjusted PIN to measure the degree of information asymmetry instead of imprecise PIN or spread-based measures. Higher Adjusted PIN values (which proxies the degree of information asymmetry) indicates a higher degree of information asymmetry.
8 Section 4.3 discusses accruals based earnings quality proxies: ABNAC and D&D. Higher ABNAC or
Based on the preceding discussions, Section 3 develops the related hypotheses tested under this study.
3 Hypotheses Development
In pursuant to the discussion in Section 2.2, under this section, we indicate our main research hypothesis and ancillary hypotheses that are investigated under this study.
3.1 Main hypothesis
As discussed in Section 2.2, we expect that earnings quality be negatively related with the degree of information asymmetry. It was noted in Section 2.3 that an increase in either of the alternative accruals based earnings quality proxies: ABNAC or D&D indicate lower earnings quality9. Further, it was noted that an increase in the proxy: Adjusted PIN, which denotes the degree of information asymmetry, depicts increased degree of information asymmetry. Therefore we hypothesize that, an increase in ABNAC or D&D variable (which proxy accruals based earnings quality) is accompanied by an increase in the Adjusted PIN variable (which proxy the degree of information asymmetry) and vice versa, which can be denoted as follows:
H1: Higher quality earnings (lower ABNAC/D&D) lead to a lower degree of information asymmetry (lower degree of Adjusted PIN).
3.2 Ancillary hypotheses
Ancillary to the main objective of this study that is predicted under H1 above, we venture to test two related ancillary hypotheses that are related to the context of this research10.
We noted in Section 2.2 that we could expect a positive relation between earnings quality and liquidity, and thereby predict an empirically positive relation between these two under this study. In other words, we expect that a decrease in either D&D or ABNAC variable, which represents an increment in earnings quality (footnote 9), will be accompanied by an increase in liquidity (low PSOS), and vice versa11
. Thereby, the denotation of this hypothesis can be indicated as follows:
H2: Higher quality earnings (lower ABNAC/D&D) lead to higher liquidity (lower PSOS).
9 It should be noted that higher ABNAC or D&D represents lower earnings quality as increases in these variables depict an increase in“discretionary”accruals (in case of ABNAC) or increase in “volatility”of short-term accruals leading to higher estimations errors (in case of D&D) and hence,
lower earnings quality. See Section 4.3 for further details. 10 Footnote 5 and 6.
11 In Section 4.2, the variable used to proxy liquidity, i.e., probability of symmetric order-fl ow shocks:
Further, the discussion in Section 2.2 supports a positive relation between the degree of information asymmetry and stock returns. Accordingly, we predict that Adjusted PIN, which measures the degree of information asymmetry, is positively associated with stock returns. In other words, more specifi cally, in our hedge portfolio test (Section 6), we expect a statistically signifi cant higher return spread for the fi rst quintile ranked portfolio (which represents the lowest earnings quality ranked portfolio, i.e., ABNAC1 and D&D1in Panel A and B of Table 5) compared to the lowest quintile ranked portfolio, which represents the highest earnings quality ranked portfolio (i.e., ABNAC5 and D&D5 in Panel A and B of Table 5). The expected empirical relation can be indicated as follows:
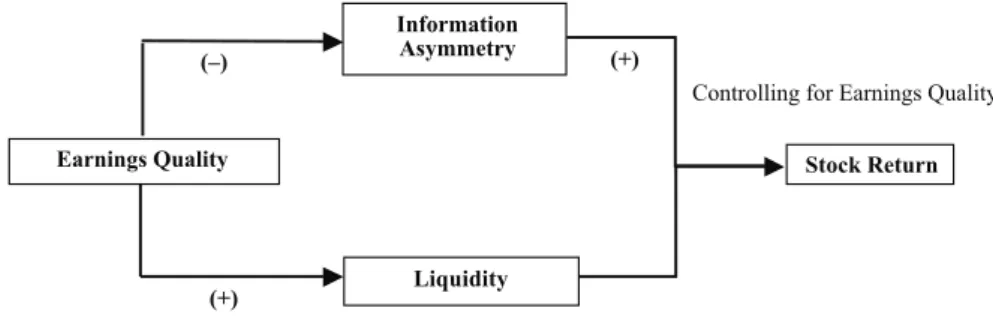
H3: Higher degree of information asymmetry (low ABNAC/D&D) leads to higher stock returns. The related empirical predictions of above hypotheses can be depicted in Figure 1 below.
In the subsequent Section 4, we discuss the measures utilized under this study to investigate the empirical relations hypothesized under this section.
4 Measure of Earnings Quality, Information Asymmetry and Liquidity
4.1 Current and total accruals
In fi nancial accounting, the relation among earnings, cash fl ows, and accruals is depicted using equation as follows:
Further, accruals are decomposed into two main constituencies: current accruals and non-current accruals as indicated below:
Figure 1. Summary of predictions
In the figure plus (+) signs indicate positive relations while a minus (‒) sign connotes negative relation between the concepts related to the empirical predictions investigated under this paper.
Controlling for Earnings Quality Earnings Quality Liquidity (+) Information Asymmetry Stock Return (+) (–) t t
t CashFlows Accruals
Earnings = ±
t t
t CurrentAccruals NoncurrentAccruals
Accruals
This distinction and thereby the defi nitions elaborated next are required to estimate the accruals based earnings quality proxies (Section 4.3) utilized under this research. The defi nitions of current and total accruals are indicated below (Ebihara et al., 2010).
Current accruals (CACC) are defi ned as follows:
CACCt = ΔCurrent assets – ΔCash & deposits – term investment securities –
ΔShort-term loans receivable – (ΔCurrent liabilities – ΔShort-ΔShort-term loans payable – ΔCommercial papers – ΔCurrent portion of the long-term loans payable – ΔCurrent portion of the bonds and convertible bonds)
On the other hand, total accruals (ACC) are defi ned as follows:
ACCt = CACCt – ΔProvision for retirement benefits – ΔProvision for directors’ retirement
benefi ts – ΔOther long-term provisions – Depreciation for the period
[where Δ denotes the change in a given accounting fi gures from year t–1 to year t.]
Both the current accruals (CACC) and total accruals (ACC) are defl ated by the simple average of the book values of total assets. The next sections discuss the key measures used to proxy the core concepts of this research study.
4.2 Degree of information asymmetry and liquidity
An examination of related contemporary studies reveals that different proxies have been used for the measurement of information asymmetry such as spreads based measures (Welker, 1995; Healy et al., 1999) and probability of private informed based trades, so-called PIN variable (Brown and Hillegeist, 2007).
Ertimur (2007) indicates that PIN variable originally developed by Easley et al. (2002) is gradually being used in accounting literature over bid-ask spreads as a measure of information asymmetry among investors. Further, she indicates that PIN measure provides a distinct advantage for studies of this nature as it could be used to examine separately the relation between disclosure quality with both the frequency of information events and relative intensity of informed trading (which comply with the defi nition of information asymmetry indicated in Section 2.1). Furthermore, research has indicated that the alternative spread-based measures lead to interpretative diffi culties (see Lee et al., 1994; Hefl in et al., 2005).
Duarte and Young (2009), however, provide evidence that the PIN measure comprises of two elements, i.e., it proxies not only for the degree of information asymmetry but also illiquidity (PSOS: probability of symmetric order-fl ow shocks), which is unrelated to the degree of information asymmetry of a fi rm. Hence, extant studies that use PIN as a proxy for information asymmetry is seen quite challengeable. In this study, we use the adjusted version of PIN – referred as Adjusted PIN in this paper – that precisely measures only the degree of information asymmetry, which makes the study unique both in local as well as international contexts.
Therefore, based on the discussion above, the adjusted version of the probability of private information based trades, the so-called PIN variable, – Adjusted PIN – introduced by Easley et al.
(2002) and further decomposed by Duarte and Young (2009) has been used to as a measure of the information asymmetry.
Intuitively, PIN is the ratio between expected informed order fl ow and expected total order fl ow. In other words, it is the unconditional probability of a randomly selected trade originates from an informed trader, and is defi ned as follows:
(1)
In equation (1), Į denotes a probability that a private information event will occur in a given day, ȝ denotes the order arrival rate based on private information, İb is the rate of arrival of uninformed
buy orders and İs is the arrival rate of uninformed sell orders.
As mentioned earlier, however, Duarte and Young (2009) extended the sequential trade market microstructure model by Easley et al. (2002) and decomposes the PIN value into two components representing information asymmetry (Adjusted PIN) and probability of symmetric order-flow shocks (PSOS), where PSOS represents illiquidity, which is unrelated to the degree of information asymmetry. The motivation of such extension was that the original PIN estimation model is grounded on mainly on abnormal trading based on private information, where Duarte and Young (2009) argue that such trading might be infl uenced due to public information based liquidity shocks as well, and thus, the extended model was developed. Hence, it is noted that Adjusted PIN is a more purified measure that more precisely measures information asymmetry. Thus, we are motivated using this more precise measure in our study. Adjusted PIN and PSOS variables are defi ned as:
(2)
(3)
In equations (2) and (3), ș denotes the probability of symmetric order fl ow shocks, Δb and ΔS
denote uninformed investors’ additional buy and sell order arrival rates when symmetric order-fl ow shock event occurs, respectively, and δ denotes the fraction of bad news in private information. In this study, we estimate both Adjusted PIN and PSOS variables annually by using the one-year tick-by-tick quote and transactions data starting from July 1st of year t-1 and ends in June 30th of year t.
Based on the above discussion, it should be noted that an increase in the Adjusted PIN variable indicates an increase in the degree of information asymmetry. On the other hand, an increase in the PSOS variable signifi es a decrease in liquidity (as PSOS measures illiquidity).
4.3 Earnings quality measures
This study utilizes two well-accepted alternative measures to proxy earnings quality, which are discussed in this section. First, we use the CFO Modifi ed Jones Model proposed by Kasznik (1999)
s b PIN + + = αμ αμ ε ε s b s b s b s b PIN Adjusted + + ∆ + ∆ + + • • • • − + − = ) ( ) ) 1 (( ) ) 1 (( α α δ δ δ δ μ μ μ μ θ ε ε • • b s b s b s s b PSOS + + ∆ + ∆ + + − ∆ + ∆ = ) ( ) ) 1 (( ) ( θ θ α δ μ δ μ ε ε
to decompose total accruals into abnormal accruals (denoted as ABNAC) and normal accruals, and use abnormal accruals as the fi rst proxy to denote measure the quality of earnings. This measure (ABNAC) is noted as an ideal measure to capture earnings management of the managers of the fi rms within accruals based earnings quality proxies (Dechow et al., 2010; Jones, 1991). It should be noted that an increase in ABNAC indicates an increase in discretionary accruals, and thereby a decrease in earnings quality.
Furthermore, among accruals based earnings quality measures, it is noted in the literature (Francis et al., 2004; Aboody et al., 2005; Francis et al., 2005; Dhaliwal et al., 2006) that the model proposed by Dechow and Dichev (2002) – which had been denoted as the D&D Model in Section 1 – is also being deployed under this study. Dechow and Dichev (2002) defi ne (short-term) accruals as the magnitude of the estimation errors and indicate that higher the (short-term) accruals, the lesser the quality of earnings due to the possibility of higher estimation errors. Accordingly, the accruals based earnings quality measures used in this study deals with both with the total accruals as well as abnormal accruals adding to the reliability of the conclusions reached under this study. Next, we discuss the specifi cations of these two models and derivation of the proxy measures.
As discussed above, abnormal accruals are derived using the CFO Modifi ed Jones Model (Kasznik, 1999), which decomposes total accruals into normal and abnormal components. The estimation is done employing the following cross-sectional regression model:
(4)
where ΔADJREV is the difference in changes in sales and accounts receivable, PPE is property, plant and equipment – measured at net book value – and ΔCFO is the change in cash flow operations. Subscripts j and p represents the fi rm and industry it belongs, respectively.
We used our original 24 industry classifi cation, which is based on the 33 industry classifi cation by Tokyo Stock Exchange, which excludes the financial firms. The fitted values from the OLS regression are the normal accruals (NAC), and the abnormal accruals (ABNAC) are defi ned as the difference between total accruals (ACC: Section 4.1) and normal accruals (NAC).
Then, the second measure of earnings quality we use is the one introduced by Dechow and Dichev (2002). They defi ne the earnings quality as volatility of residuals in the following time-series regression model.
(5)
where CACC is the current accruals, and CFO is the cash-flows from operations. Subscript t denotes the period.
According to Dechow and Dichev (2002), the residual term obtained by regressing equation (5) is, by defi nition, the difference between the amount accrued and the amount realized. Hence, they suggest the standard deviation of the residual term as the measure of accruals quality and the earnings quality. This study uses this D&D Model based measure (referred as D&D in this paper) of
p j p j p p j p p j p p p
j ADJREV PPE CFO
ACC, =α +β1, ∆ , +β2, , +β3, ∆ , +ε , t j t j j t j j t j j t j j t j j j t j CFO CFO CFO CFO CFO CACC , 2 , , 5 1 , 4 , , 3 1 , , 2 2 , , 1 , ε β β β β β α + + + + + + = + + − −
12 The sample period 2000 to 2009 allows actual operating cash fl ows to be used, while we estimated cash fl ows using unconsolidated individual fi nancial statements for the period 1991 to 1999 as Japanese fi rms began to disclose consolidated cash-fl ow statements only after 1999.
accrual based earnings quality as a point of enhancing the robustness of our fi ndings. The standard deviation of the residual (i.e., D&D) is calculated using a 5-year moving average basis that takes into consideration fi nancial data for 1991 to 2010 and estimated for the period 1997 to 200812.
5 Accounting Accruals and Information Asymmetry, Liquidity
5.1 Data and descriptive statistics
Nikkei NEEDS database published by Nihon KeizaiShinbun Inc. is the primarily data source for accounting variables. The monthly return data of individual firms was obtained through Nikkei PortfolioMaster Database provided by Nikkei Media Marketing Co., Ltd. The pooled sample for the period 1997–2008 consists of 17,429 fi rm-year observations in the sample for the analysis of CFO Modifi ed Jones Model and 13,534 observations for the sample used for the D&D Model. Table 1 depicts the industry classifi cation of the fi rms for both groups of samples, which is based on the Tokyo Stock Exchange industry classifi cation. It should be noted that our sample is restricted to non-fi nancial fi rms as fi nancial fi rms are quite different from both representation and substance.
Table 2 indicates the descriptive statistics pertaining to both sample groups, i.e., samples used for CFO Modifi ed Jones Model and the D&D Model earnings quality proxy estimations. The variables represented are: earnings before extraordinary items (EBEI), cash flows from operations (CFO), total accruals (ACC), current accruals (CACC), adjusted PIN (Adjusted PIN) that represents the degree of information asymmetry, probability of symmetric order-fl ow shocks (PSOS) that measures illiquidity, abnormal accruals (ABNAC) estimated using CFO Modified Jones Model, earnings quality measure based on D&D Model (D&D), fi rm size measured as natural logarithm of market value of equity in million Japanese Yen (lnMV), book-to-price ratio in percent (BPR), respectively. In this study, we use the market value of equity at the end of June.
In the descriptive statistics (Table 2), it is observed that, for both sample groups (i.e., sample for CFO Modifi ed Jones Model sample and the sample for D&D Model), the standard deviation (SD) of earnings (EBEI) is lower than that of cash-flows from operations (CFO), while the standard deviation (SD) of total accruals (ACC) and current accruals (CACC) are also observed to be higher. While observing a similar pattern in these variables, Kubota et al. (2010) indicate that managers of the sample fi rms may have engaged in earnings management to smooth earnings through some kind of “income smoothening scheme.” This characteristic is noted as a justification of usage of accruals based proxies (i.e., ABNAC and D&D) to measure earnings quality in this study.
Table 1. Industry Classification of the Firm-Years of the Sample
Industry % Firms Industry
#Firms and %Firms are the number and the percentages of firm-years, respectively of the sample. The first two columns in both the right-hand and left-hand sides of the table represent the sample firm-years utilized in the analysis related to the CFO Modified Jones Model and the adjacent two columns to them relate to the sample firm-years used for the D&D Model estimations, respectively. The 33 industry categorization of Tokyo Stock Exchange classification has been used as the industry classification. The total number of firm-years of the first sample is 17,429 and 13,534 for the next sample respectively for the period 1997 ‒ 2008. All firms selected under both samples are having March 31 as its fiscal year end.
Fishery & Agri. Mining Construction Foods
Textiles & Apparels Pulp & Paper Chemicals Pharmaceutical Oil & Coal Products Rubber Products Glass & Ceramics Iron & Steel Nonferrous Metals Metal Products Machinery 63 54 1,102 899 582 145 1,359 362 89 204 380 472 274 471 1,478 # Firms 0.361 0.310 6.323 5.158 3.339 0.832 7.797 2.077 0.511 1.170 2.180 2.708 1.572 2.702 8.480 % Firms 57 48 924 793 506 121 1,131 291 60 182 325 417 247 379 1,261 # Firms 0.421 0.355 6.827 5.859 3.739 0.894 8.357 2.150 0.443 1.345 2.401 3.081 1.825 2.800 9.317 % Firms # Firms % Firms # Firms Electric Appliances
Transportation Equip. Precision Instruments Other Products Electric Power & Gas Land Transportation Marine Transportation Air Transportation Warehousing Communication Wholesale Trade Retail Trade
Other Financing Business Real Estate Services 1,762 792 331 725 261 471 156 36 283 172 1,564 1,067 201 331 1,343 10.110 4.544 1.899 4.160 1.498 2.702 0.895 0.207 1.624 0.987 8.974 6.122 1.153 1.899 7.706 1,347 715 278 523 241 427 156 36 236 48 1,161 586 126 205 707 9.953 5.283 2.054 3.864 1.781 3.155 1.153 0.266 1.744 0.355 8.578 4.330 0.931 1.515 5.224
Table 2. Descriptive Statistics
Mean SD 1st Quartile Median 3rd Quartile
CFO Jones D&D CFO Jones D&D CFO Jones D&D CFO Jones D&D CFO Jones D&D In the table, statistics have been indicated for both CFO Modified Jones Model based sample (see column denoted as CFO Jones) and D&D Model based sample (in column denoted as D&D).
EBEI: earnings before extraordinary items; CFO: cash flow from operations; ACC: total accruals; CACC: current accruals; Adjusted PIN: adjusted PIN that indicates the degree of information asymmetry; PSOS: probability of symmetric order-flow shock which measures illiquidity; ABNAC: abnormal accruals based on CFO Modified Jones Model; D&D: earnings quality measure based on the D&D Model; lnMV: natural logarithm of the market value of equity at the end of June measured in million yen; BPR: book-to-price ratios as of the end of June; The variables EBEI, CFO, ACC and CACC are all divided by the simple average of book values of total assets calculated based on book value at the beginning and ending of the fiscal year. The number of observations under each sample is the same as in Table 1.
EBEI CFO ACC CACC Adjusted PIN PSOS ABNAC D&D lnMV BPR 0.027 0.053 -0.029 0.005 15.044 25.713 0.000018 10.544 97.118 0.026 0.051 -0.028 0.005 15.116 25.320 0.019 10.621 100.920 0.034 0.054 0.057 0.051 5.851 9.767 0.063 1.580 69.904 0.034 0.058 0.068 0.064 5.966 9.645 0.030 1.535 70.839 0.011 0.025 -0.055 -0.015 11.237 19.481 -0.021 9.419 52.751 0.010 0.023 -0.055 -0.016 11.196 19.202 0.005 9.520 57.212 0.023 0.052 -0.030 0.003 14.835 24.571 0.001 10.339 83.699 0.023 0.050 -0.029 0.003 14.904 24.220 0.011 10.423 87.463 0.041 0.082 -0.004 0.023 18.648 30.567 0.020 11.547 125.771 0.080 -0.003 0.023 18.801 30.099 0.024 0.024 11.604 128.885
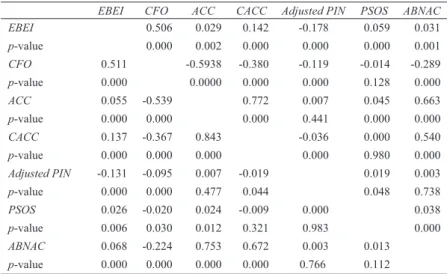
Table 3 indicates the Pearson correlation (see lower-left triangular part) and Spearman’s rank correlation (see upper-right triangular part) among the selected key variables on the sample related to the CFO Modifi ed Jones Model. It is noted under both types of correlations, the variable that measures the degree of information asymmetry: Adjusted PIN (Adjusted PIN) has a weak and insignifi cant positive relation with the CFO Modifi ed Jones Model based earnings quality variable: abnormal accruals (ABNAC). On the other hand, Probability of Symmetric Order-flow Shocks (PSOS) which proxy illiquidity has a weakly positive, but signifi cant (Spearman’s rank correlation is signifi cant at 1 percent) relationship with the abnormal accruals (ABNAC). Under the Pearson correlation, however, the significance level is above 5 percent between the PSOS variable and ABNAC.
5.2 Results of Regression Analysis
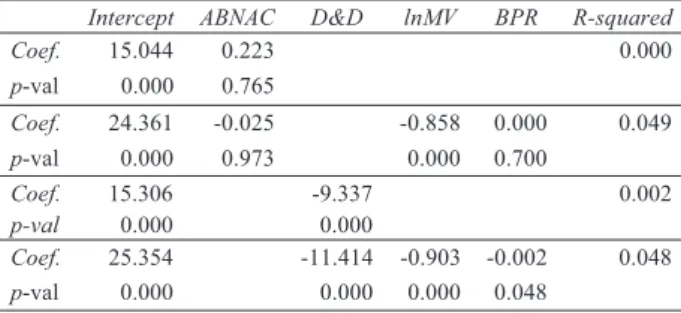
This section explains the fi ndings we arrived through the regression analysis. In order to test the main hypothesis (H1) and the ancillary hypothesis (H2), which were indicated in Section 3 of this study, we conduct a pooling regression analysis. Table 4 indicates the univariate and multivariate estimates for regression analysis performed on CFO Modifi ed Jones Model based earnings quality measure (ABNAC) and the D&D based earnings quality measure (D&D) with measures for both the degree of information asymmetry (Adjusted PIN) and illiquidity (PSOS) measures on a separate basis. The natural logarithm of market value of equity at the end of June (lnMV) and the
Table 3. Correlation Matrix
EBEI CFO ACC CACC Adjusted PIN PSOS ABNAC
The table indicates the Pearson and Spearman s rank correlations, which are based on the sample for CFO Modified Jones Model. The lower left-hand diagonal section depicts the Pearson s correlation matrix, while the upper right-hand section shows the Spearman s rank correlations. The number of observations of the CFO Modified Jones sample is the same as in Table 1. EBEI: earnings before extraordinary items; CFO: cash flow from operations; ACC: total accru-als; CACC: current accruaccru-als; Adjusted PIN: adjusted PIN that measures the degree of information asymmetry; PSOS: probability of symmetric order-flow shock that represents illiquidity; ABNAC: abnormal accruals based on CFO Modified Jones Model; D&D: earnings quality measure based on the D&D model.
EBEI p-value CFO p-value ACC p-value CACC p-value Adjusted PIN p-value PSOS p-value ABNAC p-value 0.511 0.000 0.055 0.000 0.137 0.000 -0.131 0.000 0.026 0.006 0.068 0.000 0.506 0.000 -0.539 0.000 -0.367 0.000 -0.095 0.000 -0.020 0.030 -0.224 0.000 0.029 0.002 -0.5938 0.0000 0.843 0.000 0.007 0.477 0.024 0.012 0.753 0.000 0.142 0.000 -0.380 0.000 0.772 0.000 -0.019 0.044 -0.009 0.321 0.672 0.000 -0.178 0.000 -0.119 0.000 0.007 0.441 -0.036 0.000 0.000 0.983 0.003 0.766 0.059 0.000 -0.014 0.128 0.045 0.000 0.000 0.980 0.019 0.048 0.013 0.112 0.031 0.001 -0.289 0.000 0.663 0.000 0.540 0.000 0.003 0.738 0.038 0.000
book-to-price ratio (BPR) have been used as control variables. The multivariate regression model and thereby the control variables are chosen appropriately after careful examination of related literature that relates to the context of this research (Fama and French, 1992; Easley et al., 2002; Kubota and Takehara, 2009; Bhattacharya et al., 2009; Akins et al., 2011)13.
According to the results of univariate and multivariate regression analyses shown in Table 4, it is noted that (see panel A) there is a positive relation between abnormal accruals (ABNAC) and degree of information asymmetry (Adjusted PIN) on a univariate basis. Therefore, the predicted negative relation between the earnings quality (proxy: ABNAC) and the degree of information asymmetry expected under the hypothesis H1 is observed, which indicates that the higher the quality of earnings, the lower the degree of information asymmetry. The relation, however, is not statistically signifi cant. Further, we observe a negative relation between ABNAC and Adjusted PIN variables after controlling for the portfolio style using the fi rm size (lnMV) and book-to-price (BPR)
13 The conclusions derived from the multivariate regression analyses under this section did not change even after exploring the addition of additional control variables (results not tabulated).
Table 4. Regressing Earnings Quality measures ( and ) with measures for Information Asymmetry ( ) and Illiquidity ( )
Panel A: Dependent Variable: Adjusted PIN
Intercept ABNAC D&D lnMV BPR R-squared
Coef. 15.044 0.223 0.000 p-val 0.000 0.765 Coef. 24.361 -0.025 -0.858 0.000 0.049 p-val 0.000 0.973 0.000 0.700 Coef. 15.306 -9.337 0.002 p-val 0.000 0.000 Coef. 25.354 -11.414 -0.903 -0.002 0.048 p-val 0.000 0.000 0.000 0.048
Panel B: Dependent Variable: PSOS
Intercept ABNAC D&D lnMV BPR R-squared
Coef. 25.713 1.978 0.000 p-val 0.000 0.112 Coef. 47.662 1.831 -1.821 -0.025 0.073 p-val 0.000 0.127 0.000 0.000 Coef. 25.057 12.956 0.002 p-val 0.000 0.000 Coef. 46.950 7.643 -1.807 -0.022 0.067 p-val 0.000 0.006 0.000 0.000
Definitions of the variables are same as in table-note of Table 2. In both sub-sections of the Panel A and Panel B of the table, the first two lines in each indicate the univariate regression estimates, and the subsequent two lines indicate the multivariate regression estimates for each of the earnings quality measures.
ratio. This fi nding is contrary to our prediction. The relation is not signifi cant, however.
On the other hand, the D&D Model based earnings quality measure (D&D) and the degree of information asymmetry (Adjusted PIN) has a negative relation against our prediction, both under univariate and multivariate analyses. The negative relation may be explained as follows. As explained in Section 4.2, the variable representing information asymmetry in this study is Adjusted PIN, and it is defi ned as the ratio of informed traders’ order-fl ow based on their private information to the total order flow. After observing the stock market behavior during the sample period, we assume that the total order fl ows increased at a higher proportion than the private information based order fl ows, which reduces the Adjusted PIN value (as the nominator – order fl ow based on private information – is quite stable and the denominator – total order fl ow– increases). On the other hand, increasing stock market activity may be influenced by (among other factors) higher earnings levels of fi rms. Such escalation in earnings may signify increase in the related volatility of accruals that leads to the increase in the accruals based D&D measure. Hence, by taking into these two scenarios into consideration, we could observe the negative relation between Adjusted PIN and D&D measures as indicated in Table 4 – Panel A.
In Table 4 (Panel B), it is also noted that there is a signifi cantly positive relation between the measures for D&D based earnings quality measure (D&D) and illiquidity measure (PSOS) both under univariate and multivariate bases. Abnormal accruals (ABNAC) also have a positive (but statistically insignifi cant) relation with PSOS. In other words, this relation indicates that higher level of earnings quality leads to a higher degree of liquidity. This confi rms our hypothesis: H214.
6 Information Asymmetry and Stock Returns
The hedge portfolio test examines the extent of economic signifi cance of accrual mispricing by estimating stock returns for one year forward to portfolios ranked by accruals and the degree of information asymmetry (hypothesis: H3), as well as to portfolios ranked by accruals and liquidity
14 We observe low R-squared values in Table 4 under the multivariate regression analyses. As observed in the introduction of this study, we are unable to observe studies that had used the proxy measure: Adjusted PIN to measure precisely the degree of information asymmetry and investigate its relation with quality of earnings. This makes us unable to compare directly our results with local or international extant research. However, Muramiya et al. (2008), who use the PIN to measure the degree of information asymmetry, obtain similar low R-squared values in their regression analysis performed between PIN and abnormal accruals. We fi nd that the reason for this being the distinct nature of Japanese data. In the study of Jayaraman (2008), which uses U.S. data, a rather stronger U-shaped curve-linear relation between the PIN measure and their volatility-based earnings quality measure is depicted. By performing the same analyses of Jayaraman (2008) on Japanese data, we observe the same conclusions that we had obtained under Section 5.2 of this research, which is attributed to the absence of such a curve-linearity.
as an additional analysis15. Therefore, to examine these, we conduct hedge portfolio tests, and the related fi ndings are reported in Table 5 and Table 6. In both tables, we compute the average spread (see “Ave. Spr.” columns) between the highest and lowest quintile portfolios to establish the empirical relations, while controlling for the level of earnings quality.
We constructed two-way ranked portfolios based on the earnings quality measures: ABNAC (abnormal accruals based on CFO Modified Jones Model) and D&D (earnings quality measure based on D&D Model) alternatively, with the degree of information asymmetry (Adjusted PIN) and illiquidity (proxied by PSOS), respectively. Further, in the construction two-way ranked portfolios, we fi rst grouped the fi rms into quintiles depending on the magnitude of the earnings quality measure (i.e., for ABNAC and D&D, respectively) for each year. In the second stage of the portfolio construction, under each of the above earnings quality measures based quintile portfolios, we formed again fi ve groups of portfolios based on the degree of information asymmetry (Adjusted PIN) and liquidity measure (proxied by the illiquidity variable: PSOS), respectively16.
Since, generally firms that have a fiscal year ending in March announce, their earnings information by mid-May (which is a requirement of the Tokyo Stock Exchange) and discloses their fi nancial statements at early June (at the latest) to facilitate holding annual general meetings at the end of June, we formed the ranked portfolios at the end of June. The portfolio returns were computed for a 12-months period by equally weighting return series for each stock assigned to a particular portfolio group. The spreads related to portfolio returns were computed based on highest and lowest portfolios17.
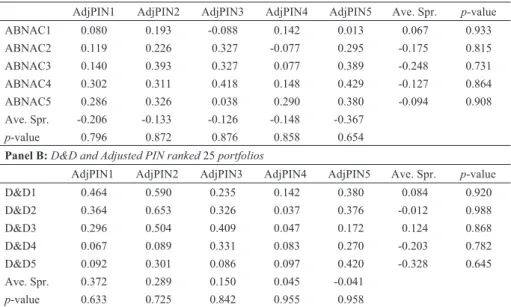
According to the hypothesis H3, we predict that higher degree of information asymmetry will lead to higher stock returns. To investigate this hypothesis, in Table 5, we investigate the relation between Adjusted PIN (proxy for the degree of information asymmetry) and stock returns while controlling for the level of two earnings quality by using two earnings quality proxies: ABNAC (Panel A) and D&D (Panel B).
The monthly average return spreads (see “Ave. Spr.” column) in Table 5 indicate that we are unable to observe a statistically significant relationship between high Adjusted PIN and low Adjusted PIN portfolios with stock returns.
As an additional analysis, on the other hand, we also could reasonably expect a higher stock return when liquidity increases, while controlling for the level of earnings quality (Bhattacharya
15 We extend our hedge portfolio test to investigate the relation between liquidity and stock returns (while controlling for earnings quality) as an additional analysis (for the same reason cited in footnote 5 and 6). The results of this additional analysis are reported in Table 6.
16 Our sample consists of fi rms having March 31, as the fi scal year end.
17 That has been decided based on their respective earnings quality measure and the degree of information asymmetry/ liquidity of the two-way portfolio.
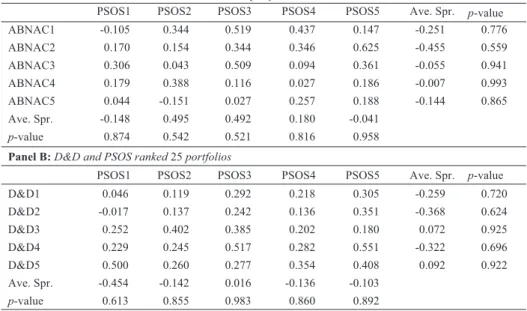
et al., 2008). In other words, we could expect a negative relation between PSOS (which proxy illiquidity) and stock returns. More specifi cally stated, a higher return spread that is statistically signifi cant is expected for the fi rst quintile of ranked portfolio (which represents the lowest ranked portfolio of earnings quality, i.e., ABNAC1 and D&D1 in Panel A and B of Table 6) compared to the lowest quintile of ranked portfolio that represents the highest quality of earnings ranked portfolio (i.e., ABNAC5 and D&D5 in Panel A and B of Table 6). Accordingly, in Table 6, we investigate whether higher liquidity of respective firm’s stocks lead to higher stock returns. We use PSOS as the measure of illiquidity and both ABNAC (Panel A) and D&D (Panel B) earnings quality measures to construct the two-way hedge portfolios18.
18 It should be noted that since PSOS variable assesses illiquidity, in Table 6, the highest quintile of the PSOS based portfolio (i.e., PSOS1) that consists of the highest PSOS values represents the lowest liquidity (i.e., the highest illiquidity).
Table 5. Average Monthly Return for portfolios formed on Abnormal Accruals and then Adjusted PIN
Panel A: Abnormal accruals and Adjusted PIN ranked 25 portfolios
AdjPIN1 AdjPIN2 AdjPIN3 AdjPIN4 AdjPIN5 Ave. Spr. p-value
Panel B: D&D and Adjusted PIN ranked 25 portfolios
AdjPIN1 AdjPIN2 AdjPIN3 AdjPIN4 AdjPIN5 Ave. Spr. p-value
Definitions of the variables are same as in table-note of Table 2. Panel A depicts the average monthly returns for the two-way ranked portfolios constructed based on earnings quality proxy: ABNAC (abnormal accruals based on CFO Modified Jones Model) and Adjusted PIN (degree of information asymmetry), while Panel B indicates average monthly returns for the two-way ranked portfolio constructed based on earnings quality proxy: D&D (earnings quality measure based on D&D Model) and Adjusted PIN (degree of information asymmetry). The number 1 at the end of each denotation of two-way portfolio heading indicates the highest ranking portfolio while number 5 indicates the lowest ranking of the respective portfolios (e.g. ABNAC1 represents the highest quintile of ABNAC based ranking, while AdjPIN1 indicates the highest quintile of Adjusted PIN based ranking, in the respective portfolios).
ABNAC1 ABNAC2 ABNAC3 ABNAC4 ABNAC5 Ave. Spr. p-value 0.080 0.119 0.140 0.302 0.286 -0.206 0.796 0.193 0.226 0.393 0.311 0.326 -0.133 0.872 -0.088 0.327 0.327 0.418 0.038 -0.126 0.876 0.142 -0.077 0.077 0.148 0.290 -0.148 0.858 0.013 0.295 0.389 0.429 0.380 -0.367 0.654 0.067 -0.175 -0.248 -0.127 -0.094 0.933 0.815 0.731 0.864 0.908 D&D1 D&D2 D&D3 D&D4 D&D5 Ave. Spr. p-value 0.464 0.364 0.296 0.067 0.092 0.372 0.633 0.590 0.653 0.504 0.089 0.301 0.289 0.725 0.235 0.326 0.409 0.331 0.086 0.150 0.842 0.142 0.037 0.047 0.083 0.097 0.045 0.955 0.380 0.376 0.172 0.270 0.420 -0.041 0.958 0.084 -0.012 0.124 -0.203 -0.328 0.920 0.988 0.868 0.782 0.645
In Table 6, the average spreads (see “Ave. Spr.” column) indicate that we are not able to observe the expected positive relation between liquidity and stock returns on a statistically significant basis. We observe, for most of the cases there exist a weak but the expected positive relation between liquidity and stock return, however.
Although we are not able to establish the hypothesis on a statistically signifi cant basis, it should be noted that for some cases in Table 5, there exist a weak positive relation between Adjusted PIN (degree of information asymmetry) and stock returns, however. On the other hand, for most of the cases in Table 6, we observe a weak negative relation between PSOS (illiquidity) and stock returns, which may not be attributed to mere chance.
There is, however, prior extant literature, which has established accrual anomaly in U.S. as well as in Japan. In the U.S. context, Liu and Qi (2006) fi nd that by taking a long position in the lowest accrual decile and a short position in the highest accrual decile earn a return of 13.3 percent which they claim even higher than Sloan’s (1996) 10.4 percent for a similar trading strategy. During our sampling period (1997 to 2008), however, return spreads from abnormal accruals trading strategy are not statistically signifi cant in most cases. In addition, return spreads from D&D measure based trading strategy are not significant. Hence, there is a possibility that we may not examine the
Table 6. Average Monthly Return for portfolios formed on Abnormal Accruals and then PSOS
Panel A: Abnormal accruals and PSOS ranked 25 portfolios
PSOS1 PSOS2 PSOS3 PSOS4 PSOS5 Ave. Spr. p-value
Panel B: D&D and PSOS ranked 25 portfolios
PSOS1 PSOS2 PSOS3 PSOS4 PSOS5 Ave. Spr. p-value
Variables carry the same definitions as indicated in the table-note of Table 2. The average monthly returns for the two-way ranked portfolios based on earnings quality proxy: ABNAC (abnormal accruals based on CFO Modified Jones Model) and PSOS (illiquidity) variables are depicted in Panel A, while in Panel B the average monthly returns for the two-way ranked portfolio constructed using earnings quality proxy: D&D (earnings quality measure based on D&D Model) and PSOS (illiquidity). At the end of each denotation of two-way portfolio heading, number 1 indicates the highest ranking portfolio while number 5 indicates the lowest ranking of the respective portfolios (e.g. ABNAC1 repre-sents the highest quintile of ABNAC based ranking, while PSOS1 indicates the highest [i.e. most illiquid] quintile of PSOS based ranking, in the respective portfolios).
ABNAC1 ABNAC2 ABNAC3 ABNAC4 ABNAC5 Ave. Spr. p-value -0.105 0.170 0.306 0.179 0.044 -0.148 0.874 0.344 0.154 0.043 0.388 -0.151 0.495 0.542 0.519 0.344 0.509 0.116 0.027 0.492 0.521 0.437 0.346 0.094 0.027 0.257 0.180 0.816 0.147 0.625 0.361 0.186 0.188 -0.041 0.958 -0.251 -0.455 -0.055 -0.007 -0.144 0.776 0.559 0.941 0.993 0.865 D&D1 D&D2 D&D3 D&D4 D&D5 Ave. Spr. p-value 0.046 -0.017 0.252 0.229 0.500 -0.454 0.613 0.119 0.137 0.402 0.245 0.260 -0.142 0.855 0.292 0.242 0.385 0.517 0.277 0.016 0.983 0.218 0.136 0.202 0.282 0.354 -0.136 0.860 0.305 0.351 0.180 0.551 0.408 -0.103 0.892 -0.259 -0.368 0.072 -0.322 0.092 0.720 0.624 0.925 0.696 0.922
hypothesis: H3 (as well as the additional analysis reported above) by applying the hedge portfolio test, which had been commonly used in extant empirical accounting studies.
Accordingly, as a future research direction we expect to investigate these two hypotheses using some other alternative methods (for an instance, using as one of the methods proposed in Brennan et al. [1998]). Furthermore, we expect to estimate Adjusted PIN and PSOS variables on a quarterly basis and examine the relation between the degree of information asymmetry with stock returns in our future research.
Sections 5 and 6 above elaborated the fi ndings we had obtained under this research study, and the next section concludes the study while indicating future research directions.
7 Conclusion and Future Research
The main objective of this study was to investigate the empirical relation between earnings quality and the degree of information asymmetry pertaining to listed fi rms in the First and Second Sections of Tokyo Stock Exchange. Furthermore, due to this research positioned in a capital market context, ancillary and related to the above main objective, we also investigated the relation between earnings quality and liquidity, as well as the relation between earnings quality and stock returns of these listed fi rms.
We used the Adjusted PIN value proposed by Duarte and Young (2009), which is a well-refi ned measure to estimate the degree of information asymmetry. Further, the probability of symmetric order-fl ow shocks (PSOS), the counterpart measure for illiquidity was used to measure liquidity. We used both CFO Modifi ed Jones Model (Kasznik, 1999) and measure derived from the D&D Model (Dechow and Dichev, 2002) to estimate accruals based earnings quality proxies. We believe that these models capture the related concepts far better than the vaguer proxies used in contemporary studies, which distinguishes this study from extant studies.
In terms of the relation between earnings quality and the degree of information asymmetry, we observed a negative relation between them, when earnings quality was proxied by abnormal accruals (ABNAC) estimated using CFO Modified Jones Model, on a univariate basis. The observation, however, is not statistically significant. On the other hand, we find an unexpected positive relation between the D&D Model based earnings quality measure (D&D) and the degree of information asymmetry (Adjusted PIN), which is assumed to be caused by stock market fl uctuations. In our ancillary analysis, in terms of earnings quality measured by using both ABNAC and D&D, and liquidity proxied by PSOS, we fi nd a positive (for both ABNAC and D&D proxies, respectively) and statistically signifi cant (for D&D) relation as we had predicted.
In addition to establishing above empirical relations, we also performed a hedge portfolio test to investigate the relation between information asymmetry with stock returns when controlled for earnings quality. While controlling for earnings quality (by using ABNAC and D&D alternatively) and a trading strategy based on the degree of information asymmetry, we find that information asymmetry of the fi rms is weakly related with stock returns in a systematic way, although they are
not statistically signifi cant.
The findings of this research are expected to be useful in understanding the role of earnings quality information (i.e., as earnings being a key element in accounting information) on the effi ciency and effectiveness of capital markets. Further, in terms of policy implications, the fi ndings of this study suggest that the quality of earnings needs to be improved for a positive effect on capital markets (i.e., as far as reducing information asymmetry); and we believe that accounting standard setting could play a key role in achieving this objective by enhancing the financial reporting quality. In terms of future research directions, we suggest the usage of alternative proxies for earnings quality (we had used primarily accruals based proxies in this study) as well as to investigate the impact of additional and alternative portfolio styles in investigating the predicted empirical relations19. Furthermore, we also suggest expanding the sample scope beyond the First and Second sections of Tokyo Stock Exchange by including other categories of listed fi rms as well as other Japanese stock exchanges.
【References】
[1] Aboody, D., J. Hughes and J. Liu (2005), “Earnings quality, insider trading and cost of capital,” Journal
of Accounting Research, 43(5), 651-673.
[2] Akins, B. K., J. Ng and R. S. Verdi (2011), “Investor competition over information and the pricing of information asymmetry,” to appear in The Accounting Review.
[3] Bhattacharya, N., H. Desai and K. Venkataraman (2010), “Earnings quality and information asymmetry,” Working Paper, Edwin L. Cox School of Business, Southern Methodist University.
[4] Bhattacharya, N., H. Desai and K. Venkataraman (2008), “Earnings quality and information asymmetry: Evidence from trading costs,” Working Paper, Edwin L. Cox School of Business, Southern Methodist University.
[5] Bhattacharya, N., F. Ecker, P. Olsson and K. Schipper (2009), “Direct and mediated associations among earnings quality, information asymmetry and the cost of equity,” Working Paper, Fuqua School of Business, Duke University.
[6] Brennan, M., T. Chordia and A. Subrahmanyam (1998), “Alternative factor specifi cations, security characteristics and the cross-section of expected stock returns,” Journal of Financial Economics, 49, 345-373.
[7] Brown, S. and S. A. Hillegeist (2007), “How disclosure quality affects the level of information asymmetry,” Review of Accounting Studies, 12(2/3), 443-477.
[8] Dechow, P. M. and I. D. Dichev (2002), “The quality of accruals and earnings: The role of accrual estimation errors,” The Accounting Review, 77 (Supplement), 35-59.
19 The prospective researcher, however, needs to establish a proper conceptual basis on establishing relations between“non-accrual”based earnings quality proxies and the degree of information asymmetry as we had discussed and identifi ed in Section 2.2 for“accrual”based earnings quality proxies.
[9] Dechow, P. M., W. Ge and C. M. Schrand (2010), “Understanding earnings quality: A review of the proxies, their determinants and their consequences,” Journal of Accounting and Economics, 50(2-3), 344-401
[10] Dhaliwal, D., V. Naiker and F. Navissi (2006), “Audit committee financial expertise, corporate governance and accruals quality: An empirical analysis,” Working Paper, Department of Accounting, University of Arizona. Available at SSRN: http://ssrn.com/abstract=906690
[11] Diamond, D. W. (1985), “Optimal releases of information by firms,” Journal of Finance, 40, 1071-1094.
[12] Diamond, D. W. and R. E. Verrecchia (1991), “Disclosure, liquidity and the cost of capital,” Journal of
Finance, 46, 1325-1359.
[13] Duarte, J. and L. Young (2009), “Why is PIN priced?,” Journal of Financial Economics, 91, 119-138. [14] Easley, D., S. Hvidkjaer and M. O’Hara (2002), “Is information risk a determinant of asset returns?,”
Journal of Finance, 57, 2185–2221.
[15] Easley, D. and M. O’Hara (2004), “Information and the Cost of Capital,” Journal of Finance, 59, 1553–1583.
[16] Fama, E., and K. French (1992), “The cross-section of expected stock returns,” Journal of Finance, 47, 427–465.
[17] Financial Accounting Standards Board (FASB) (1980), “Qualitative Characteristics of Accounting
Information,” Statement of Financial Accounting Concepts No. 2. Stamford, CT: FASB.
[18] Ebihara, T., K. Kubota, H. Takehara and E. Yokota (2010), “Earnings quality of family fi rms: Evidence from Japan,” Working Paper, Faculty of Economics, Musashi University.
[19] Ertimur, Y. (2007), “Discussion of “How disclosure quality affects the level of information asymmetry”, Review of Accounting Studies, 12 (2-3), 479-485.
[20] Francis, J., R. LaFond, P. Olsson and K. Schipper (2004), “Costs of equity and earnings attributes,”
The Accounting Review, 79(4), 967-1010.
[21] Francis, J., R. LaFond, P. Olsson and K. Schipper (2005), “The market pricing of accruals quality,”
Journal of Accounting and Economics, 39(2), 295-327.
[22] Glosten, L., and P. Milgrom (1985), “Bid, ask, and transaction prices in a specialist market with heterogeneously informed traders,” Journal of Financial Economics, 26, 71-100.
[23] Healy, P., A. Hutton and K. Palepu (1999), “Stock performance and intermediation changes surrounding sustained increases in disclosures,” Contemporary Accounting Research, 16, 485–520. [24] Hefl in, F., K. W. Shaw and J. J. Wild (2005), “Disclosure policy and market liquidity: Impact of depth
quotes and order sizes,” Contemporary Accounting Research, 22, 829–866.
[25] Jayaraman, S. (2008), “Earnings volatility, cash flow volatility, and informed trading,”Journal of
Accounting Research, 46(4), 809-851.
[26] Jensen, M. C., and W. H. Meckling (1976), “Theory of the fi rm: Managerial behaviour, agency costs and ownership structure,” Journal of Financial Economics, 3(4), 305-360.
[27] Jones, J. (1991), “Earning management during import relief investigation,” Journal of Accounting
[28] Kasznik, R. (1999), “On the association between voluntary disclosure and earnings management,”
Journal of Accounting Research, 37 (1999), 57–81.
[29] Kim, O. and R. E. Verrecchia (1991), “Market reaction to anticipated announcements,” Journal of
Financial Economics, 30, 273-309.
[30] Kim, O. and R. E. Verrecchia (1994), “Market liquidity and volume around earnings announcements,”
Journal of Accounting and Economics, 17, 41-67.
[31] Kubota, K. and H. Takehara (2009), “Information based trade, the PIN variable, and portfolio style differences: Evidence from Tokyo stock exchange fi rms,” Pacifi c-Basin Finance Journal, 17, 319-337. [32] Kubota, K., K. Suda and H. Takehara (2010), “Dissemination of accruals information, role of
semi-annual reporting, and analyst’s earnings forecasts: Evidence from Japan,” Journal of International
Financial Management and Accounting, 21(2), 120-160.
[33] Lambert, R., C. Leuz and R. E. Verrecchia (2007), “Accounting information, disclosure, and the cost of capital,” Journal of Accounting Research, 45(2), 385-420.
[34] Lee, C. M. C., B. Mucklow and M. Ready (1994), “Spreads, depths, and the impact of earnings information: An intraday analysis,” Review of Financial Studies, 6, 345–374.
[35] Liu, Q. and R. Qi (2006), “Do we accept accrual profi ts at our peril?,” Financial Analysts Journal, 62(4), 62-75.
[36] Lu, C., T. Chen and H. Lio (2010), “Information uncertainty, information asymmetry and corporate bond yield spreads,” Journal of Banking Finance, 34(9), 2265-2279.
[37] Muramiya K., K. Otogawa and T. Takada (2008), “Abnormal accrual, informed trader, and long-term stock return: Evidence from Japan,” Working Paper, Research Institute for Economics & Business Administration, Kobe University.
[38] Myers, S. and N. Majluf (1984), “Corporate financing and investment decisions when firms have information that investors do not have,” Journal of Financial Economics, 13, 187-221.
[39] Percy, M. (2000), “Financial reporting discretion and voluntary disclosure: Corporate research and development expenditure in Australia,” Asia-Pacifi c Journal of Accounting & Economics, 7(1), 1-31. [40] Ross, S. (1977), “The determination of financial structure, the incentive signaling approach,” Bell
Journal of Economics, 8, 23-40.
[41] Shleifer, A. (2000), Ineffi cient Markets: An Introduction to Ineffi cient Markets, Oxford, U.K.: Oxford University Press.
[42] Sloan, R. G. (1996), “Do stock prices fully refl ect information in accruals and cash fl ows about future earnings?,” The Accounting Review, 71, 289-315.
[43] Welker, M. (1995), “Disclosure policy, information asymmetry and liquidity in equity markets,”