Title
Cyclodextrin-Aided Determination of Iodate and Bromate in
Drinking Water by Microcolumn Ion Chromatography with
Precolumn Enrichment( 本文(Fulltext) )
Author(s)
KITAMAKI, Yuko; TAKEUCHI, Toyohide
Citation
[Analytical sciences : the international journal of the Japan
Society for Analytical Chemistry] vol.[20] no.[10]
p.[1399]-[1402]
Issue Date
2004-10-10
Rights
The Japan Society for Analytical Chemistry (社団法人日本分析
化学会)
Version
出版社版 (publisher version) postprint
URL
http://hdl.handle.net/20.500.12099/31756
Introduction
Ozonization has recently replaced the chlorination of many types of water, since ozone is effective for disinfection. However, since ozone is a very strong oxidant, bromide (Br–)
contained in water is also oxidized to form hypobromous acid (HOBr) or hypobromite (OBr–). The latter reacts with excess
ozone to form bromate (BrO3–), which is a disinfection
by-product.1 The toxicity of BrO
3–has been studied, revealing that
BrO3– is carcinogenic to animals.2 Therefore, the maximum
contaminant level of BrO3–has been set at 10 µg L–1by the U.S.
Environmental Protection Agency. However, there are many problems in the determination of BrO3–at such low levels.
There have been reported several methods for the determination of BrO3– by ion chromatography (IC).3,4
Hautman and Bolyard3 achieved the separation of BrO 3– from
chloride (Cl–), carbonate (CO
32–) and nitrate (NO3–) by using
tetraborate/boric acid as an eluent. Joyce and Dhillon4removed
a large level of Cl– in the sample by a pretreatment using a
silver-form cation-exchange resin. However, these methods were less selective to BrO3–because conductometric detectors
were utilized. On the other hand, the selective determination of BrO3–with postcolumn derivatization, based on the formation of
triiodide (I3–) by the reaction of BrO3– and iodide (I–), was
proposed, but this method was not sensitive enough to determine BrO3–in drinking-water samples.5
Nowack et al.6used osmate as a catalyst in the postcolumn
derivatization of ClO3–with I–, followed by the UV detection of
I3–. Although this method is very sensitive, it may not be
suitable for the determination of BrO3–. This is because osmate
is poisonous and difficult to handle. Furthermore, they had to use a hydrogen peroxide solution in the whole postcolumn system in order to remove a black precipitate (OsV). It should
be noted that the black precipitate was gradually formed in the reaction coil, which increased the background absorption and decreased the response of the target signal.
Gas chromatography/mass spectrometry (GC/MS) was utilized for the selective determination of BrO3–at ppb levels.7
This method utilized BrO3–as an oxidant, viz., it oxidized Br–to
bromine (Br2), and the formed Br2then reacted with styrene to
produce a hydroxylbromostyrene derivative to be analyzed by GC/MS. However, this method is too complicated and troublesome to determine BrO3–.
Sensitive and selective detection procedures of BrO3– were
proposed based on the conversion of the oxidant to Br3– by a
postcolumn reaction with Br–under acidic conditions.8,9 These
methods achieved the sensitive and selective determination of BrO3–in drinking water. They had to use a rather complicated
pumping system, viz., three pumps for providing the eluent for IC, sodium bromide (NaBr) as the postcolumn reagent, and sulfuric acid (H2SO4). H2SO4 was used to convert NaBr into
hydrobromic acid (HBr) using a suppressor, followed by a postcolumn reaction.
We previously reported on the determination of iodate (IO3–)
and nitrite (NO2–) as I3–via a postcolumn reaction with I–under
acidic conditions in IC.10 In that work, we found that α
-cyclodextrin (α-CD) improved the sensitivity of the analyte anions, owing to the formation of an inclusion complex between
α-CD and I3–. This is because more I3– is formed to keep the
following equilibriums, where both I3–and the complex between
α-CD and I3–are subjected to UV detection.
I2+ I–/I3–, (1)
I3–+ α-CD / I3–/α-CD (complex). (2)
There are a few anions, such as BrO3–, that react with Br–
under an acidic condition to produce Br3–. It is expected that
Br3– and α-CD also form an inclusion complex, which would
improve the detection limits of the analyte ions. In other words,
2004 © The Japan Society for Analytical Chemistry
Cyclodextrin-Aided Determination of Iodate and Bromate in
Drinking Water by Microcolumn Ion Chromatography with
Precolumn Enrichment
Yuko K
ITAMAKIand Toyohide T
AKEUCHI†Department of Chemistry, Faculty of Engineering, Gifu University, 1-1 Yanagido, Gifu 501–1193, Japan
A selective and simple method for the determination of iodate (IO3–) and bromate (BrO3–) by microcolumn ion
chromatography (IC) is presented. In this study, IO3– and BrO3– were determined as IBr2– and tribromide (Br3–),
respectively, via a postcolumn reaction with bromide (Br–) under acidic conditions with the aid of α-cyclodextrin (α-CD)
in microcolumn IC. IO3–and BrO3–were selectively detected by the present method at a wavelength of 253 or 265 nm.
The present system achieved good selectivity for IO3–and BrO3–as well as good repeatability under suitable conditions.
Precolumn enrichment improved the detection limit, and allowed the determination of BrO3–in bottled water as low as
sub µg L–1level in microcolumn IC.
(Received August 11, 2004; Accepted September 6, 2004)
†To whom correspondence should be addressed. E-mail: [email protected]
the signal intensity of the analyte ions can be improved by incorporating α-CD in the postcolumn reagent solution. The present paper describes the determination of BrO3– via
postcolumn derivatization with the aid of α-CD. The postcolumn reaction conditions were examined for microcolumn IC, where no suppressor was used, leading to a simplified system. Precolumn enrichment was also examined to improve of the sensitivity.
Experimental
Apparatus
A diagram of the apparatus employed in this work is illustrated in Fig. 1. The eluent and the postcolumn reagent solution were supplied at 4.2 µL min–1by using a syringe pump
(MF-2 Microfeeder; Azumadenki Kogyo, Tokyo, Japan) equipped with two MS GAN-050 gas-tight syringes (Ito, Fuji, Japan). Samples were injected with a Model 7520 valve injector with an injection volume of 0.2 µL (Rheodyne; Cotati, CA, USA). An anion-exchanger, an IC-Anion-SW (5 µm particle diameter; Tosoh, Tokyo, Japan), was employed as the stationary phase, and was packed into fused-silica tubing with 100 × 0.32 mm i.d. (GL Sciences, Tokyo, Japan), according to the method previously reported.11 The eluent and the
postcolumn reagent solution were mixed at a Nano Y connector (Upchurch Scientific, Oak Harbor, WA, USA), followed by passing into a fused-silica capillary reaction tube (50 µm i.d.).12
The effluent was monitored by a 2070 Plus Intelligent UV-Vis detector (Jasco, Tokyo, Japan) at 265 nm. Chromatopac C-R4AX (Shimadzu, Kyoto, Japan) was used as a data processor. The absorption spectra of reagent solutions were measured by using a U-4000S spectrophotometer (Hitachi, Tokyo, Japan). Reagents and chemicals
All of the reagents used in this work were obtained from Nacalai Tesque (Kyoto, Japan) or Wako Pure Chemical Industries (Osaka, Japan). All of the reagents were used as received without any purification. Purified water was prepared in the laboratory by using a GS-590 water distillation system (Advantec, Tokyo, Japan).
Bottled water samples were filtered with a 0.45-µm membrane filter, and hydrophobic components were then removed by passing into a laboratory-made precolumn (10 × 0.25 mm i.d.) packed with a hydrophobic packing material, Develosil C30 (30 µm particle diameter; Nomura Chemical, Seto, Japan).
Precolumn enrichment
In microcolumn IC, a precolumn enrichment technique is quite effective for measuring low-level analytes.13 The same
packing material, TSKgel IC-Anion-SW, as for the separation column was employed as the packing material for the precolumn. The precolumn was prepared by using a 0.25 mm i.d. PTFE tubing; the length of the packed bed was 5 mm. A Model M-435 Micro Injection Valve (Upchurch Scientific, Oak Harbor, WA, USA) was used when sample enrichment was necessary.
Results and Discussion
Detection principle and absorption spectra
It is known that BrO3–reacts with Br–to produce Br2under
acidic conditions (Eq. (3)), and Br2 reacts with Br– in the
presence of excess Br–to produce Br
3–(Eq. (4)):
BrO3–+ 5Br–+ 6H+→ 3Br2+ 3H2O, (3)
Br2+ Br–/Br3–. (4)
When α-CD exists in the solution, an inclusion complex between α-CD and the existing Br3–is formed (Eq. (5)):
Br3–+ α-CD / Br3–/α-CD (complex). (5)
Since it was found that the inclusion complex formed between
α-CD and Br3–was more stable than that for β- and γ-CD, α-CD
was used as a promoter in this study. To the best of our knowledge, there has been no paper reported in the literature which discusses the complexation between α-CD and Br3–ion.
The absorption spectra of BrO3– and IO3– dissolved in a
solution containing Br– and H
2SO4 were measured. The local
maximum absorbance of BrO3– was observed at 265 nm,
whereas that of IO3– was 253 nm. This difference may have
been caused by the fact that IO3– reacts with Br– to produce
IBr2–, as suggested in the literature.14 On the contrary, it is
expected that BrO3–reacts with Br–to form Br3–. The extinction
coefficient of IO3–at 253 nm was 2.5-times larger than that of
BrO3–at 265 nm. Therefore, the detection wavelength was set
at 265 nm for the determination of BrO3–. In addition, chlorite
also gave a signal based on the same reaction, and the local maximum absorbance was 265 nm.
Selection of postcolumn reaction conditions
The postcolumn reaction conditions for the determination of BrO3–were examined. The concentrations of NaBr, H2SO4, and
α-CD as well as the postcolumn reaction temperature and reaction tube length affected the signal intensity. The larger was the concentration of sodium bromide, the better was the sensitivity observed for BrO3– up to 1.5 M. Since a slight
increase in the intensity was observed at higher concentrations, a 2 M concentration of NaBr was chosen.
BrO3– can be determined as Br3– by a postcolumn reaction
with Br–under an acidic condition. Usually, HBr generated by
passing NaBr through a suppressor is supplied for the postcolumn reaction.8,9 However, these systems were rather
complicated because three pumps were required for the determination. In this work, we eliminated the suppressor system and incorporated H2SO4 in the postcolumn reagent
solution, leading to a simplified system. The signal intensity for BrO3– increased linearly with increasing the H2SO4
concentration in the postcolumn mixing reaction reagent solution. However, since a higher H2SO4concentration caused
higher background noise, a 0.3 M concentration of H2SO4was
Fig. 1 Experimental apparatus. 1, Syringe pump; 2, eluent; 3, reaction reagent solution; 4, sample injector; 5, separation column; 6, Nano Y connector; 7, reaction coil; 8, UV detector; 9, data processor; 10, drain.
selected while considering the signal-to-noise ratio (S/N). The background of the postcolumn reaction reagent solution was slightly increased as time passed. This may have been caused by the formation of Br3– in the postcolumn reagent solution
containing 2 M NaBr, 0.3 M H2SO4 and 10 mM α-CD. The
peak height was gradually decreased, e.g., ca. 10% decrease in a few hours, compared with that observed by using a fresh solution. Nevertheless, the repeatability of the signal was less than 5%, as discussed below. This drawback may be overcome by adding an adequate internal standard that is subjected to the postcolumn reaction in the same manner. For example, since IO3– is rarely contained in drinking water, it can work as an
internal standard for BrO3–. Actually, it was confirmed that the
peak-height ratio of IO3– and BrO3– was constant even if the
background of the postcolumn reagent solution was varied. The effect of the α-CD concentration in the postcolumn reagent solution on the signal intensity was examined. The signals for IO3– and BrO3–at 10 mM α-CD were 1.9 and
3.3-times larger than those observed in the case without α-CD, respectively. At higher concentrations, the effect of α-CD was not significant, and a slight increase in the signal was observed.
A 1 m length of the reaction coil length was employed, considering the signal intensity and the back pressure across the reaction coil. The lower was the reaction coil temperature, the better was the sensitivity observed for BrO3–. The postcolumn
reaction was therefore carried out at room temperature.
Considering these results, 2 M NaBr, 0.3 M H2SO4 and 10
mM α-CD were selected as the postcolumn reagent conditions. The reaction was performed in a 1 m × 50 µm i.d. capillary coil at room temperature.
Interference from other inorganic anions
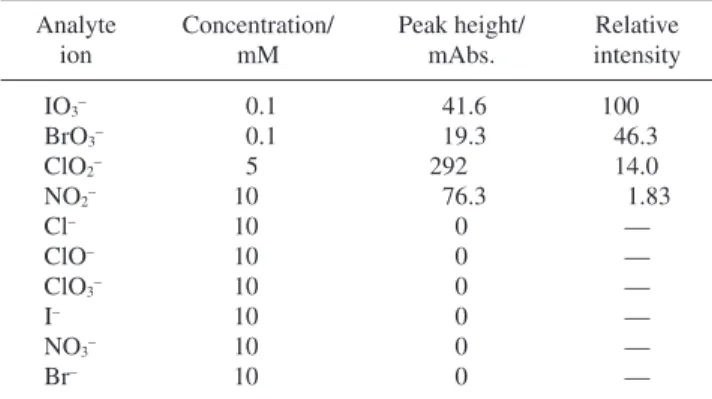
Table 1 gives the relative signal intensity for various inorganic anions. It can be seen that this method is selective to IO3–and
BrO3–. Although ClO2–and NO2–can also be detected by this
method, its sensitivity is not high. Other inorganic anions examined gave no signal.
In addition, copper(II) gave no signal up to 1.0 mg L–1, and its
coexistence did not influence the signal of BrO3–. Sulfite and
ascorbic acid also gave no signal, and they had no influence on the signal of BrO3–.
Determination of iodate and bromate
Figure 2 shows the detection of IO3– and BrO3– under the
selected conditions, where 0.1 mM each of IO3–(17.5 mg L–1)
and BrO3–(12.8 mg L–1) were injected. When the eluent was 10
mM sodium sulfate, IO3– and BrO3– could be completely
separated within 6 min. The relative standard deviations
(RSDs) of the retention times of IO3– and BrO3– for six
successive measurements under the conditions in Fig. 2 were 0.26 and 0.23%, respectively. On the other hand, the RSDs of the peak area were 1.95 and 3.39%, whereas those of the peak height were 2.51 and 4.23%, respectively.
The detection limits at S/N = 3 of IO3– and BrO3– with an
injection volume of 0.2 µL was 0.49 µM (0.086 mg L–1) and 3.6
µM (0.46 mg L–1), respectively, and the quantitation limits at
S/N = 10 were 1.9 µM (0.33 mg L–1) and 6.1 µM (0.78 mg L–1),
respectively. Under the selected conditions, good linear relationships were observed between the peak height and the analyte concentration up to 0.02 and 0.1 mM for IO3–and BrO3–,
respectively. The linear-regression coefficients for the plots were 0.999 and 0.994 for IO3–and BrO3–, respectively.
Unfortunately, the concentration sensitivity achieved above was not sufficient to determine the analytes in real water samples. The drawback of such a poor concentration sensitivity could be solved by precolumn enrichment.13 The higher was the
enrichment ratio, the better was the sensitivity that could be expected. However, since it is presumed that the concentration of matrix ions is much higher than IO3– and BrO3–, the
enrichment ratio is restricted. Actually, for the bottled water samples, the acceptable enrichment ratio was at most 500. At higher than 500, the peak was broadened.
Six different bottled water samples were analyzed with the present microcolumn IC system with precolumn enrichment. The samples were passed through a short column packed with Develosil C30 to remove hydrophobic compounds, followed by passing 100 µL of the eluted solution into the precolumn (500-fold enrichment). BrO3–could be detected for only one of the
six examined samples, whereas IO3– was not detected for the
examined samples.
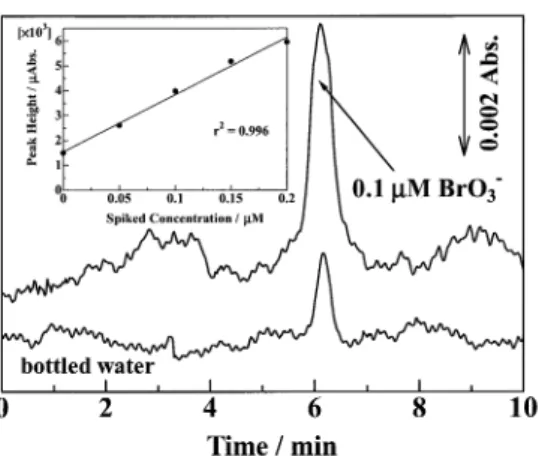
Figure 3 shows a chromatogram for a bottled water sample. Under the conditions in Fig. 3, good linear relationships were observed between the peak height and the analyte concentration up to 0.02 and 0.2 µM for IO3–and BrO3–, respectively. The
spiked recovery of 0.05 – 0.2 µM BrO3–in the bottled water was
97%. The detection limits of IO3–and BrO3–for the enrichment
of a 100 µL sample could be improved to ca. 0.66 and 1.6 µg L–1, respectively. The concentration of BrO
3– in the bottled
water described in Fig. 3 was calculated to be 0.046 µM (5.9 µg L–1). The concentration of BrO
3– was also determined by
microcolumn IC with precolumn enrichment and direct UV detection, and the determination result coincided with that of the Table 1 Signal intensity for various inorganic anions
Operating conditions as in Fig. 2. Analyte ion Concentration/ mM Peak height/ mAbs. Relative intensity IO3– 0.1 41.6 100 BrO3– 0.1 19.3 46.3 ClO2– 5 292 14.0 NO2– 10 76.3 1.83 Cl– 10 0 — ClO– 10 0 — ClO3– 10 0 — I– 10 0 — NO3– 10 0 — Br– 10 0 —
Fig. 2 Detection of IO3–and BrO3–under the selected conditions. Eluent: 10 mM Na2SO4. Reaction reagents: 2 M NaBr, 0.3 M H2SO4 and 10 mM α-cyclodextrin. Sample, 0.1 mM each; injection volume, 0.2 µL; column, IC-Anion-SW (100 × 0.32 mm i.d.); wavelength, 265 nm; reaction coil, 1 m × 50 µm i.d.
present method.13
The present system can reduce the consumption of the reagents, and will be good for the monitoring of IO3–and BrO3–
in drinking-water samples.
Conclusions
The present microcolumn IC system could simplify the system and reduce the amount of reagents required for the determination of IO3–and BrO3–. The addition of α-CD in the
postcolumn reaction reagent solution improved the sensitivity, and could be applied to the determination of BrO3–in bottled
water with the aid of precolumn enrichment. Good repeatability was achieved under the selected conditions. The present
method allowed the selective determination of IO3–and BrO3–at
the µg L–1level.
Acknowledgements
The present work was supported by the Takeda Foundation.
References
1. W. R. Haag and J. Hoigné, Environ. Sci. Technol., 1983, 17, 261.
2. Y. Kurokawa, Y. Hayashi, A. Maekawa, M. Takahashi, T. Kokubo, and S. Odashima, J. Natl. Cancer I, 1983, 71, 965. 3. D. P. Hautman and M. Bolyard, J. Chromatogr., 1992, 602,
65.
4. R. J. Joyce and H. S. Dhillon, J. Chromatogr. A, 1994, 671, 165.
5. T. Môri, C. Nishioka, H. Ishikawa, and H. Kuroda, Shokuhin Eiseigaku Zasshi, 1985, 26, 260.
6. B. Nowack and U. von Gunten, J. Chromatogr. A, 1999, 849, 209.
7. P. J. Nyman, B. J. Canas, F. L. Joe, Jr, and G. W. Diachenko, Food Addit. Contam., 1996, 13, 623.
8. Y. Inoue, T. Sakai, H. Kumagai, and Y. Hanaoka, Anal. Chim. Acta, 1997, 346, 299.
9. H. S. Weinberg and H. Yamada, Anal. Chem., 1998, 70, 1. 10. Y. Kitamaki, J.-Y. Jin, and T. Takeuchi, J. Pharm. Biomed.
Anal., 2003, 30, 1751.
11. T. Takeuchi and D. Ishii, J. Chromatogr., 1981, 213, 25. 12. T. Takeuchi, S. Masuoka, and J.-Y. Jin, J. Sep. Sci., 2003,
26, 635.
13. L. Lim, T. Miwa, and T. Takeuchi, Anal. Sci., 2001, 17 (Supplement), i887.
14. Y. Bichsel and U. von Gunten, Anal. Chem., 1999, 71, 34. Fig. 3 Detection of BrO3– in a bottled water sample. Operating
conditions as in Fig. 2, except for injection method and the sample. Precolumn, IC-Anion-SW (5 × 0.25 mm i.d.); sample volume, 100 µL bottled water.